Nobody appreciate it !!!Currently, ETH is forming an ascending triangle, indicating a potential price increase. It is anticipated that the price could rise, aligning with the projected price movement (AB=CD).
However, it is crucial to wait for the triangle to break before taking any action.
Give me some energy !!
✨We spend hours finding potential opportunities and writing useful ideas, we would be happy if you support us.
Best regards CobraVanguard.💚
_ _ _ _ __ _ _ _ _ _ _ _ _ _ _ _ _ _ _ _ _ _ _ _ _ _ _ _ _ _ _ _
✅Thank you, and for more ideas, hit ❤️Like❤️ and 🌟Follow🌟!
⚠️Things can change...
The markets are always changing and even with all these signals, the market changes tend to be strong and fast!!
ETHEREUM trade ideas


BUY ETHUSDETHUSD technical analysis is aligning with fundamentals. We have seen a breakout from the channel, I am expecting price to pump up into 2080 before Monday. Huge entities like Black Rock are purchasing huge amounts of ETH, let us follow my fellow retailers

ETHUSD Will Go Higher! Buy!
Take a look at our analysis for ETHUSD.
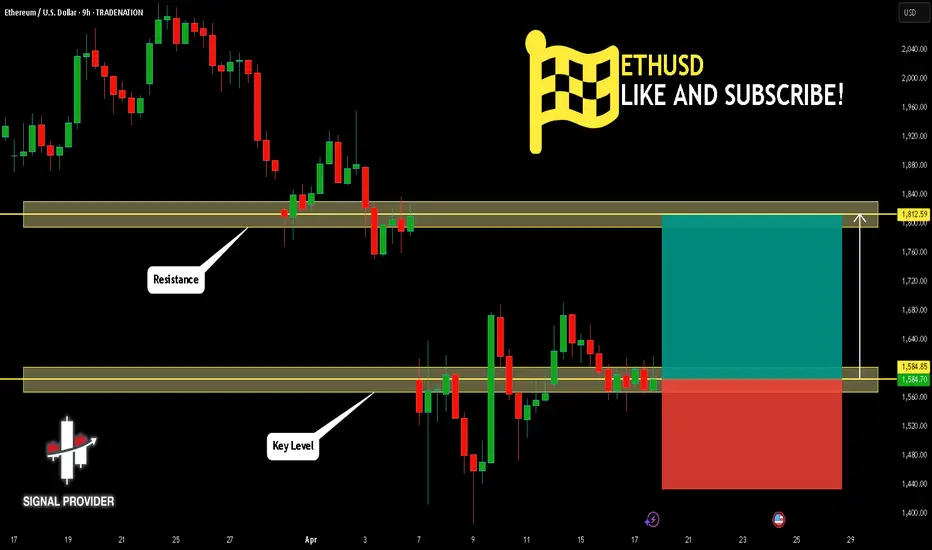
Time Frame: 9h
Current Trend: Bullish
Sentiment: Oversold (based on 7-period RSI)
Forecast: Bullish
The market is testing a major horizontal structure 1,584.85.
Taking into consideration the structure & trend analysis, I believe that the market will reach 1,812.59 level soon.
P.S
The term oversold refers to a condition where an asset has traded lower in price and has the potential for a price bounce.
Overbought refers to market scenarios where the instrument is traded considerably higher than its fair value. Overvaluation is caused by market sentiments when there is positive news.
Disclosure: I am part of Trade Nation's Influencer program and receive a monthly fee for using their TradingView charts in my analysis.
Like and subscribe and comment my ideas if you enjoy them!
ETHThe chart looks like Bitcoin’s movement in 2020. I think it will rise to $4,000 by autumn. If it breaks that level, we could see $8,000–$10,000 by 2026, and and possibly even reach $14,000.
At the moment, it’s hard to believe this forecast, but the market can move any way, and there’s always a chance this scenario could happen.

ETH/USD "Ethereum vs U.S Dollar" Crypto Heist Plan (Day/Swing)🌟Hi! Hola! Ola! Bonjour! Hallo! Marhaba!🌟
Dear Money Makers & Robbers, 🤑 💰💸✈️
Based on 🔥Thief Trading style technical and fundamental analysis🔥, here is our master plan to heist the ETH/USD "Ethereum vs U.S Dollar" Crypto Market. Please adhere to the strategy I've outlined in the chart, which emphasizes long entry. Our aim is to escape near the high-risk YELLOW ATR Zone. Risky level, overbought market, consolidation, trend reversal, trap at the level where traders and bearish robbers are stronger. 🏆💸"Take profit and treat yourself, traders. You deserve it!💪🏆🎉
Entry 📈 : "The heist is on! Wait for the MA breakout (1840) then make your move - Bullish profits await!"
however I advise to Place Buy stop orders above the Moving average (or) Place buy limit orders within a 15 or 30 minute timeframe most recent or swing, low or high level for Pullback entries.
📌I strongly advise you to set an "alert (Alarm)" on your chart so you can see when the breakout entry occurs.
Stop Loss 🛑: "🔊 Yo, listen up! 🗣️ If you're lookin' to get in on a buy stop order, don't even think about settin' that stop loss till after the breakout 🚀. You feel me? Now, if you're smart, you'll place that stop loss where I told you to 📍, but if you're a rebel, you can put it wherever you like 🤪 - just don't say I didn't warn you ⚠️. You're playin' with fire 🔥, and it's your risk, not mine 👊."
📍 Thief SL placed at the nearest/swing low level Using the 3H timeframe (1650) Day / Swing trade basis.
📍 SL is based on your risk of the trade, lot size and how many multiple orders you have to take.
🏴☠️Target 🎯: 2100 (or) Escape Before the Target
🧲Scalpers, take note 👀 : only scalp on the Long side. If you have a lot of money, you can go straight away; if not, you can join swing traders and carry out the robbery plan. Use trailing SL to safeguard your money 💰.
💰💵💴💸ETH/USD "Ethereum vs U.S Dollar" Crypto Market Heist Plan (Day / Swing Trade) is currently experiencing a bullishness🐂.., driven by several key factors.☝☝☝
📰🗞️Get & Read the Fundamental, Macro Economics, COT Report, Quantitative Analysis, Sentimental Outlook, Intermarket Analysis, Future trend targets... go ahead to check 👉👉👉🔗🔗
⚠️Trading Alert : News Releases and Position Management 📰🗞️🚫🚏
As a reminder, news releases can have a significant impact on market prices and volatility. To minimize potential losses and protect your running positions,
we recommend the following:
Avoid taking new trades during news releases
Use trailing stop-loss orders to protect your running positions and lock in profits
💖Supporting our robbery plan 💥Hit the Boost Button💥 will enable us to effortlessly make and steal money 💰💵. Boost the strength of our robbery team. Every day in this market make money with ease by using the Thief Trading Style.🏆💪🤝❤️🎉🚀
I'll see you soon with another heist plan, so stay tuned 🤑🐱👤🤗🤩

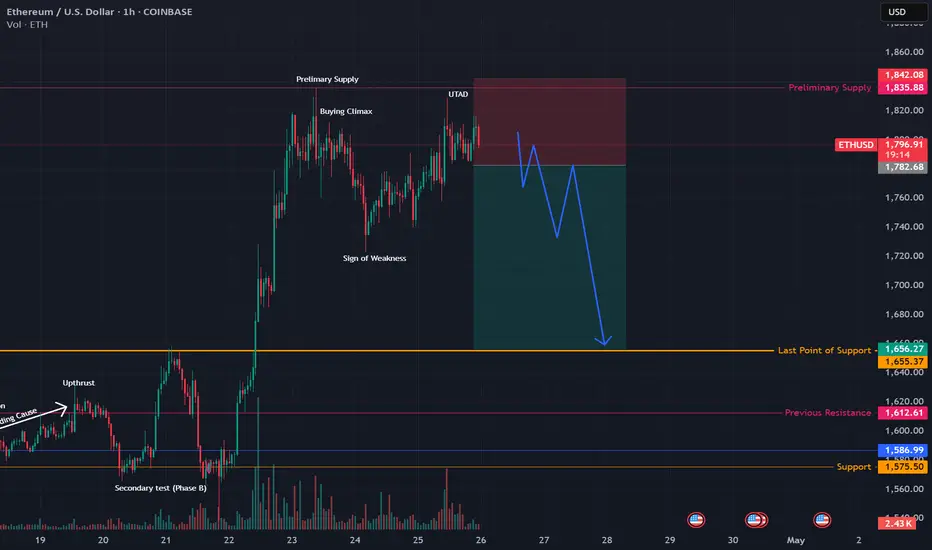
ETH Showing Weakness in Wyckoff DistributionLooks like we may see a nice pull back this weekend. Price has failed to break the labeled Buying Climax and is showing signs of a reversal. Retracement could be back to the last point of support around $1655. Here it can accumulate and continue its up move. I have posted a Idea targeting $2700, I still think this could be in play
Short-Medium Recovery For ETHUSDInverted H&S reversal likely building. Bearish continuation structure on Left Shoulder likely sees a mirroring effect here, synchronicity is common in shoulder formations and makes for a stronger neckline.
Targeting 2392 (+25%) should we get a meaningful break of 1820 level.
Trade Status - Pending. Likely to chop around a bit more first (see potetnial left shoulder formation). Look for tightening volatility compression for more optimal entry.

Bullish on ETHAlso quick #ETH analysis for you boyz.
Price did manage to cross this red trendline which was holding the price down and Its showing signs of forming a Higher Lows. Those two are early indicators of trend reversal.
Lets Keep an eye on 200 EMA

ETHEREUM BULLISH SIGNALMAKE SURE YOU MANAGE A PROPER RISK REWARD RATIO THIS IS A GOOD ENTRY FOR LONG WITH ETH. PRETTY BULLISH
As of April 25, 2025, Ethereum (ETH) is trading at approximately $1,811.85, reflecting a 2.3% increase from the previous close. The intraday high reached $1,820.32, while the low was $1,744.49.
Looking ahead, Ethereum is poised for significant growth, with projections suggesting potential price levels ranging from $5,000 to $14,000 by the end of 2025. These optimistic forecasts are underpinned by several key factors:
Institutional Adoption: The approval of Ethereum ETFs is expected to attract substantial institutional investment, enhancing liquidity and market confidence.
Bitsz
Technological Upgrades: Upcoming enhancements, such as the PECTRA upgrade, aim to improve scalability and efficiency, making Ethereum more attractive for decentralized applications and enterprise solutions.
The Currency analytics
+1
Bitsz
+1
Regulatory Clarity: Anticipated regulatory developments, including clearer guidelines on staking and potential favorable policies, could bolster investor confidence and adoption.
MarketWatch
While the current price is below its all-time high, Ethereum's foundational role in decentralized finance (DeFi), smart contracts, and NFTs positions it for substantial appreciation in the coming months.
In summary, Ethereum's bullish outlook is supported by strong institutional interest, ongoing technological advancements, and a favorable regulatory environment, suggesting a promising trajectory toward new all-time highs in 2025.

The end of seasonal growth, reducing work positionsThe seasonal growth cycle is ending this week. For most of the market, the sales cycle begins on Sunday. In the new week, we can still expect pumps for the turn of the month for individual coins. From Sunday to Tuesday, the probability of a market drawdown prevails as part of a pullback on the current weekly candle and shadow rendering for the new week. For coins that have already attempted to turn the month around, the probability of stable sales until the end of May already prevails from this week. From Tuesday to May 7-9 or 11-12, there will still be a flat period, when, with a general market pullback, individual coins may show growth, then the probability of a return of ether to 1500-1600 prevails, with a possible reversal and drawdown of the altcoin market. Today and tomorrow, I recommend reducing positions on coins, especially those that have shown good growth, in order to avoid drawdowns in the new month.
In the first half of the new week, growth impulses for coins that have not yet attempted to turn the current monthly candle into a bullish one are more likely. In particular, pumping is possible using vib wing and pda, which are awaiting delisting. For coins without the monitoring tag, it is better to make further purchases after the announcement of the tag assignment in the new week, because after the rollback from Sunday to Tuesday, coins can lose up to 50% additionally in the second half of the week if the tag is assigned. I will collect the list of coins for work in May after the announcement of the tag assignment.

ETH is moving within the 1,550.00 - 1,830.00 range👉🏼 Possible scenario:
Ethereum dropped 3.3% to $1,754, echoing a broader 3.6% market correction. But under the surface, long-term holders are accumulating, with over 640,000 ETH flowing into wallets that haven’t sold since 2018—a multi-year high.
On-chain metrics show growing conviction: active addresses surged 10% in just two days, signaling rising network engagement. Despite short-term volatility, investor positioning suggests quiet confidence in Ethereum’s long-term fundamentals.
✅Support and Resistance Levels
Support level is now located at 1,550.00.
Now, the resistance level is located at 1,830.00.

Bullish bounce off 50% Fibonacci support?Ethereum (ETH/USD) is falling towards the pivot and could bounce to the 1st resistance.
Pivot: 1,671.81
1st Support: 1,547.72
1st Resistance: 1,829.87
Risk Warning:
Trading Forex and CFDs carries a high level of risk to your capital and you should only trade with money you can afford to lose. Trading Forex and CFDs may not be suitable for all investors, so please ensure that you fully understand the risks involved and seek independent advice if necessary.
Disclaimer:
The above opinions given constitute general market commentary, and do not constitute the opinion or advice of IC Markets or any form of personal or investment advice.
Any opinions, news, research, analyses, prices, other information, or links to third-party sites contained on this website are provided on an "as-is" basis, are intended only to be informative, is not an advice nor a recommendation, nor research, or a record of our trading prices, or an offer of, or solicitation for a transaction in any financial instrument and thus should not be treated as such. The information provided does not involve any specific investment objectives, financial situation and needs of any specific person who may receive it. Please be aware, that past performance is not a reliable indicator of future performance and/or results. Past Performance or Forward-looking scenarios based upon the reasonable beliefs of the third-party provider are not a guarantee of future performance. Actual results may differ materially from those anticipated in forward-looking or past performance statements. IC Markets makes no representation or warranty and assumes no liability as to the accuracy or completeness of the information provided, nor any loss arising from any investment based on a recommendation, forecast or any information supplied by any third-party.

Update: Enter The Heavens (ETH)Keeping it simple is often the way to go. I believe the image is self explanatory.

Enter The HeavensI’m 60/40 on this setup…maybe 75/25. I believe ETH has snatched up enough liquidity to enter the heavens. We shall see.

ETHUSD Will Go Up From Support! Long!
Take a look at our analysis for ETHUSD.
Time Frame: 8h
Current Trend: Bullish
Sentiment: Oversold (based on 7-period RSI)
Forecast: Bullish
The market is testing a major horizontal structure 1,754.52.
Taking into consideration the structure & trend analysis, I believe that the market will reach 1,966.56 level soon.
P.S
Overbought describes a period of time where there has been a significant and consistent upward move in price over a period of time without much pullback.
Disclosure: I am part of Trade Nation's Influencer program and receive a monthly fee for using their TradingView charts in my analysis.
Like and subscribe and comment my ideas if you enjoy them!

Ethereum (ETH/USD) Elliott Wave Macro Analysis – Wave (3) Has BeCOINBASE:ETHUSD
🔵 Macro Count Overview
Ethereum has been unfolding a clean macro impulsive structure since the 2021 high and 2022 low:
November 2021: Major Wave ① top
June 2022: Bear market bottom, forming Wave ②
From there, we began a new impulsive cycle with a clear internal structure:
→ 1-2-3-4-5, which completed Wave (1) in December 2024
🟢 Recent Developments – The Foundation for Wave (3)
Over the last few weeks, Ethereum has formed a textbook Wave (2) bottom.
The correction respected the Fibonacci retracement zones perfectly and provided a strong base.
We’ve already seen a clean breakout to the upside, signaling that Wave (3) may now be underway.
🟨 What’s Next – Building Wave (3)
We are now likely in the early stages of Wave (3), which is expected to unfold in a yellow internal 1-2-3-4-5 structure.
This sequence will drive the price into significantly higher zones, confirming the start of a powerful bullish leg.
🎯 Target Zone for Wave (3):
$6,600 – $7,200
Based on Fibonacci extensions of the prior impulse (Wave 1)
Potential for higher extensions if momentum and volume align
Psychological resistance may act as short-term hurdles, but structure points higher
✅ Conclusion
Ethereum has completed its macro Wave (2) correction and is now gearing up for an extended Wave (3). With a breakout already underway, the internal structure points to a 5-wave advance likely aiming for $6,600–$7,200 or higher. As long as recent lows hold, this scenario remains firmly in play.

EthereumETHUSD
- Bearish Channel as an corrective pattern in Short Time Frame
- Break of Structure
- RSI - Divergence
- Completed " 1234 " Impulsive Waves
- Change of Characteristics

ETH/USDI think Ethereum is in wave 4. Wave C of the triangle has completed. I do not expect a new price ceiling for Ethereum for the Altcoin Season. For wave D, I expect growth to the $3,600 range.

ETHUSD - IdeaCould the triangles be comparable?
With the first leading to a strong break out upwards
Have we hit the bottom of the next triangle?
I think these would be ascending triangles
Saw this chart or a similar version floating around and thought it would be a good post
Weekly timeframe


(ETH) ethereum "rays - month by year pattern(s)"I drew lines between each year connecting each month one year at a time using rays so that the lines would continue on through the chart. I was hoping this would give me some indication of a pattern or view on the chart that would reveal something ideal to see into the future.
...I do see one tiny pattern.
At the beginning of 2022 the previous early months rays were ascending but by the second quarter the rays were descending. That is the same thing that happened this year. The hopeful becomes the hopeless.
Are we in for a horrible Ethereum year?
