ETHEREUM BULLISH SIGNALMAKE SURE YOU MANAGE A PROPER RISK REWARD RATIO THIS IS A GOOD ENTRY FOR LONG WITH ETH. PRETTY BULLISH
As of April 25, 2025, Ethereum (ETH) is trading at approximately $1,811.85, reflecting a 2.3% increase from the previous close. The intraday high reached $1,820.32, while the low was $1,744.49.
Looking ahead, Ethereum is poised for significant growth, with projections suggesting potential price levels ranging from $5,000 to $14,000 by the end of 2025. These optimistic forecasts are underpinned by several key factors:
Institutional Adoption: The approval of Ethereum ETFs is expected to attract substantial institutional investment, enhancing liquidity and market confidence.
Bitsz
Technological Upgrades: Upcoming enhancements, such as the PECTRA upgrade, aim to improve scalability and efficiency, making Ethereum more attractive for decentralized applications and enterprise solutions.
The Currency analytics
+1
Bitsz
+1
Regulatory Clarity: Anticipated regulatory developments, including clearer guidelines on staking and potential favorable policies, could bolster investor confidence and adoption.
MarketWatch
While the current price is below its all-time high, Ethereum's foundational role in decentralized finance (DeFi), smart contracts, and NFTs positions it for substantial appreciation in the coming months.
In summary, Ethereum's bullish outlook is supported by strong institutional interest, ongoing technological advancements, and a favorable regulatory environment, suggesting a promising trajectory toward new all-time highs in 2025.
ETHEREUM trade ideas

The end of seasonal growth, reducing work positionsThe seasonal growth cycle is ending this week. For most of the market, the sales cycle begins on Sunday. In the new week, we can still expect pumps for the turn of the month for individual coins. From Sunday to Tuesday, the probability of a market drawdown prevails as part of a pullback on the current weekly candle and shadow rendering for the new week. For coins that have already attempted to turn the month around, the probability of stable sales until the end of May already prevails from this week. From Tuesday to May 7-9 or 11-12, there will still be a flat period, when, with a general market pullback, individual coins may show growth, then the probability of a return of ether to 1500-1600 prevails, with a possible reversal and drawdown of the altcoin market. Today and tomorrow, I recommend reducing positions on coins, especially those that have shown good growth, in order to avoid drawdowns in the new month.
In the first half of the new week, growth impulses for coins that have not yet attempted to turn the current monthly candle into a bullish one are more likely. In particular, pumping is possible using vib wing and pda, which are awaiting delisting. For coins without the monitoring tag, it is better to make further purchases after the announcement of the tag assignment in the new week, because after the rollback from Sunday to Tuesday, coins can lose up to 50% additionally in the second half of the week if the tag is assigned. I will collect the list of coins for work in May after the announcement of the tag assignment.

ETH is moving within the 1,550.00 - 1,830.00 range👉🏼 Possible scenario:
Ethereum dropped 3.3% to $1,754, echoing a broader 3.6% market correction. But under the surface, long-term holders are accumulating, with over 640,000 ETH flowing into wallets that haven’t sold since 2018—a multi-year high.
On-chain metrics show growing conviction: active addresses surged 10% in just two days, signaling rising network engagement. Despite short-term volatility, investor positioning suggests quiet confidence in Ethereum’s long-term fundamentals.
✅Support and Resistance Levels
Support level is now located at 1,550.00.
Now, the resistance level is located at 1,830.00.

Bullish bounce off 50% Fibonacci support?Ethereum (ETH/USD) is falling towards the pivot and could bounce to the 1st resistance.
Pivot: 1,671.81
1st Support: 1,547.72
1st Resistance: 1,829.87
Risk Warning:
Trading Forex and CFDs carries a high level of risk to your capital and you should only trade with money you can afford to lose. Trading Forex and CFDs may not be suitable for all investors, so please ensure that you fully understand the risks involved and seek independent advice if necessary.
Disclaimer:
The above opinions given constitute general market commentary, and do not constitute the opinion or advice of IC Markets or any form of personal or investment advice.
Any opinions, news, research, analyses, prices, other information, or links to third-party sites contained on this website are provided on an "as-is" basis, are intended only to be informative, is not an advice nor a recommendation, nor research, or a record of our trading prices, or an offer of, or solicitation for a transaction in any financial instrument and thus should not be treated as such. The information provided does not involve any specific investment objectives, financial situation and needs of any specific person who may receive it. Please be aware, that past performance is not a reliable indicator of future performance and/or results. Past Performance or Forward-looking scenarios based upon the reasonable beliefs of the third-party provider are not a guarantee of future performance. Actual results may differ materially from those anticipated in forward-looking or past performance statements. IC Markets makes no representation or warranty and assumes no liability as to the accuracy or completeness of the information provided, nor any loss arising from any investment based on a recommendation, forecast or any information supplied by any third-party.

Update: Enter The Heavens (ETH)Keeping it simple is often the way to go. I believe the image is self explanatory.

Enter The HeavensI’m 60/40 on this setup…maybe 75/25. I believe ETH has snatched up enough liquidity to enter the heavens. We shall see.

ETHUSD Will Go Up From Support! Long!
Take a look at our analysis for ETHUSD.
Time Frame: 8h
Current Trend: Bullish
Sentiment: Oversold (based on 7-period RSI)
Forecast: Bullish
The market is testing a major horizontal structure 1,754.52.
Taking into consideration the structure & trend analysis, I believe that the market will reach 1,966.56 level soon.
P.S
Overbought describes a period of time where there has been a significant and consistent upward move in price over a period of time without much pullback.
Disclosure: I am part of Trade Nation's Influencer program and receive a monthly fee for using their TradingView charts in my analysis.
Like and subscribe and comment my ideas if you enjoy them!

Ethereum (ETH/USD) Elliott Wave Macro Analysis – Wave (3) Has BeCOINBASE:ETHUSD
🔵 Macro Count Overview
Ethereum has been unfolding a clean macro impulsive structure since the 2021 high and 2022 low:
November 2021: Major Wave ① top
June 2022: Bear market bottom, forming Wave ②
From there, we began a new impulsive cycle with a clear internal structure:
→ 1-2-3-4-5, which completed Wave (1) in December 2024
🟢 Recent Developments – The Foundation for Wave (3)
Over the last few weeks, Ethereum has formed a textbook Wave (2) bottom.
The correction respected the Fibonacci retracement zones perfectly and provided a strong base.
We’ve already seen a clean breakout to the upside, signaling that Wave (3) may now be underway.
🟨 What’s Next – Building Wave (3)
We are now likely in the early stages of Wave (3), which is expected to unfold in a yellow internal 1-2-3-4-5 structure.
This sequence will drive the price into significantly higher zones, confirming the start of a powerful bullish leg.
🎯 Target Zone for Wave (3):
$6,600 – $7,200
Based on Fibonacci extensions of the prior impulse (Wave 1)
Potential for higher extensions if momentum and volume align
Psychological resistance may act as short-term hurdles, but structure points higher
✅ Conclusion
Ethereum has completed its macro Wave (2) correction and is now gearing up for an extended Wave (3). With a breakout already underway, the internal structure points to a 5-wave advance likely aiming for $6,600–$7,200 or higher. As long as recent lows hold, this scenario remains firmly in play.

EthereumETHUSD
- Bearish Channel as an corrective pattern in Short Time Frame
- Break of Structure
- RSI - Divergence
- Completed " 1234 " Impulsive Waves
- Change of Characteristics

ETH/USDI think Ethereum is in wave 4. Wave C of the triangle has completed. I do not expect a new price ceiling for Ethereum for the Altcoin Season. For wave D, I expect growth to the $3,600 range.

ETHUSD - IdeaCould the triangles be comparable?
With the first leading to a strong break out upwards
Have we hit the bottom of the next triangle?
I think these would be ascending triangles
Saw this chart or a similar version floating around and thought it would be a good post
Weekly timeframe


(ETH) ethereum "rays - month by year pattern(s)"I drew lines between each year connecting each month one year at a time using rays so that the lines would continue on through the chart. I was hoping this would give me some indication of a pattern or view on the chart that would reveal something ideal to see into the future.
...I do see one tiny pattern.
At the beginning of 2022 the previous early months rays were ascending but by the second quarter the rays were descending. That is the same thing that happened this year. The hopeful becomes the hopeless.
Are we in for a horrible Ethereum year?

(ETH) ethereum "years - phases"The phase of the Ethereum chart in years using colors to represent each year and to visually show what happened during those years. So far this year is cold and losing. Will Ethereum recover and create a new pattern never before seen or will this entire year be in vain while wishing and hoping and believing that the price will turn itself around? The year of 2025 the year of AI.


Eth Bullish Divergence Before the Last big rise to 4k we saw a Hidden bullish divergence.Now at this Moment we have a bullish divergence which could lead to a big jump in price.I am bullish above 1750k on the monthly Close.
Targets : 4k-7500k
Good Luck

Ethereum is Overbought at $1,835FenzoFx—Ethereum remains bullish, trading near $1,800 after a momentum slowdown at this level. A long-wick bearish candle has formed on the 4-hour chart, though resistance here is limited. Overbought readings on the Stochastic and RSI 14 suggest short-term saturation.
ETH is holding above key support at $1,755. Caution is advised—buying into an overextended market isn't ideal. A pullback toward $1,755 or $1,690 may offer better entry points if bullish signals appear.
The trend stays intact above the 50-SMA, with potential to reach $1,950. However, a drop below $1,565 could shift the bias to bearish, eyeing $1,470 and $1,370 next.

ETH big ass bull penantLFG
Few clean patterns
Angled cup and handle
Penant on last leg
Not financial advice

#ETH/USDT#ETH
The price is moving within a descending channel on the 1-hour frame, adhering well to it, and is heading for a strong breakout and retest.
We are seeing a rebound from the lower boundary of the descending channel, which is support at 1555.
We have a downtrend on the RSI indicator that is about to be broken and retested, supporting the upward trend.
We are looking for stability above the 100 moving average.
Entry price: 1591
First target: 1628
Second target: 1658
Third target: 1695

Ethereum H4 | Falling toward a pullback supportEthereum (ETH/USD) is falling towards a pullback support and could potentially bounce off this level to climb higher.
Buy entry is at 1,674.75 which is a pullback support that aligns close to the 38.2% Fibonacci retracement.
Stop loss is at 1,520.00 which is a level that lies underneath a multi-swing-low support and the 61.8% Fibonacci retracement.
Take profit is at 1,913.15 which is a swing-high resistance.
High Risk Investment Warning
Trading Forex/CFDs on margin carries a high level of risk and may not be suitable for all investors. Leverage can work against you.
Stratos Markets Limited (tradu.com):
CFDs are complex instruments and come with a high risk of losing money rapidly due to leverage. 63% of retail investor accounts lose money when trading CFDs with this provider. You should consider whether you understand how CFDs work and whether you can afford to take the high risk of losing your money.
Stratos Europe Ltd (tradu.com):
CFDs are complex instruments and come with a high risk of losing money rapidly due to leverage. 63% of retail investor accounts lose money when trading CFDs with this provider. You should consider whether you understand how CFDs work and whether you can afford to take the high risk of losing your money.
Stratos Global LLC (tradu.com):
Losses can exceed deposits.
Please be advised that the information presented on TradingView is provided to Tradu (‘Company’, ‘we’) by a third-party provider (‘TFA Global Pte Ltd’). Please be reminded that you are solely responsible for the trading decisions on your account. There is a very high degree of risk involved in trading. Any information and/or content is intended entirely for research, educational and informational purposes only and does not constitute investment or consultation advice or investment strategy. The information is not tailored to the investment needs of any specific person and therefore does not involve a consideration of any of the investment objectives, financial situation or needs of any viewer that may receive it. Kindly also note that past performance is not a reliable indicator of future results. Actual results may differ materially from those anticipated in forward-looking or past performance statements. We assume no liability as to the accuracy or completeness of any of the information and/or content provided herein and the Company cannot be held responsible for any omission, mistake nor for any loss or damage including without limitation to any loss of profit which may arise from reliance on any information supplied by TFA Global Pte Ltd.
The speaker(s) is neither an employee, agent nor representative of Tradu and is therefore acting independently. The opinions given are their own, constitute general market commentary, and do not constitute the opinion or advice of Tradu or any form of personal or investment advice. Tradu neither endorses nor guarantees offerings of third-party speakers, nor is Tradu responsible for the content, veracity or opinions of third-party speakers, presenters or participants.

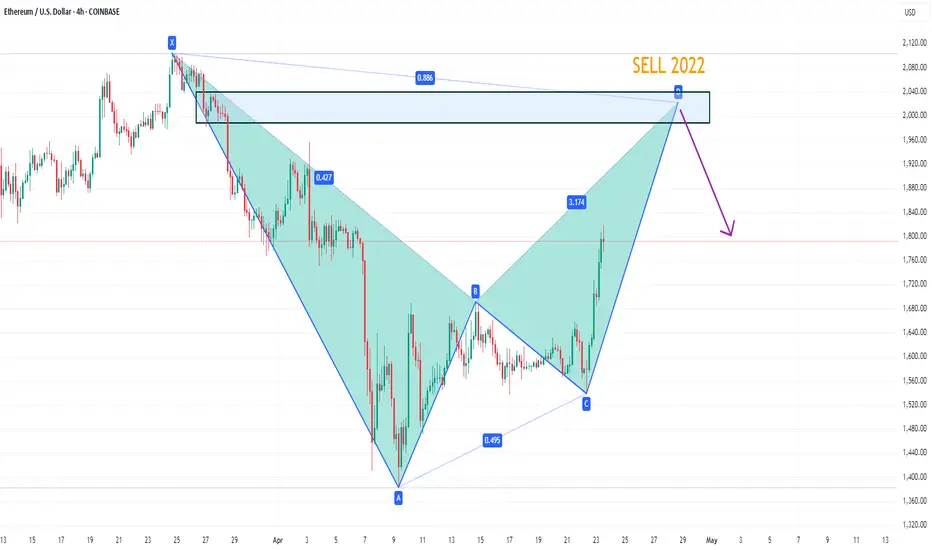
ETHUSD potential bearish bat patternOn the 4-hour chart, ETHUSD stabilized and rebounded. The current upper resistance is around 2022. Once it reaches that level, pay attention to the potential bearish bat pattern. At the same time, this position is in the previous supply area.
ETHEREUM | 1H | IMPORTANT LEVELS AND MY TARGETHey there, my dear friends!
I’ve taken a deep dive into BINANCE:ETHUSDT just for you. If it breaks above the 1,693 level, the next target will be 1,800.0. On the flip side, a key support level sits around 1,473.0.
All I ask in return is your support through likes — it really means a lot!
Big thanks to everyone showing love and support with those likes!

Could the price reverse from here?Ethereum (ETH/USD) is rising towards the pivot which is an overlap resistance and could reverse to the 1st support which is a pullback support.
Pivot: 1.851.36
1st Support: 1,683.61
1st Resistance: 1,945.78
Risk Warning:
Trading Forex and CFDs carries a high level of risk to your capital and you should only trade with money you can afford to lose. Trading Forex and CFDs may not be suitable for all investors, so please ensure that you fully understand the risks involved and seek independent advice if necessary.
Disclaimer:
The above opinions given constitute general market commentary, and do not constitute the opinion or advice of IC Markets or any form of personal or investment advice.
Any opinions, news, research, analyses, prices, other information, or links to third-party sites contained on this website are provided on an "as-is" basis, are intended only to be informative, is not an advice nor a recommendation, nor research, or a record of our trading prices, or an offer of, or solicitation for a transaction in any financial instrument and thus should not be treated as such. The information provided does not involve any specific investment objectives, financial situation and needs of any specific person who may receive it. Please be aware, that past performance is not a reliable indicator of future performance and/or results. Past Performance or Forward-looking scenarios based upon the reasonable beliefs of the third-party provider are not a guarantee of future performance. Actual results may differ materially from those anticipated in forward-looking or past performance statements. IC Markets makes no representation or warranty and assumes no liability as to the accuracy or completeness of the information provided, nor any loss arising from any investment based on a recommendation, forecast or any information supplied by any third-party.
