ETHFI Looks Super Bullish (1D)It seems that wave C of our higher-degree correction has completed. Wave C appears to be a diametric pattern.
As long as the green zone holds, the price could advance toward the red Flip zone, where wave D may form.
A daily candle closing below the invalidation level would invalidate this view.
F

ETHFI PERPETUAL TRADE, Sold From $1.06 ETHFI PERPETUAL TRADE
ETHFI SELL SETUP
Currently $1.06
Sold From $1.06
(Trading plan If ETHFI go up to $1.15
will add more shorts)
Expecting target $0.98 OR DOWN
Incase of early exist will update this anaylsis
Its not a Financial advice

Possible 38% dump on $ETHFII will be trying a small short on ETHFI. Entry/SL/TP present in chart. Shorting based on DCRT.
#NFA #DYOR

EtherFi ETH.fi price analysis⁉️ Increased trading volumes, shrinking growth candlesticks, and a trend line "overhang" - for us, these factors indicate the likelihood that a correction is near.... And for you?
The #ETHfi price shot up nicely thanks to promising updates to the #Ethereum ecosystem, about which we write a few post

ETHFI Breakout Loading? Targets Up to $1.67!$ETHFI/USDT Analysis
Price is currently trading around a key resistance zone after a strong recovery from recent lows. While momentum looks bullish, the resistance has not been broken yet — making this a crucial level to watch.
A clean breakout and candle close above this zone could confirm a pot

ETHFI Bulls Return — Double Bottom Reversal in Play🟢 ETHFI/USDT – 4H Double Bottom Breakout
BINANCE:ETHFIUSDT.P
📍 Timeframe: 4H
📊 Setup Type: Double Bottom (Reversal)
⚠️ Risk Level: Low-Moderate
🧠 Technical Breakdown:
Price has formed a Double Bottom pattern, a strong reversal structure signaling seller exhaustion and potential trend reversal:

ETHFIUSDT 1DETHFI ~ 1D Analysis
#ETHFI The seller's pressure seems to have begun to decline. Buy after successfully penetrating this resistant line with a short -term target of at least 10%+.

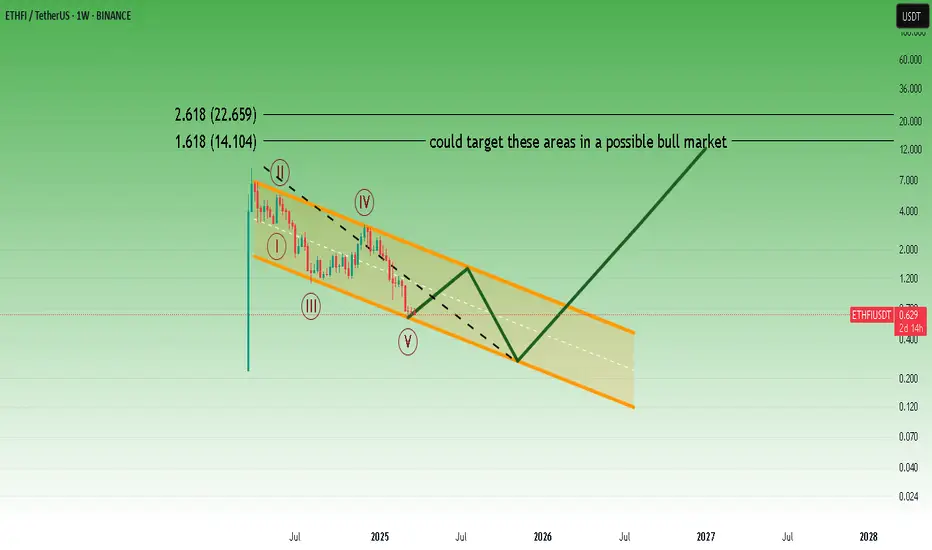
Think simple.In such falling channels, the 3rd bottom point is the ideal buy point for me for bullmarket portfolio
* What i share here is not an investment advice. Please do your own research before investing in any asset.
* Never take my personal opinions as investment advice, you may lose all your money.
ETHFI | BTC | ETH | SUI | TRUMPIf ETHFI breaks 710 resistance
a potential target is 200 4hr MA
Use stop loss if there is fakeout.

ETHFIUSDT 12HETHFI ~ 12H Analysis
#ETHFI Buy gradually after successfully penetrating this resistant line with a short -term target of at least 10%+.

See all ideas
Summarizing what the indicators are suggesting.
Oscillators
Neutral
SellBuy
Strong sellStrong buy
Strong sellSellNeutralBuyStrong buy
Oscillators
Neutral
SellBuy
Strong sellStrong buy
Strong sellSellNeutralBuyStrong buy
Summary
Neutral
SellBuy
Strong sellStrong buy
Strong sellSellNeutralBuyStrong buy
Summary
Neutral
SellBuy
Strong sellStrong buy
Strong sellSellNeutralBuyStrong buy
Summary
Neutral
SellBuy
Strong sellStrong buy
Strong sellSellNeutralBuyStrong buy
Moving Averages
Neutral
SellBuy
Strong sellStrong buy
Strong sellSellNeutralBuyStrong buy
Moving Averages
Neutral
SellBuy
Strong sellStrong buy
Strong sellSellNeutralBuyStrong buy
Displays a symbol's price movements over previous years to identify recurring trends.