ETH/USD Coinbase Trading Plan. AI Prediction Apr 29, 2025 ETH/USD Trading Plan
Short-Term (24-48 Hours)
Long Entry : 1825 (Confirmed if price breaks 1830 with volume >6000).
SL : 1795 (10 points below support). TP: 1845 (just above resistance). Trailing Stop: 1.5% after TP1 (1845).
Short Entry : 1795 (Confirmed if price closes below 1800 with volume >5000).
SL : 1815 (10 points above entry). TP: 1760 (above 1750 support). Trailing Stop: 1.5% after TP1 (1760).
Long-Term (3-7 Days)
Long Entry : 1850 (Confirmed with daily close above 1840 + rising volume).
SL : 1820 (30 points below breakout). TP: 1900. Trailing Stop: 2% after price reaches 1900.
Short Entry : 1740 (Confirmed with daily close below 1750).
SL : 1765 (15 points above entry). TP: 1700. Trailing Stop: 2% after price hits 1700.
Re-Evaluate Forecasts If:
- Price stalls at key levels (1840 or 1750) for >6 hours without momentum.
- Volume drops sharply during a breakout/breakdown.
- External catalysts (news, macros) emerge.
Confirmation Tools:
Volume spikes (>6000 for longs, >5000 for shorts), candlestick reversals (hammer/shooting star), and consolidation breaks.
Disclaimer: This is not financial advice. Crypto markets are highly volatile and speculative. Always do your own research and consult a qualified financial advisor before investing. You could lose your entire investment.
ETHUSD.P trade ideas

ETHUSD INTRADAY sideways consolidation supported at 1726ETH/USD maintains a bullish sentiment, supported by an ongoing upward trend. However, recent intraday price action shows signs of sideways consolidation, suggesting a pause or potential setup before the next significant move.
Key Levels:
Support: 1,726 (primary), followed by 1,680 and 1,620
Resistance: 1,910, with extended targets at 1,960 and 2,020
The 1,726 level serves as a critical pivot point, marking a previous consolidation zone. A pullback toward this level followed by a bullish rebound could reaffirm the uptrend and set the stage for a move toward the 1,910 resistance. A breakout above 1,910 would likely open the path to higher targets at 1,960 and 2,020 over the medium to long term.
On the other hand, a daily close below 1,726 would weaken the bullish structure and could trigger a deeper retracement toward 1,680 and potentially 1,620.
Conclusion:
ETH/USD remains in a bullish trend, but short-term consolidation may precede the next leg up. Traders should monitor the 1,726 support level closely—its defense could signal trend continuation, while a breakdown would increase downside risk.
This communication is for informational purposes only and should not be viewed as any form of recommendation as to a particular course of action or as investment advice. It is not intended as an offer or solicitation for the purchase or sale of any financial instrument or as an official confirmation of any transaction. Opinions, estimates and assumptions expressed herein are made as of the date of this communication and are subject to change without notice. This communication has been prepared based upon information, including market prices, data and other information, believed to be reliable; however, Trade Nation does not warrant its completeness or accuracy. All market prices and market data contained in or attached to this communication are indicative and subject to change without notice.

ETH is moving within the 1,755.00 - 1,860.00 range👀 Possible scenario:
Ethereum began a downward correction below $1,780 but is now consolidating around the $1,800 level. The price may attempt a breakout above $1,820, though resistance near $1,815 remains a key hurdle.
Meanwhile, whale accumulation is rising, and ETH ETFs saw their first net inflow in eight weeks—signaling renewed investor confidence. The Ethereum Foundation also announced leadership changes to strengthen strategic direction, naming Hsiao-Wei Wang and Tomasz K. Stańczak as co-executive directors.
✅Support and Resistance Levels
Support level is now located at 1,755.00.
Now, the resistance level is located at 1,860.00.

ETHUSD Short Set Up (28 April, 2025My SHORT Trend Continuation SET UP on ETHUSD. From price 1756.48 and I am anticipating that ETHUSD will reach the price 1557.76 where my target is.

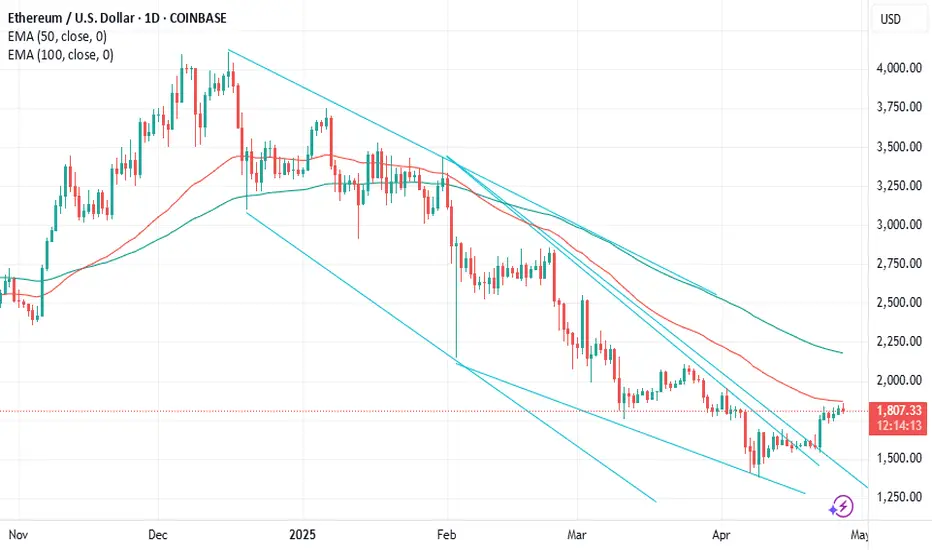
Ethereum Trades Sideways: Bulls Need a PushFenzoFx—Ethereum is trading sideways but remains above the 50-period simple moving average, signaling a bullish market. ETH is currently priced around $1,785. A close above $1,835 could trigger a move toward the $1,950 resistance.
Bearish Scenario:
If Ethereum falls below $1,690, supported by the 50-period simple moving average (4-hour chart), it could decline toward the $1,565 support level.

Bearish drop off pullback resistance?Ethereum (ETH/USD) is reacting off the pivot and could drop to the 1st support.
Pivot: 1,808.27
1st Support: 1,451.43
1st Resistance: 2,102.09
Risk Warning:
Trading Forex and CFDs carries a high level of risk to your capital and you should only trade with money you can afford to lose. Trading Forex and CFDs may not be suitable for all investors, so please ensure that you fully understand the risks involved and seek independent advice if necessary.
Disclaimer:
The above opinions given constitute general market commentary, and do not constitute the opinion or advice of IC Markets or any form of personal or investment advice.
Any opinions, news, research, analyses, prices, other information, or links to third-party sites contained on this website are provided on an "as-is" basis, are intended only to be informative, is not an advice nor a recommendation, nor research, or a record of our trading prices, or an offer of, or solicitation for a transaction in any financial instrument and thus should not be treated as such. The information provided does not involve any specific investment objectives, financial situation and needs of any specific person who may receive it. Please be aware, that past performance is not a reliable indicator of future performance and/or results. Past Performance or Forward-looking scenarios based upon the reasonable beliefs of the third-party provider are not a guarantee of future performance. Actual results may differ materially from those anticipated in forward-looking or past performance statements. IC Markets makes no representation or warranty and assumes no liability as to the accuracy or completeness of the information provided, nor any loss arising from any investment based on a recommendation, forecast or any information supplied by any third-party.

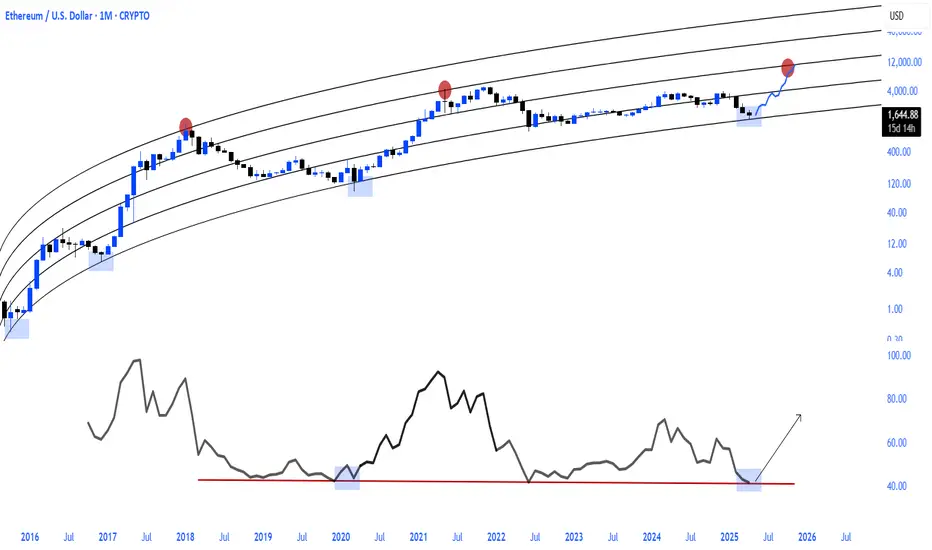
ETH/USD🖼️ Macro Chart Overview (Weekly Timeframe):
Ethereum (ETH/USD) recently completed a significant technical structure on the weekly timeframe: a Rising Wedge, a pattern commonly associated with trend reversals from bullish to bearish conditions.
This chart captures the full life cycle of Ethereum's rally from the 2022–2024 lows, the topping pattern across late 2024, and the recent sharp breakdown confirming a shift in market sentiment.
🧩 Detailed Pattern Breakdown:
🔹 Formation of the Rising Wedge:
Higher Highs + Higher Lows: During the rally, price action consistently printed higher highs and higher lows, but within a narrowing price range.
Volume Behavior: As typical with wedges, trading volume declined during the wedge formation — a subtle sign of weakening bullish conviction.
Resistance Confluence: Price repeatedly failed near the $4,000 psychological zone, suggesting heavy distribution.
🔹 Breakdown Confirmation:
The rising wedge broke to the downside with a high-volume weekly bearish candle.
Subsequent price action showed no strong bullish recovery attempts, confirming that bulls had lost control.
📊 Key Technical Levels:
🔵 Resistance Zones:
$3,800 - $4,100: Major multi-week resistance; multiple failed breakouts.
$2,767 (SL Level): Secondary structure where breakdown retests may occur. A clean break above this would invalidate the bearish thesis.
🟢 Support Zones:
$1,500 - $1,600: Minor historical support (currently being tested during pullback).
$1,000 - $1,050: Major historical support from the 2020-2021 cycle, and the final target area.
⚡ Stop Loss and Target:
Stop Loss (SL): $2,767 — strategic location above last swing highs and resistance.
Take Profit (TP): Partial TP before $1,200 minor support; final TP around $1,007 major zone.
📉 Bearish Trading Strategy:
🪝 Trade Entry:
Wait for the current bullish pullback to complete.
Look for reversal candlestick patterns (bearish engulfing, shooting star, etc.) on Daily or 4H timeframes near local resistances.
Short entries ideally after rejection near minor resistance levels.
🛡️ Trade Management:
Secure partial profits at intermediate zones if sharp moves occur.
Trail stop to break-even once initial targets are hit.
Full exit at the $1,007 target or if bullish reversal structures start forming on high timeframes.
🔮 Price Behavior Expectations:
Short-term: Possible minor rally as price retests broken structure.
Mid-term: Bearish continuation to test lower support zones.
Long-term: A confirmed close below $1,000 could open doors for even deeper corrections (potential re-test of sub-$800 zones if macro conditions worsen).
🌐 Broader Market Context:
Macro Economic Factors (Fed policies, rate changes, global liquidity) are currently unfavorable for high-risk assets like cryptocurrencies.
Bitcoin correlation remains high — any breakdown in BTC will likely accelerate ETH’s downside.
Ethereum Fundamentals (network upgrades, ETH burn rate) could cushion some downside but are unlikely to counteract broad market trends alone.
🧠 Final Thoughts:
Ethereum is currently displaying one of the clearest bearish technical setups seen in recent months. The breakdown of a major rising wedge on a weekly chart suggests a potential major market correction rather than a minor retracement.
While short-term bounces are normal, the structure remains heavily bearish unless the price reclaims and holds above key resistance levels ($2,767 and higher). Traders should focus on trend following, risk management, and scaling into positions cautiously.
Patience will be key, as high-timeframe setups like these can take several weeks to fully play out.
🚀 Summary Checklist:
✅ Rising Wedge Breakdown Confirmed
✅ Resistance Strong at $4,000
✅ Bearish Pullback Setup in Progress
✅ Targeting $1,007 Support
✅ SL placed safely above key resistance
✅ Trade with risk management and patience

#Ethereum + $10k Local top!#Ethereum + $10k Local top!
A real #Altcoins Season will only begin when CRYPTOCAP:ETH rises.
Whether you love it or hate it, it's just a fact and the truth is always bitter.
Short-Term Trade Setup (30-min Timeframe) Date: 27/04/2025Entry Price: 1811.30
Target Price: 1786
Stop Loss: 1821
Trade Type: Short (Sell)
Disclaimer:
This trade idea is shared for educational and informational purposes only. It is not financial advice or a recommendation to buy or sell any asset. Trading involves substantial risk, and you should only trade with money you can afford to lose. Always do your own research or consult with a licensed financial advisor before making trading decisions.


Bet on ETH or SOL ?ETH vs SOL.
Which will outperform for the next year?
You really think ETH will just continue losing value against SOL?

srSupport and resistance analysis is a fundamental technique in technical trading used to identify price levels where buying or selling pressure has historically been strong enough to reverse or pause a trend. Support represents a price zone where demand tends to overcome selling pressure, preventing the asset from falling further. Conversely, resistance marks a level where selling interest outweighs buying pressure, capping upward price movement. Traders use these zones to anticipate potential price reactions, manage risk, and plan entry or exit points, recognizing that broken support can become new resistance and vice versa.

ETHUSD: Strong Growth Ahead! Long!
My dear friends,
Today we will analyse ETHUSD together☺️
The market is at an inflection zone and price has now reached an area around 1.800.9 where previous reversals or breakouts have occurred.And a price reaction that we are seeing on multiple timeframes here could signal the next move up so we can enter on confirmation, and target the next key level of 1.828.4.Stop-loss is recommended beyond the inflection zone.
❤️Sending you lots of Love and Hugs❤️

Ethereum Trade IdeaEthereum has broken out of it's ascending triangle pattern.
A possible retest of the triangle resistance levels which might turn to support.
If the level holds up that will be a begining of a new uptrend for Ethereum.

Ethereum signal Ethereum sell......
Entry .....1814.6
Target..............1800
SL.............1827.7

ETH SUNDAY SHORTshort from test after UTAD in distribution/ re-acummulation pattern, looking to reach the low of the range before reversing up again.

Wajani Investments: ETHUSD AnalysisPair is currently at demand zone acting as a strong support become resistance zone as shown. Price has also made it first LH at current price. In addition, a wedge is formed which is usually a reversal pattern as shown. All these factors point to the fact that this pair is done shorting and the bulls are ready to take the market up.
Let me know your thoughts.
Thank you.

ETH bullish Super bullish as BTC leads as market indicator. A great place to take a risk after recovering 10% from lows.
Entry to TP1 is looking good.

ETH/USD Breakout Trading Setup – Long Entry with 16% Target PoteEntry Point: $1,593.08
Target Point: $1,807.83
Stop Loss: $1,472.68
Risk/Reward Ratio: Roughly 2.1:1
Indicators Used:
EMA 30 (Red Line) at $1,593.08 (near entry point)
EMA 200 (Blue Line) at $1,605.09
Analysis:
1. Consolidation Phase:
ETH is in a sideways range after a prior downtrend, consolidating within the purple support zone.
This zone (~$1,555 to ~$1,593) has been tested multiple times, suggesting a strong base.
2. Bullish Breakout Anticipation:
The setup expects a breakout above consolidation, targeting a 16.11% move to $1,807.83.
A breakout strategy is being applied, assuming ETH will reverse from this consolidation area a

Nobody appreciate it !!!Currently, ETH is forming an ascending triangle, indicating a potential price increase. It is anticipated that the price could rise, aligning with the projected price movement (AB=CD).
However, it is crucial to wait for the triangle to break before taking any action.
Give me some energy !!
✨We spend hours finding potential opportunities and writing useful ideas, we would be happy if you support us.
Best regards CobraVanguard.💚
_ _ _ _ __ _ _ _ _ _ _ _ _ _ _ _ _ _ _ _ _ _ _ _ _ _ _ _ _ _ _ _
✅Thank you, and for more ideas, hit ❤️Like❤️ and 🌟Follow🌟!
⚠️Things can change...
The markets are always changing and even with all these signals, the market changes tend to be strong and fast!!


