Ethereum (ETH): Buyers Forming Market Structure Break Ethereum has made a decent foundation near $1,500, where buyers have formed a market structure break and secured the area.
This might be the turning point for the Ethereum and we might see a great start of a rally from here, as price has not yet reached anywhere near its potential price near ATHs, while Bitcoin has already formed its new high.
What we are expecting is the possible market volume to flow into ETH and coins that have been built on the Ethereum blockchain so we will be keeping an eye on them.
Swallow Academy
ETHUSDT.3S trade ideas

Ethereum: The biggest Opportunity in 2025!Ethereum is following Bitcoin—but with way worse performance. While BTC is still holding up relatively well, ETH has dropped all the way back to March 2023 levels, wiping out the entire rally. Since its top, Ethereum is down over 63%. 😮💨
Still—or maybe because of that—I’m beginning to slowly scale into spot positions here.
Yes, we could fall further. I’ve got limit orders set lower, specifically around $1,260, which aligns with the 88.2% Fibonacci retracement and the midpoint of the monthly order block. That’s a key zone I’ll be watching if price keeps dropping.
That said, this Wave (2) should be nearing its final stage. The sell-off has been steep, and if we lose $804, that would flip Ethereum’s entire monthly structure bearish—a scenario I’d consider extremely negative.
I don’t expect ETH to suddenly blast past $5,000 from here, but at these levels, I see a clear opportunity to build longer-term spot exposure—and that’s exactly what I’m starting to do now.

Stromm | ETHEREUM No Life Signal YETCompared to Bitcoin, Ethereum is honestly still moving at a snail’s pace — and the performance is almost embarrassing at this point.
There’s still barely any strength showing on the CRYPTOCAP:ETH chart.
Yes, ETH has finally reclaimed the Previous Monthly Low, and it’s holding it — which is a positive step.
But let’s be real:
We’re still 83% below the Yearly Open — a mind-blowing distance when you consider how BTC is behaving right now.
I'm currently risk-free on my trade here, which is a nice position to be in.
If we get another drop, I plan to add at the next Monthly Order Block.
But something serious needs to happen at the Ethereum Foundation level — real fundamental shifts — if ETH is going to deliver the kind of rally people keep hoping for.
Otherwise?
Everything else in the market is outperforming ETH by a mile — and that’s the worst-case scenario for Ethereum:
It doesn't die,
It just gets left behind.
For now, at least I’m sitting in profit, and that's a good start.
Everything beyond this will need careful watching — no blind assumptions, no blind faith.
ETH needs to prove itself — and fast.

Two Bullish Scenarios to Watch on ETHUSDTThis week, BINANCE:ETHUSDT has shown a significant upward movement, and there's a good chance it could continue its bullish momentum.
There are two bullish scenarios developing on BINANCE:ETHUSDT :
1. After a pullback, we could see an impulsive move that breaks the previous high (marked with the red arrow) and pushes the price towards the first target at 1,911 – 1,957.
2. The price could move sideways for a while, forming a bullish pennant pattern. In this case, a correction towards 1,756 – 1,731 might occur before the price resumes its move to the first target at 1,911 – 1,957.
Both scenarios remain valid as long as the price holds above 1,722.
If the second scenario plays out, the pullback to 1,756 – 1,731 can be considered a good buy zone (for those who are not in position yet).
Remember: wait for a confirmation candle before entering and place your stop-loss just below the confirmation candle.

ETHUSD SHORT 1PercentFundedTICKER: ETHUSD
ENTRY 1: 1810
ENTRY 2: 1795
SL: 1865
TP1: 1720
TP2: 1680
Trade Active
ETH USDT LONG TRADE SETUPETH is currently holding a strong support level , with a high probability of the price moving upwards. Additionally, other indicators, such as the 200 EMA, are also acting as support .

Ethereum Potential UpsidesHey Traders, in today's trading session we are monitoring ETHUSDT for a buying opportunity around 1780 zone, Ethereum is trading in an uptrend and currently is in a correction phase in which it is approaching the trend at 1780 support and resistance area.
Trade safe, Joe.

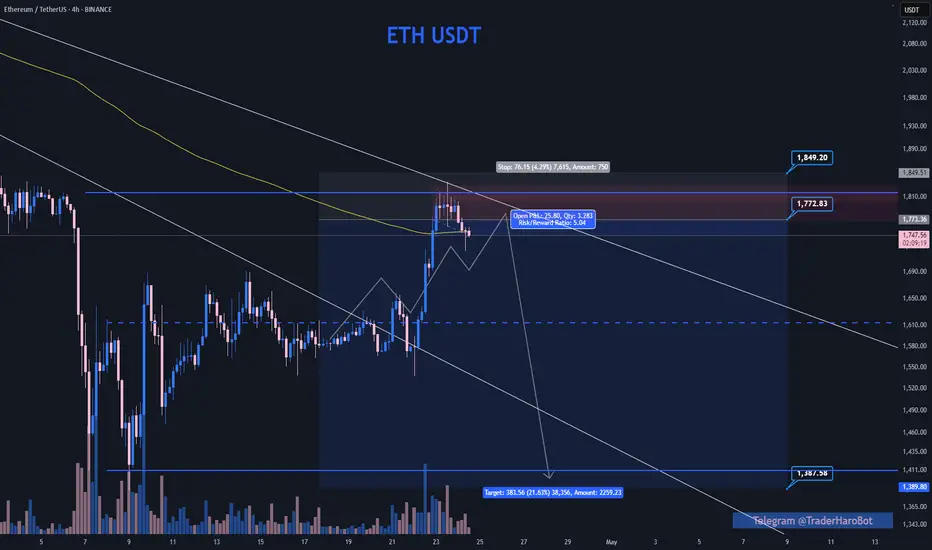
Ethereum | Short | Money Flow Weakness | (April 2025)Ethereum (ETHUSDT) | Partial Profit + Watching Short Setup | Money Flow Weakness | (April 27, 2025)
1️⃣ Insight Summary:
Ethereum is showing early signs of weakness as money begins to flow out. I'm taking partial profits and carefully watching for a possible short setup if momentum continues to shift downward.
2️⃣ Trade Parameters:
Bias: Partial profit taken; preparing for possible Short
Entry Zone: Watching current levels for short entries if weakness confirms
Stop Loss: Above recent local highs (if short position is activated)
TP1: Dynamic — adjust based on structure breaks
Partial Exits: Continue trimming profits on any major liquidity grabs or breakdowns
3️⃣ Key Notes:
✅ Order flow shows clear signs of money exiting Ethereum — confirming caution is needed.
✅ My own indicators align with the outflow and loss of bullish momentum.
✅ Partial profits locked to secure gains before volatility increases.
✅ Potential for a much deeper move down exists if selling pressure accelerates.
❌ Risk if a sudden reversal trap happens — short setups must wait for full confirmation.
4️⃣ Follow-up:
I will stay flexible here and update if we get a stronger breakdown or if conditions change rapidly.
Please LIKE 👍, FOLLOW ✅, SHARE 🙌 and COMMENT ✍ if you enjoy this idea! Also share your ideas and charts in the comments section below! This is best way to keep it relevant, support us, keep the content here free and allow the idea to reach as many people as possible.
Disclaimer: This is not financial advice. Always conduct your own research. This content may include enhancements made using AI.

ETH/USDTHello, traders
Now this isnt meant to be a prediction of any kind, rather a supporting chart to the BTC pair i posted already. This is typically how these bottoms would unfold in the case of a broadening bottom, or inverted head and shoulders.
Looking for support above 1754, to reclaim this range, however it doesnt have to come back that far, and i wouldnt want to see it fall back into that deviation zone under1685.
The idea being, the breakdown lower got rejected, and traders are looking for confirmation of support, back inside of the range. If thats achieved, we're going to look for the range high, and the partial decline typically, which is your last sign of strength before the mark up phase.

Ethereum Starts Moving Toward $7,000 With...Ethereum starts its next major advance towards a target of $7,000 and beyond with a full green candle this week.
This week is not only a full green candle signal it also cancels out the last two which produced a bottom and neutral signal, as well as recover more than three weeks of bearish action.
So now Ethereum is moving back to levels it traded back in late March, above $1,800. Going to this level means higher prices and this is only the start.
The 7-April week is such a strong clear reversal signal it is hard to explain. We have a Doji with a multi-year low, but this low ended with a green candle and confirmation comes this week as Ethereum turns full green. This is the last chance to get Ethereum below $2,000 and while prices are low.
When the next move happens, which is a close and confirmation above $1820, ETHUSDT will never trade at these prices and levels again, likely ever. It will grow and grow so much that nobody will be selling as much as they sold in the past. The start of a new long-term bullish cycle; the 2025 bull market.
I wanted to let you know that market conditions are green and you don't have to hold anymore. The market will start moving and produce a period of expansion that has not been seen in so long.
Even if you have experience with previous bull markets, it is hard to put in words. When it is happening it is so much different. It is not the same saying or knowing that Ethereum will grow as seeing it happen, and when it happens it goes more than what you think is possible or you are prepared for.
If for some reason you did not position yourself when the time was right, now, you will be thinking, "Why didn't I buy? The market was trading so low for long..."
You don't have to reach this point.
The charts are yours, the market is yours and you have experience.
You can take advantage of this situation and become a big winner in 2025 and beyond.
Many millionaires will be produced this year, will you be one of those?
I don't know but I am working hard.
Let's win together, we can do this with hard work, smart work and dedication.
Thanks a lot for your support.
Namaste.

ETH/USDT – Rising Wedge Breakdown ConfirmedEthereum has officially broken down from the rising wedge pattern on the 1-hour chart, confirming a bearish reversal. The wedge breakdown was accompanied by a clear bearish divergence between price and RSI, where price made higher highs but RSI formed lower highs — a strong early warning of weakening bullish momentum. 🔻
The price action has now closed below the wedge support line, signaling potential continuation to the downside.
🔹 Current Outlook:
Breakdown has been confirmed with a bearish candle close below support.
RSI is turning down, suggesting more room for further downside movement.
Immediate minor support zones are near $1780 and $1750.
Bigger target lies around $1690 based on the measured move of the wedge.
🔹 Trade Management:
✅ If you are already short from the wedge break,
managing the trade with stop-loss above $1850 would be reasonable.\
✅ First take-profit levels: $1750, then $1690 for extended targets.
📌 Note: Watch for retest scenarios — price might come back toward the broken wedge support (~$1800–$1810) before continuing the drop ("kiss of death" retest pattern).

Ethereum (ETH/USDT) BULLISH wave?Ethereum’s weekly price chart reveals a structured trading range, with the cryptocurrency oscillating between a well-defined range low and range high. This cyclical pattern has repeated over time, suggesting that ETH could be poised for another upward move. However, confirmation will be essential before traders commit to any directional bias.
The chart demonstrates a consistent range-bound structure, where ETH finds strong buying support at the range low and faces resistance at the range high. Recently, the price has retested the lower boundary, signaling a potential bullish reversal. If past trends persist, Ethereum could face key resistance levels at $2,484, $2,910, $3,254, and $3,743 which we could mark as upside targets with the $4,200 level marking a critical breakout point.
If Ethereum surpasses $4,200, it could trigger a strong bullish trend. However, a failure to break this level may result in a return to the lower range, continuing the established cycle. A weekly close above $2,200 would reinforce a bullish outlook, while a break below support could lead to further downside pressure.
While the market hints at an upward move, caution is advised. Investors should watch for volume confirmations and price action signals at resistance zones. External factors such as macroeconomic conditions and fundamental developments could also influence Ethereum’s trajectory. Proper risk management remains key to navigating potential price fluctuations.

ETH / USDT supporting chart for the BTC pairNow this isnt meant to be a prediction of any kind, rather a supporting chart to the BTC pair i posted already. This is typically how these bottoms would unfold in the case of a broadening bottom, or inverted head and shoulders.
Looking for support above 1754, to reclaim this range, however it doesnt have to come back that far, and i wouldnt want to see it fall back into that deviation zone under1685.
The idea being, the breakdown lower got rejected, and traders are looking for confirmation of support, back inside of the range. If thats achieved, we're going to look for the range high, and the partial decline typically, which is your last sign of strength before the mark up phase.
None of this HAS to happen, just merely larping what ive seen in previous bottoms, including BTCs bear. If we see a change in character here, or a partial rise, with the inability to retest the range high / neckline, then of course, i will restrategize.

ETH/USDTHello friends
Given the price growth we had, it is now natural for the price to correct and we will buy in steps during the correction.
The purchase and target points have also been specified...
Follow capital management.
*Trade safely with us*

Every top on the Ethereum chart is a bullish trap..!This analysis is based on equilibrium levels and a special type of precise equilibrium Fibonacci... As you can see, the equilibrium levels are drawn from two ceilings in purple and orange colors... After breaking the main purple zone, the candles are moving towards the middle purple zone, which coincides with the dense area of the support in the range of $ 1200... Ethereum will soon return to the lower dense area in the picture and the middle purple zone... Every top on the Ethereum chart is a bullish trap..!

ETH Short - Sweep of 12 H HighsETH Short was planned 5 days prior to when it got triggered, main idea is a sweep of the 12 H highs, and a continuation of the bear trend on higher time frames.
We got the sweep, now we wait for the setup to play out.
ETH ShortLast night got a distribution model 1 on ETH confirmed with a BOS on the 15 min. Technical target is the range low, but since we are above a 15 day range this could evolve into a PO3 which would bring ETH to new lows. I would love to see BTC's distibution model and USDT's accumulation model to confirm for more validation. Invalidation for ETH is above the recent high.

Ethereum Up 30% — But Is This the Start of a Trend Reversal..?Ethereum Up 30% — But Is This the Start of a Trend Reversal..?
Ethereum has seen a notable bounce this month, climbing approximately 30% from its local bottom of $1,400 to its current level around $1,800. While this rally might appear promising at first glance, a deeper look at the daily timeframe reveals a more cautious picture.
Despite the recent price surge, Ethereum remains technically in a **downtrend**. A well-respected downtrend continues to hold as resistance, and ETH is currently **retesting this trendline**. This point of contact now sets the stage for two potential scenarios:
**Scenario 1: Rejection from the Trendline**
If Ethereum fails to break above the trendline, it’s likely to face **rejection**, which could send the price back toward the $1,400 level. A revisit to this support zone would form a **potential double bottom**, a classic reversal pattern. If that plays out, we could then start to look for signs of a genuine trend reversal.
**Scenario 2: Breakout Above the Trendline**
On the other hand, if ETH manages to **break through the trendline**, that alone shouldn't be a green light to go long just yet. There’s a significant resistance level sitting around **$2,100**, which has previously acted as a ceiling for price action. A true breakout would require Ethereum not only to cross this level but also to **sustain above it for 2–3 days**. Only then could a long position be considered relatively safer, with upside targets extending to **$2,800** and even **$4,000**.
**Final Thoughts**
While the recent rally is encouraging, it's essential to remain cautious. The downtrend isn't officially over until key technical levels are cleared and held. Until Ethereum breaks above both the downtrend and the $2,100 resistance zone — and proves its strength with sustained movement — the **best strategy may be to sit on the sidelines** and let the market play out.
Patience often pays in crypto — and right now, **watching closely** could be the smartest move.

Long trade
ETHUSDT Buyside Trade – Full Journal
Date/Time: Saturday, 25th April 2025, 7:55 AM NY Time
Pair: ETHUSDT
Session: London AM
Entry TF: 5min
🔹 Entry: 1789.52
🔹 Take Profit: 1826.93 (+2.88%)
🔹 Stop Loss: 1775.30 (–0.42%)
🔹 Risk-Reward Ratio: 5.40
Trade Reasoning
Price showed bullish structure with higher lows forming leading into the London open.

ETH SHORT SETUP ALL trading ideas have entry point + stop loss + take profit + Risk level.
hello Traders, here is the full analysis for this pair, let me know in the comment section below if you have any questions, the entry will be taken only if all rules of the strategies will be satisfied. I suggest you keep this pair on your watchlist and see if the rules of your strategy are satisfied. Please also refer to the Important Risk Notice linked below.
Disclaimer
ETH SHORT TRADE SETUP
ENTRY : 1949.24
PROFIT : 1725.06
STOP : 2020.31

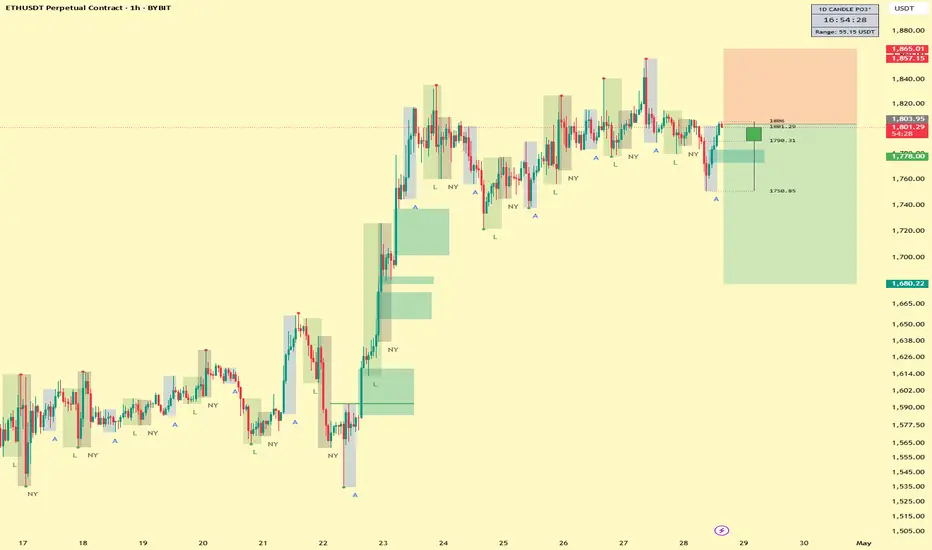
ETH TO THE MOON TRADEETHUSDT Weekly Analysis | 3M & 12M Supply/Demand Zones
Currently, Ethereum (ETHUSDT) is trading around $1803, sitting close to major higher timeframe zones:
3-Month Supply/Demand Zone: ~$1691
12-Month Supply/Demand Zone: ~$1557
Price has reacted strongly near the 3M S/D zone after a multi-month decline. Holding above this zone could indicate a potential bottom formation.
Reminder:
This is not financial advice. Always do your own research and trade with proper risk management.

Long trade
Trade Overview: ETHUSD – Long Position
Entry Price: 1778.55
Take Profit (TP1): 1808.63 (+1.68%)
Stop Loss: 1774.44 (–0.23%)
Risk-Reward Ratio (RR): 7.52
🕖 Entry Time: 7:45 AM (New York Time)
📅 Date: Saturday, 26th April 2025
🌍 Session: NY AM
🧭 Entry Timeframe: 1-Hour TF (focused on FVG)
Reasoning Narrative
ETHUSD showed clear bullish intent on the 1-hour timeframe, with price forming a series of higher highs and lows. Leading into the entry, the market had recently filled a fair value gap (FVG) left behind from the prior bullish expansion, signalling a potential continuation setup.
5min TF Overview

Ethereum (ETH/USDT) – Elliott Wave Long-Term AnalysisBINANCE:ETHUSDT
📈 Ethereum (ETH/USDT) – Elliott Wave Long-Term Analysis
🕒 1W Chart – Macro Projection
According to my Elliott Wave count, Ethereum is currently completing a complex WXY correction in wave 4. The final leg, wave C of (Y), could drive the price down into the key support zone between $895 – $865, aligning with the 161.8% Fibonacci extension.
✅ Buy zone: $895 – $865
❌ Invalidation: sustained break below $865
🔴 Major resistance: $3,509
🚀 If the structure plays out, a powerful wave III-IV-V rally could follow, with long-term targets potentially above $9,000 by 2034.
This scenario remains valid as long as the corrective wave stays above the invalidation level. A bullish macro structure is still intact.
💬 Drop your thoughts or alternate counts in the comments!
🔁 Like & share for more ETH updates 🔥
