Long trade
Trade Overview: ETHUSDT – Long Position
Entry Price: 1789.52
Take Profit: 1826.93 (+2.09%)
Stop Loss: 1775.30 (–0.79%)
Risk-Reward Ratio (RR): 2.63
🕣 Entry Time: 8:30 PM (NY Time)
📅 Date: Saturday, 25th April 2025
🌍 Session: Tokyo PM
🧭 Bias: Buy-Side
The entry at 1789.52 came after a liquidity sweep below a short-term low, followed by a strong bullish engulfing candle on the 5-minute chart. This action indicated a classic smart money entry pattern, where sellers were trapped below the structure before a reversal.
5min TF
ETHUSDT.3S trade ideas

Ethereum Eyes Bullish Momentum After Resistance BreakoutUpon a confirmed breakout above the resistance line, Ethereum will be well-positioned for a potential bullish move.

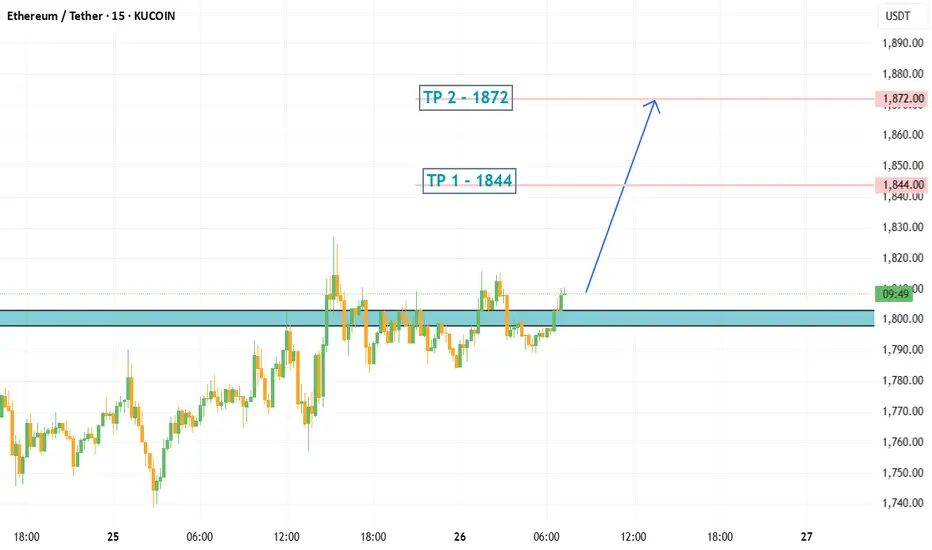
ETH/USDT LONG IDEAPosition opening range 1798~1803 USDT in batches
Total Position Recommendation Within 5% of total funds (or 1~2% of total account loss)
Stop Loss 1784 USDT, liquidate the position when triggered.
Take Profit First Target 1844, Second Target 1872
Cooling-off rule: 24 hours cooling-off after stop loss
Prohibition Prohibition of chasing high, prohibit the increase of positions, prohibit continuous trading
ETHUSDT is Breaking Out!! Is the Bull Run Finally Here?After a long period of consolidation within a descending channel, BINANCE:ETHUSDT is showing signs of life as it finally breaks out with bullish intent. This technical breakout could mark the beginning of a fresh bull run, reminiscent of past explosive moves we’ve seen from MARKETSCOM:ETHEREUM following major corrections. Historically, CRYPTOCAP:ETH has experienced drawdowns of over 90%, only to bounce back stronger and reach new all-time highs.
Currently, BITSTAMP:ETHUSD remains deep in the oversold zone, suggesting it’s still undervalued relative to its potential. As momentum begins to pick up, we could see targets being hit one by one, driven by renewed investor interest and favorable market conditions.
Moreover, the recent surge in COINBASE:ETHUSD ETF inflows adds fundamental weight to the technical setup. This institutional participation could act as a catalyst for a sustained rally, reinforcing the bullish bias.
That said, risk management is key. Always trade with a clear stop loss and position sizing to protect capital. The opportunity is brewing – the question is, are you ready to ride the wave?
BYBIT:ETHUSDT Currently trading at $1790
Buy level : Above $1750
Stop loss : Below $1490
Target : $4000
Max leverage 3x
Always keep stop loss
Follow Our Tradingview Account for More Technical Analysis Updates, | Like, Share and Comment Your thoughts

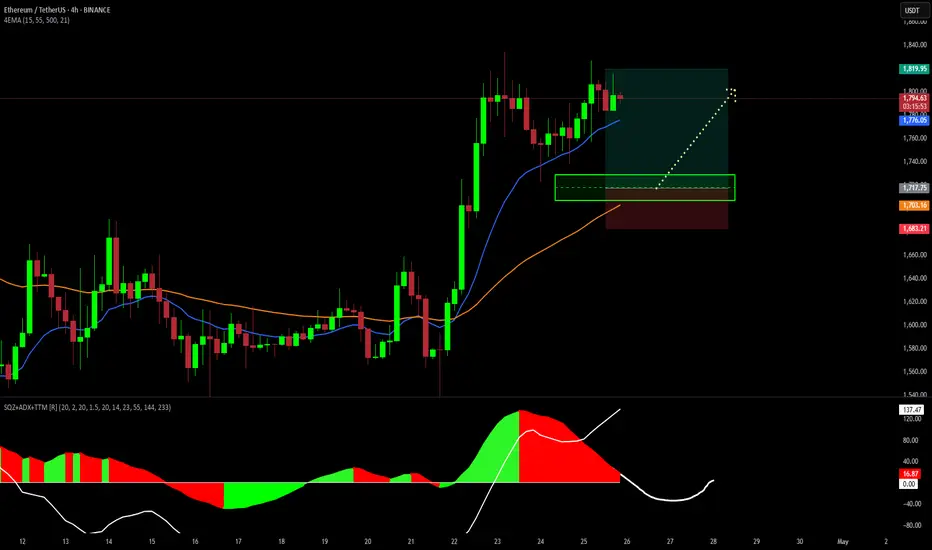
trading ETH/USD FUTURES, 4H.The price of ETH has consumed the bearish time of the SQZ indicator and has made a range above the two moving averages, which gives us a sign of strength in buyers, for the day a bullish pattern will possibly be in place and possibly the best buying zone will be between $1730 to $1700 dollars.
"ETH Breakout Watch: Holding Support for a Push Toward $1900+"ETH 4H chart par price apne key support (purple box) ke upar consolidate kar raha hai. Jab tak yeh support hold karta hai, $1900 - $1920 ka target active rahega.
Agar support toot jata hai to next major demand zone 1660-1680 ke aas paas hai. Tab tak structure bullish hai.
Trading plan simple hai:
✅ Support hold = Buy dips for $1900+
❌ Support breakdown = Wait for lower entries.
Chart clear path dikhata hai, risk manage karte raho! 🚀

$ETH Breakout – High Probability Move Ethereum has been in a downtrend since December 16, showing consistent lower levels. However, we’re now seeing a confirmed breakout above the trendline, which signals a strong potential reversal.
This breakout suggests a high-probability move to the upside, with price targeting the $4,000 level in the coming period.
Keep watching — the momentum is building.
Follow me for updates and analysis as the setup plays out. BYBIT:ETHUSDT.P

ETH Short is a must DOUBLE TOP on the charteven if not for long, but there is an a double top , so i expect a -7/10%
fib. retracement show it where has to go for a sane going up, as you can see my previwed analysis i have an 88% of profitable trade.
Good luck guys and trade safe, max leverage x10/15

Ethereum Breakout and Potential RetraceHey Traders, in today's trading session we are monitoring ETHUSDT for a buying opportunity around 1620 zone, Ethereum was trading in a downtrend and successfully managed to break it out. Currently is in a correction phase in which it is approaching the retrace area at 1620 support and resistance zone.
Trade safe, Joe.

Ethereum Breaks Out of Descending Channel–But Is It Sustainable?Hello guys.
Ethereum (ETH/USDT) has recently broken out of a well-defined descending channel on the 12H timeframe, suggesting a short-term shift in momentum. However, traders should remain cautious, as price action still faces significant resistance ahead.
🔍Technical points:
Descending Channel Structure: ETH has been trending downward since early February 2025, forming a clean descending channel with lower highs and lower lows.
Fake Breakout & Reversal: Earlier in April, the price dipped below the lower boundary of the channel in what now appears to be a fake breakdown, quickly recovering back inside.
Confirmed Breakout: Recently, ETH managed to close above the midline of the channel, breaking above short-term resistance near $1,640. This confirms a bullish breakout, at least in the short term.
Next Key Resistance Zone: The price is now targeting the $1,850–$2,050 area — a strong supply zone and previous structural level. If ETH fails to break through this zone, we may see another leg down inside the broader downtrend.
Short-Term Projection:
Bullish Path: A possible continuation toward the upper channel edge near $1,900–$2,000.
Bearish Rejection: If sellers defend that zone, ETH could resume its downward trend, potentially revisiting $1,500 or even lower.

ETH Underperformance relative to BTCWhile CRYPTOCAP:BTC is back at its February highs, CRYPTOCAP:ETH is still battling to break above its early April peak.
IF CRYPTOCAP:BTC keeps pushing, CRYPTOCAP:ETH will most likely follow on it's USDT pair.
IF CRYPTOCAP:BTC rejects and goes lower, CRYPTOCAP:ETH will most likely go to the local lows or create new lows.

Ethereum (ETH): Possible Zone of Rejection | Waiting For MSDWe are waiting for further market structure development in order to get the confirmation on upcoming downward movement, which we are looking for currently.
After the fill of bullish CME, we had a nice rejection and first signs of weakness, which might turn into a bigger rejection from our golden zone.
As soon as we see a proper MSB form below that zone, we are going to look for downward movement from there!
Swallow Academy

Ethereum vs SolanaIn 2025, the competition between Ethereum and Solana is no longer just a rivalry — it’s a pivotal chapter in blockchain evolution.
We are witnessing a clash of two philosophies:
Ethereum — maturity, security, and deep ecosystem
vs.
Solana — speed, efficiency, and adaptability.
📈 Price Resilience vs. Market Legacy
While Ethereum still holds the crown in market cap and institutional trust, Solana is rewriting the rules with superior transaction speed and cost-effectiveness.
The question is no longer "Who is better?"
It’s "Who is evolving faster?"
⚡ Key Drivers Shaping the Ethereum-Solana Rivalry
1️⃣ Scalability vs. Stability
Solana leads with up to 65,000 TPS, attracting high-frequency traders, NFT creators, and DeFi innovators.
Ethereum, relying on its Layer-2 solutions, tries to balance security with scalability.
2️⃣ Institutional Shifts
Funds like Galaxy Digital and Ark Invest are reallocating capital towards Solana, betting on efficiency and growth.
Ethereum, meanwhile, is waiting on ETF approvals to regain momentum.
3️⃣ Technological Innovation
Ethereum focuses on sharding and Layer-2 expansion.
Solana pushes aggressive ecosystem growth but pays the price with occasional network instability.
📊 Market Performance Snapshot — 2025
Ethereum: ▼ 56% YTD | ~$1,600
Solana: ▼ 40% YTD | ~$135
Solana’s DEX market share jumped to 39.6% in Q1, driven by meme coins and retail traders.
Ethereum’s dominance continues to erode under macro pressures and rising competition.
But don’t be fooled — Ethereum's foundation remains strong. Institutional adoption and infrastructure upgrades still offer potential for a rebound.
📉 ETH/BTC Looks Like a Meme
ETH/BTC:
SOL/BTC: Potential -50% in next 160 weeks ➡️
ETH/SOL:
⚡ Where Did the Liquidity Go?
The real question isn’t why ETH is dropping —
It’s why no one cares.
Layer 2 solutions — Arbitrum, Optimism, Base — have drained liquidity from Ethereum’s mainnet.
DeFi activity? → Migrated to L2
Users? → Choosing lower fees and speed
Ethereum L1? → A blockchain for whales and archives
No liquidity = No rally
No narrative = No attention
Funds are betting on Solana and L2, not Ethereum’s base layer.
🎯 When Could ETH Take Off?
Only if we see:
A strong “Liquidity Returns to L1” narrative (RWA could be a trigger)
Spot ETH ETFs launching with institutional accumulation
A new DeFi wave on L1 (unlikely with current gas fees)
Or simply — when the market decides to pump forgotten assets
For now, Ethereum is about patience.
Smart money is flowing into L2, Solana, and high-risk narratives.
🕒 But Time Will Tell...
Today, we debate ETH vs. SOL.
Tomorrow — the bull market ends, and we’ll be discussing entirely different narratives.
Are you SOL or ETH?
As always, stay one step ahead.
Best regards,
EXCAVO
______________________________
Disclosure: I am part of Trade Nation's Influencer program and receive a monthly fee for using their TradingView charts in my analysis.

ETH SCENARIOS - LONG/SHORTThat's what I'm looking at in the near future.
Just some ideas :)
Crypto Introduction
Ethereum is a decentralized platform that runs smart contracts: applications that run exactly as programmed without any possibility of downtime, censorship, fraud or third party interference.
Will book 50% of short at 1:1RR (if given) to make it risk free.
Raw R:R is over 8 so there is room to play with.

$ETH | #4h & #12h structure overview The upper boundaries of both the 4h and 12h ranges have been swept — a textbook HTF trigger for shorts within a broader bearish range context.
🔻 Breakdown:
— Both ranges remain bearish
— Sweep of H4/H12 highs confirmed → signaling possible continuation down
— Below lies FVGs and equal lows, prime targets for liquidity grabs
🧠 There’s clear downside potential into liquidation zones. Watching for M15/LTF confirmations to engage — otherwise waiting on a pullback for a safer entry.


trading ETH/USD TFUTURES, 1H.For the price of ETH, the time of 1H has passed and it has not fallen, but the price will have to go down to liquidate people and its bullish pattern will be created to try to find its previous maximum.

ETH/USDT ready to breakdown?? Inverted Cup & HandleETH/USDT
BINANCE:ETHUSDT.P
ETH is up 16.94% since our previous call. Currently, it has formed an inverted cup and handle pattern, which is a strong bearish setup.
If the price breaks below the white line (neckline), the pattern confirms and presents a short opportunity.
On confirmation, we expect a retest of the blue lines below, with a potential maximum target at the yellow line.
However, if the price breaks above the red line, the pattern becomes invalid.
Stay patient, avoid FOMO, and wait for clear confirmation/rejection before taking any position.

Ethereum iFVG / GP Long IdeaLong idea for Ethereun on the 1-4H, if we retrace back into the bull iFVG and tap that 1H GP, possible long entry at the level - Targeting external buyside liq for TP and to most recent sellside sweep as a stop loss

ETH - New ATH Approaching?Bitcoin has been full of surprises over the past few days, and this will most definitely affect Ethereum as well - which has not made a previous ATH when BTC did , a point we should not be forgetting.
This would also bring about the beginning of a new ALTSEASON.
But before we get too excited about all of the above - let's first see if Bitcoin can continue to CLOSE daily candles above the key support zone, as pointed out in the video.
_______________
BINANCE:ETHUSDT
BINANCE:BTCUSDT


Ethereum Uptrend Holds: Key Support Zones Before $1,800 BreakEthereum has shown solid strength after bouncing from recent lows, reclaiming higher ground and forming a clean intraday uptrend. With the $1,800 resistance now freshly tested, the market is entering a crucial decision zone. This post outlines the most actionable support levels and how price may react in the coming sessions.
📊 Technical Analysis:
Ethereum is currently maintaining a strong intraday uptrend, supported by a clean ascending trendline that began after a sharp bounce from the $1,550 region. The price recently tapped into $1,799 — a known resistance — and is now consolidating near $1,770.
We’ve identified three clear support zones based on structure and timeframes:
🔴 $1,703 – 1H Support (High Risk):
Early buyers may defend here, but it’s highly reactive and vulnerable to liquidity grabs.
🟠 $1,654 – 4H Daily Support (Medium Risk):
A more structurally sound area of demand. Offers a higher-probability bounce with cleaner market structure.
🟢 $1,590 – Last 1H Support (Low Risk):
The strongest recent base and the most attractive R:R long setup. If price revisits this zone, it’s likely where smart money reaccumulates.
As long as Ethereum holds above $1,703, this uptrend remains healthy. A break below both the trendline and the $1,654 support would shift the bias neutral-to-bearish short term.
✅ Conclusion:
Ethereum is trading inside a well-defined structure with supportive bullish momentum. If buyers step in at one of the mentioned support zones, we could see another push toward $1,799 and eventually $1,840+. Until a breakdown occurs below $1,654, the bias remains bullish on pullbacks.
Not financial advice. Like & follow for more Ethereum trade setups and structured analysis.

ETH-----Sell around 1770, target 1700 areaTechnical analysis of ETH contract on April 24: Today, the large-cycle daily level closed with a small positive line yesterday, the K-line pattern continued to rise, the price was at a high level, and the attached indicator was running in a golden cross. The general trend of rising is relatively obvious, but there are two points we should pay attention to. First: After the current four-hour chart is under pressure, the K-line pattern is continuous and negative, the price is below the moving average, and the fast and slow lines of the attached indicator have signs of sticking and dead cross; Second: Yesterday's high did not continue, so a retracement and decline within the day is a high probability event; the short-cycle hourly chart did not continue to break upward after yesterday's price continued to fluctuate at a high level. Today, it began to retreat under pressure. The current price is below the moving average, and the attached indicator is running in a dead cross, so let's take a look at the strength of the decline within the day.
Today's ETH short-term contract trading strategy: Sell directly at the current price of 1770 area, stop loss in the 1800 area, and target the 1700 area;
