Understanding Liquidity: Where Big Players Hunt Stops
Understanding Liquidity: Where Big Players Hunt Stops
Ever wondered why price suddenly spikes through your stop-loss and reverses moments later? That’s not a coincidence—it’s liquidity at play. This article will teach you how liquidity zones work, why stop hunts happen, and how to avoid getting

ETH - Is $3,000 next?Today marked a significant milestone for Ethereum as it successfully rolled out its much-anticipated Pectra upgrade. The update, which introduces a number of technical enhancements aimed at improving scalability, security, and developer experience, has already had a noticeable impact on market senti

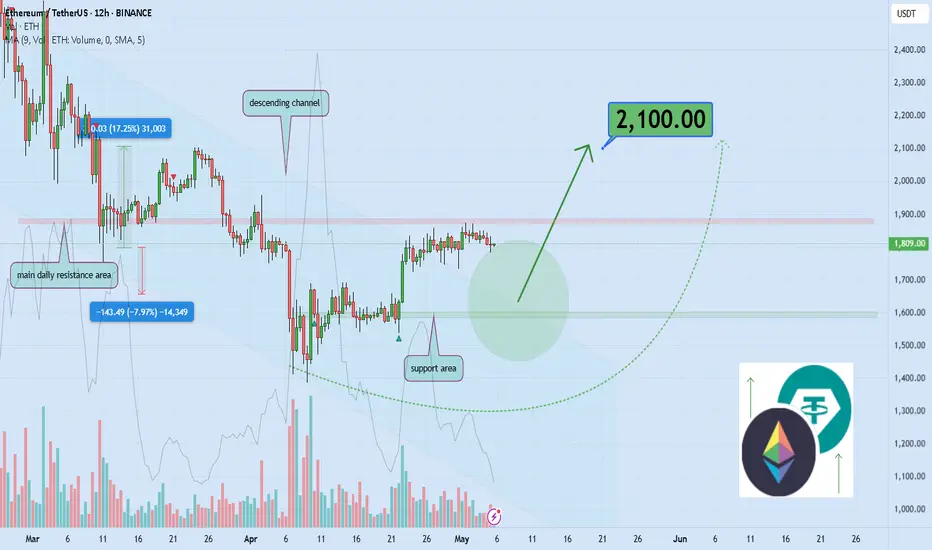
Can Ethereum Break $2,000 and Surge 16% to $2,100?Hello and greetings to all the crypto enthusiasts, ✌
All previous targets were nailed ✅! Now, let’s dive into a full analysis of the upcoming price potential for Ethereum 🔍📈.
Ethereum has recently broken out of its descending channel to the upside, indicating a potential for at least a 16% price
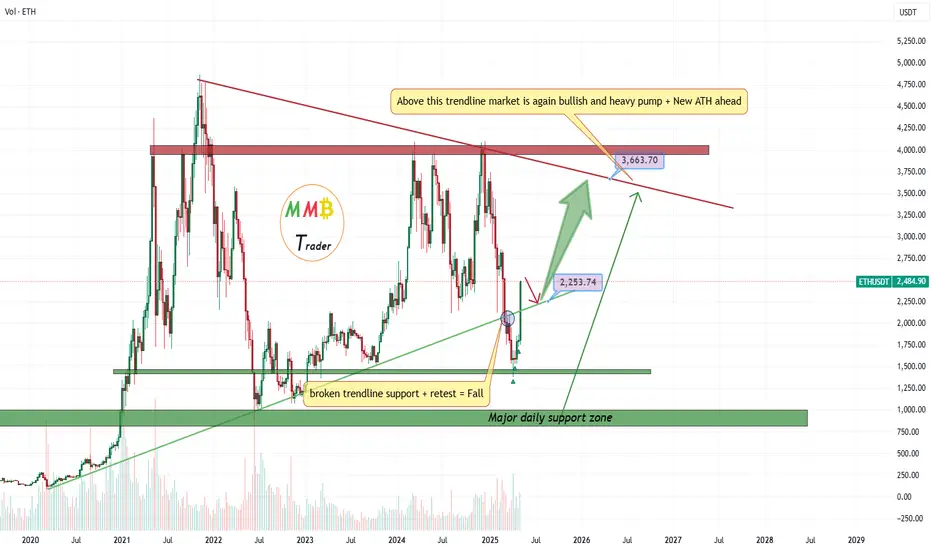
ETHUSDT above green trendline wait for retest and then 3500$As we can see our first target hit which was 2300$ and the pump started from our daily support of 1400$ now we can expect range here for a while or short-term correction to retest the green trendline and this trendline would be once again major support and will pump price to the targets like 3000$.
#ETHUSDT: Price to Touch All Time High $4500 By End Of YearETHUSDT has hit lowest point and we might see a price reversal towards $4500, which would be an all-time high. There are three potential targets for the price to reach.
Good luck and trade safely!
Best regards,
Team Setupsfx_
We’d love for you to support and encourage us!
- Like our ideas
- Sh

ETH => Shift In Momentum Almost Done!Hello TradingView Family / Fellow Traders. This is Richard, also known as theSignalyst.
📉 Since breaking below its last major low in December 2024, Ethereum (ETH) has been stuck in a bearish trend.
But don’t lose hope, bulls! 🐂
⚠️It’s evident from the last correction phase, marked in blue, that i

ETHUSDT - Will likely have 5 Digits by the end of 2025Ethereum has dropped 65% since December, hitting its bottom in April —
that’s 5 full months in a bear market with a massive drawdown, especially for the second-largest crypto by market cap.
Today, it made a strong bounce, rallying over 50% from the grey support zone,
confirming that the bottom was

Ethereum's Uptrend Confirmed: Bulls Take ControlEthereum's Uptrend Confirmed: Bulls Take Control
After the FOMC meeting yesterday, ETH started a strong upward move, gaining nearly 8%.
The chances of further growth are increasing.
ETH has already broken out of a solid bullish pattern, signaling more potential upside.
The setup looks promisi

Ethereum Bear Market Over! $10,000 Before 2026 Confirmed!People were badmouthing Ethereum but look what is happening, more than 20% growth in a single day. Awesome right? But this is only the start, the last high will be reached and conquered easily, that I know for certain for sure it is true just watch.
In a previous analysis I mentioned that ETHUSDT w

Ethereum (ETH/USDT) – Bullish Momentum Building Toward targetHello guys...
Ethereum has broken out of its long-term descending channel and is currently trading inside a smaller ascending channel, showing strong bullish momentum. After a "fake breakout" below major support around $1,400, ETH quickly reclaimed higher levels, suggesting a bear trap.
Currently,

See all ideas
Summarizing what the indicators are suggesting.
Oscillators
Neutral
SellBuy
Strong sellStrong buy
Strong sellSellNeutralBuyStrong buy
Oscillators
Neutral
SellBuy
Strong sellStrong buy
Strong sellSellNeutralBuyStrong buy
Summary
Neutral
SellBuy
Strong sellStrong buy
Strong sellSellNeutralBuyStrong buy
Summary
Neutral
SellBuy
Strong sellStrong buy
Strong sellSellNeutralBuyStrong buy
Summary
Neutral
SellBuy
Strong sellStrong buy
Strong sellSellNeutralBuyStrong buy
Moving Averages
Neutral
SellBuy
Strong sellStrong buy
Strong sellSellNeutralBuyStrong buy
Moving Averages
Neutral
SellBuy
Strong sellStrong buy
Strong sellSellNeutralBuyStrong buy
Displays a symbol's price movements over previous years to identify recurring trends.