#ETH #ETHUSD #ETHUSDT #ETHEREUM #Wyckoff #Analysis #Eddy#ETH #ETHUSD #ETHUSDT #ETHEREUM #Wyckoff #Analysis #Eddy
This analysis is based on the analytical style of the Wyckoff Distribution Structure of Schematic #1.
I have outlined for you the important parts of the Wyckoff style on the one-hour timeframe.
Currently, we are in Phase C of the Wyckoff Distribution Structure.
We have to wait for the completion of this phase and the start of Phase D of the Wyckoff Distribution Structure.
When will this structure be fully confirmed? When the Ethereum price falls to the 1750 support and gathers the final spring when this support is broken for the fall, we will enter a short position by getting the necessary confirmations based on our style and strategy.
💬 Note: The best entry point for short positions will be the 1720_1750 support break. if the Ethereum price UTAD and test formed, high-risk traders who are willing to trade in the opposite direction can enter a short position by getting confirmation in the time frames below 15 minutes.
Where will the targets be? The first target is 1500 and the second target can be 1000 dollars. Maybe next targets is : 800_500 dollars.
When can you safely close the position and enter a reverse trade, that is, long or buy? When a Wyckoff accumulation structure is formed at one of the targets.
The responsibility for the trade is yours and I have no responsibility for your failure to comply with the risk and capital management.
Good luck and be profitable.
I also invite you to review and view my latest analysis on Bitcoin & TOTAL3 on my page.
ETHUSDT.P trade ideas

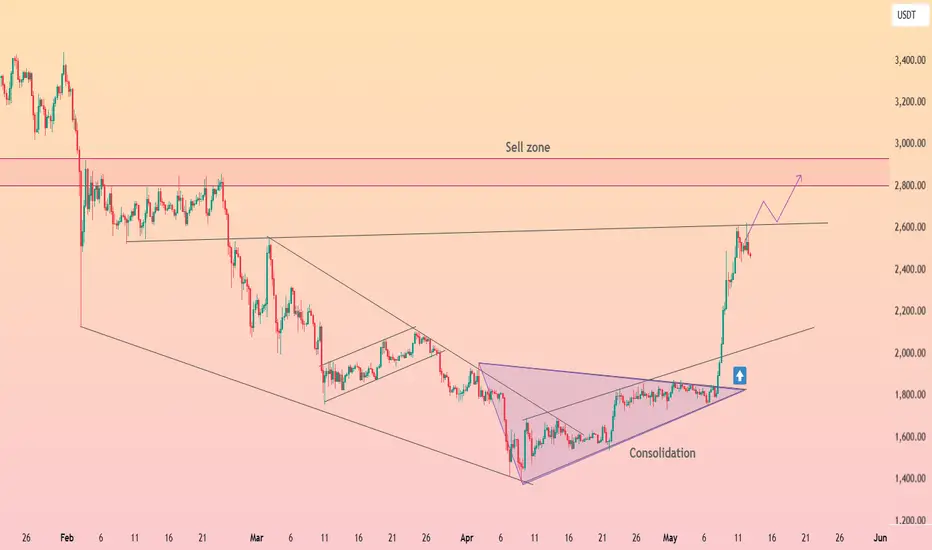
HolderStat┆ETHUSD retest $2500 After months locked inside a broad falling wedge, ETH erupted in early May, blasting through both the wedge roof and an internal consolidation triangle. The vertical thrust carried price from 1.8 k straight to 2.6 k, where a key horizontal lid now tests bulls’ resolve. Short‑term dips back toward the broken trendline or 2.2 k support would look constructive while momentum targets the well‑flagged 2.8‑3 k sell zone overhead. 🎯
Is ETH - Next 3,000?ETHUSDT – Market Insight & Price Structure
Ethereum has been shaping a falling wedge pattern over the past 2 to 3 months—a structure that typically suggests a bullish reversal. Recently, price action confirmed a breakout above the key resistance zone between $2034 and $2040, along with a clean break of the upper trendline of the wedge. These movements point to a strong bullish signal, suggesting potential continuation to the upside.
Currently, Ethereum is approaching a significant resistance level around $2860. If price reaches this zone, we’ll be watching closely for confirmed reversal signals to consider a potential short/sell setup.
On the other hand, the primary bullish trend trade remains valid near the $2160–$2150 support range. A long position will only be considered upon confirmation, such as a bullish engulfing candlestick pattern, market structure shift (MSS), or other trusted technical signals.
Disclaimer: This is not financial advice. Always do your own research (DYOR).

ETH/USDT – Bullish Momentum into Major ResistanceEthereum continues to show bullish strength, trading above the 200-day moving average. Price action is now approaching a high-confluence resistance zone around $2,800, which could trigger the next major move.
Key Highlights:
Support: 200-day MA continues to hold with 3 daily closes above
Resistance: $2,800 zone = 0.618 Fib + Weekly SR + Value Area High
Structure: Higher highs and higher lows intact on the daily timeframe
Technical Breakdown:
ETH is currently holding strong above the 200MA, confirming bullish structure with a series of higher lows. Immediate resistance lies at the $2,800 zone, which aligns with several key levels, making it a critical decision point. A breakout above this area with strong volume could push ETH toward new local highs.
Conversely, failure to break $2,800 could result in a rotation back toward $2,000, where the last major support and psychological level sits. This would offer a strong “buy-the-dip” opportunity, especially if the trend remains intact.
Bias:
Bullish above 200MA — watching for reaction at $2,800 to confirm continuation or retracement.

ETH/USDT – Waiting for Retracement After Strong Impulse MoveEthereum has shown a strong impulsive rally from the $1,750 zone, breaking through key resistance levels. Now, price is approaching a major supply zone and resistance between $2,450–$2,600, suggesting a potential pullback.
🔹 Technical Highlights:
The current move is a clean vertical impulse leg with little consolidation — a retracement is likely before continuation.
Key Fibonacci retracement levels are drawn from the recent swing low to high:
0.382 Fib: $2,218
0.5 Fib: $2,125 (Buy Zone)
0.618 Fib: $2,067
A support block and potential bullish reaction zone is aligned with the 0.5 Fib level, marked as a “Buy Here” zone.
RSI is deeply overbought (~86), increasing the likelihood of a temporary correction.
🟢 Trade Plan Summary:
Scenario : Price rejects from $2,450–$2,600 resistance, pulls back to the 0.5–0.618 Fib zone, and then resumes bullish momentum.
Buy Zone: Around $2,125, with confluence from Fib, structure, and trendline support.
Buy Zone: Around $2,125, with confluence from Fib 0.5, structure, and support.
Target: New highs above $2,600, possibly heading toward $3,000+ in the medium term.
📌 Outlook: Bullish on confirmation of pullback support — waiting for healthy retracement for re-entry.

$Ethereum Weekly Outlook Ethereum Weekly Outlook 🔥
CRYPTOCAP:ETH just bounced hard from the macro trendline key demand zone
- Now reclaiming the $2,350 level is a strong bullish signal.
- The next major resistance sits at $4,800.
- The path looks bullish if we hold this zone.
Accumulate smart.

ETHUSDT: Progressing Well 01/05/2025 UPDATEThe ETHUSDT price is moving well, currently trading above the 1700$ area. We anticipate a continuous rise, potentially reaching $2400 first and then $3000. Our swing target remains at $4500. The current price behaviour and momentum suggest an extremely bullish outlook.
Good luck and trade safely!
Thank you for your unwavering support! 😊
If you’d like to contribute, here are a few ways you can help us:
- Like our ideas
- Comment on our ideas
- Share our ideas
Team Setupsfx_
❤️🚀

eth/usdt.30mEthereum analysis on the half-hour timeframe
The analysis relies on trend analysis and support and resistance.
We have three scenarios with conditions.

Ethereum 6X Lev. Full PREMIUM Trade-Numbers —2nd Entry—PP: 1806%This is a second entry for a long-term leveraged chart setup for ETHUSDT (Ether).
This is truly the last chance to get Ethereum at low prices before a major bullish impulse, the biggest one in a long time.
The chart structure is perfect. The low conditions look very similar to June 2022, very similar.
We have long-term higher lows blah blah blah... By now, you already know all these things as I read this chart a million times.
I don't have much to say other than remain calm, whatever happens. Sleep easy because Crypto is going up. It is as simple as that. It will grow, soon.
Full trade-numbers below:
_____
LONG ETHUSDT
Leverage: 6X
Entry levels:
1) $1,900
2) $1,825
3) $1,630
Targets:
1) $2,125
2) $2,405
3) $3,347
4) $4,017
5) $4,871
6) $6,000
7) $7,337
Stop-loss:
Close weekly below $1,600
Potential profits: 1806%
Capital allocation: 3%
_____
I would like to thank you again for reading. Your support is appreciated.
I know it is a lot of content but this is meant for many different people all across the world.
If you like what you see make sure to follow.
If you want to see more, leave a comment and boost to show your support.
This is the big one.
Namaste.

ETH Overextended: Eyeing a Retracement from Key Liquidity ZoneTechnical Analysis: ETH/USDT Daily/4H and 30m Chart 🚨
Ethereum (ETH) has experienced a powerful rally, surging from the $1,900 region to above $2,500 in just a few sessions. This explosive move has pushed price into a previous area of significant resistance, where a large liquidity pool is likely sitting. The current daily candle structure shows signs of hesitation, with smaller bodies and wicks indicating potential exhaustion at these highs.
Given the overextended nature of this move 📈 and the fact that ETH is now trading at a premium relative to its recent range, a retracement back toward equilibrium is probable. If price action breaks below the current range low (the most recent swing low on the daily), this could confirm a distribution phase 🏦 and open up a short opportunity.
I'm watching for a clear break and close below the range low to trigger a potential short setup. My expectation is for price to revisit the mid-range or even the origin of the recent rally, where demand may step in again. Until then, patience is key—let the market show its hand before entering.
Key Points:
ETH is overextended and trading into previous highs with heavy liquidity 💧
Signs of exhaustion are emerging at the top of the move
A break below the current range low could confirm distribution and offer a short setup 🔻
Targeting a retracement toward equilibrium, possibly the $2,000–$2,200 zone 🚨

ETH is finally showing some sign of lifeETH after being bearish for so long is finally seen some inflow of money towards it, meaning ALT season is starting to show little glimpses here and there.
ETH Long term looks really good, if everything continues as smooth as it is currently then I will expect ETH to do great, the current targets I have going up 2.4k if the price hold those levels then 3.4k will be a walk to the park.
if it goes down to the 1900 even the 1700 area, I will just buy more.
Always put stop loses the current economy is showing no mercy, neither should we.

Ethereum Approaching Key Resistance – Breakout or Rejection?Ethereum ( CRYPTOCAP:ETH ) has been on a strong upward trend since bouncing from the $1500 zone, and it’s currently trading around $2372. All eyes are now on the next major resistance area between $2600 and $2900.
So what’s next—breakout or pullback?
If ETH can push through this resistance with strong momentum and volume, we could see a continuation toward $3000 and beyond.
A rejection from this level could lead to a dip back toward the $1900–$1700 support range.
My Take: The trend is bullish, but this resistance zone is a key test. A strong close above $2900 would confirm a breakout. Until then, caution and close observation are crucial.
What do you think? Will ETH break through or bounce down from here?
Share your thoughts below!
Kindly support this idea with a LIKE👍 if you find it useful🥳
Happy Trading💰🥳🤗

BUY ETHbuy eth to the next liquidity area that shows good volume aand if closes below the support level sell it also to the next support liquidity area

ETHUSD NEXT MOVE?etherium currently trading at 1800 around and we are looking for buy here and target are 2042

Ethereum Wave Analysis – 8 May 2025- Ethereum broke the resistance zone
- Likely to rise to resistance level 2100,00
Ethereum cryptocurrency recently broke the resistance area between the major resistance level 1935,00 (former monthly top from April) and the 50% Fibonacci correction of the downward impulse from March.
The breakout of this resistance zone accelerated the active short-term ABC correction ii from the start of April.
Given the strongly bullish sentiment seen across the cryptocurrency markets, Ethereum cryptocurrency can be expected to rise to the next resistance level 2100,00 (top of the previous correction iv).

ETH/USDT – Weekly Chart AnalysisETH/USDT Unique Technical Structure: Large Accumulation + Recovery Setup
This chart shows Ethereum’s price action over the past few years, highlighting key support and resistance areas. A strong visual signal (blue arrow) indicates bullish potential.
Chart Pattern Implications:
The pattern on this chart is not a classical shape (e.g., cup and handle), but it does show a Wyckoff-style accumulation phase followed by a failed breakout and reaccumulation:
Strong base formed between $1,000-$1,400
A series of lower highs and a range-bound structure after the 2022 peak
The bullish projection illustrated by the arrows shows a potential recovery towards the ATH again
This setup suggests that Ethereum is at a critical juncture – either:
It retests current support and begins a new uptrend.
Or it risks another test of the $1,400-$1,050 range before a breakout.
Risk-Reward: Current levels ($1,796) offer attractive long-term entries if you’re bullish.
Caution Zone: If ETH breaks below $1,400 with volume, $1,050 becomes the next key defense.
If you found this analysis helpful, hit the Like button and share your thoughts or questions in the comments below. Your feedback matters!
Thanks for your support!
DYOR. NFA

ETHUSDT | Long Bias | Reversal Building on Weekly | (May 12, 20ETHUSDT | Long Bias | Reversal Building on Weekly + 4H Confluence | (May 12, 2025)
1️⃣ Short Insight Summary:
Ethereum has been climbing out of a long downtrend, with the weekly chart showing a strong shift from downside pressure to upside momentum. We're now watching a key area for re-entry and potential compounding long positions.
2️⃣ Trade Parameters:
Bias: Long
Entry Zone: $2,232–$2,224
Stop Loss: Below $1,800 (combined risk zone)
TP1: $2,500
TP2: $3,000
Final TP (Optional): $5,000+ if momentum continues
Partial Exits: Recommended at each take-profit level, especially around round numbers and prior highs
3️⃣ Key Notes:
✅ Weekly chart structure shows a macro reversal from $1.5K toward the EUROTLX:4K region—potential for large moves.
✅ On the 4H timeframe, the $2,232 area is showing confluence as a strong re-entry zone.
✅ Already taken two partial profits from earlier longs; now looking to re-enter or compound on pullback.
✅ This area could be a "crazy long" zone if confirmed by price action—watch for bullish reactions or strong volume spikes.
❌ Be cautious and wait for confirmation—don’t blindly long into weakness.
4️⃣ Optional Follow-up Note:
Will continue monitoring this zone and provide updates if the structure strengthens or invalidates.
Please LIKE 👍, FOLLOW ✅, SHARE 🙌 and COMMENT ✍ if you enjoy this idea! Also share your ideas and charts in the comments section below! This is best way to keep it relevant, support us, keep the content here free and allow the idea to reach as many people as possible.
Disclaimer: This is not financial advice. Always conduct your own research. This content may include enhancements made using AI.

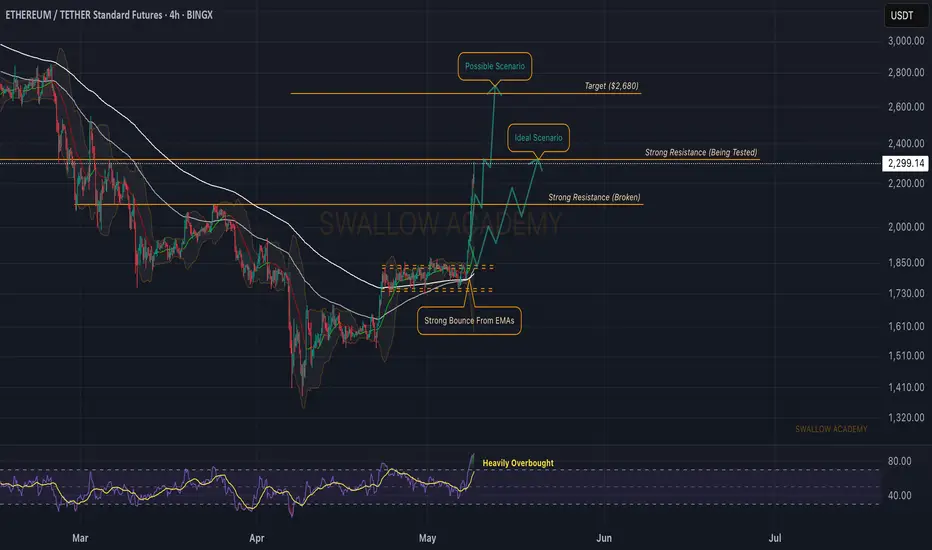
Ethereum (ETH): Targeting $2,700 | Strong Bull MovementEthereum is finally shining after such a hard time we had on it. The price is breaking new highs and is not showing any remorse to sellers.
Despite us looking for upward movement, we have to be careful of any quick downward correctional movement or candles so if you hold a long position on ETH, set your last targets to $2,700, while if you are looking to enter, do not enter with big leverage (due to big liquidity hunting that might happen).
RSI is overbought so that's what we will be looking at as well
Swallow Academy
Is Now the Time for Ethereum to Be Re-evaluated?We are the SeoVereign Trading Team.
With sharp insight and precise analysis, we regularly share trading ideas on Bitcoin and other major assets—always guided by structure, sentiment, and momentum.
🔔 Follow us to never miss a market update.
🔥 As Bitcoin reclaims the 100K narrative, Ethereum is waking up.
In the wake of Bitcoin’s bullish momentum, Ethereum is flashing strong reversal signals.
After a prolonged period of undervaluation and market hesitation, it’s finally time for ETH to be re-evaluated for what it’s truly worth.
At SeoVereign, we’re positioning strategically long on Ethereum, aligning with both technical setups and market sentiment.
This isn't just a short-term bounce—it's potentially the start of a mid-term trend reversal.
🎯 Target 1: 2,566 — Breaking near-term resistance
🎯 Target 2: 2,598 — Key mid-structure objective
📊 Right now, the market is split between the hesitant and the proactive.
We're choosing to be ahead of the curve.
🚀 The SeoVereign Team is here to catch this wave—
Now is the time to ride the ETH long setup.

Short term bull for Eth Not a financial advice and just for learning purposes
If you can please review and let me know what you think!

ethusd 1400 EOY then bull run to ATH 4500Huge Triangle pattern of ethereum.
If 1400 till end of year will hold could be as simple as in 2023 the start of bull run in 2026 to new ATH at 4500

ETHEREUM 2025.05.01***Follow SEOVEREIGN to receive alerts.
**Boosts help SEOVEREIGN analyze more assets.
**Our team regularly publishes analysis reports on the cryptocurrency market.
Asset Overview – Ethereum (ETH)
🎯 Target 1: 1,820
🎯 Target 2: 1,787
Ethereum has currently confirmed the 1.13 Bat Pattern,
indicating a potential short-term downside move.
This may offer an opportunity to consider a short position for futures traders.
Of course, from a long-term perspective, we continue to expect upward momentum for Ethereum.
However, a short-term technical correction is possible, so please take this into account in your trading decisions.
This also serves as a good example for those interested in trading strategies based on harmonic patterns.

Ethereum Breakout After 64% Crash | Big Moves Ahead!After capturing a massive 60% fall in ETH, we are now spotting the first clear breakout sign on the daily chart!
ETH is currently trading around $1,794 and looks ready to rally towards the $2,100–$2,150 zone soon With a SL of $1,600 . 📈
Big institutional players have already started accumulating BTC and ETH heavily — the smart money is moving, and the impact will be visible very soon!
Stay tuned — the next few weeks could be a game changer for crypto!
🔹 #ETHUSDT #Ethereum #CryptoBreakout #iSparkIndicator #CryptoTrading #Bitcoin #CryptoAnalysis #TradingView
