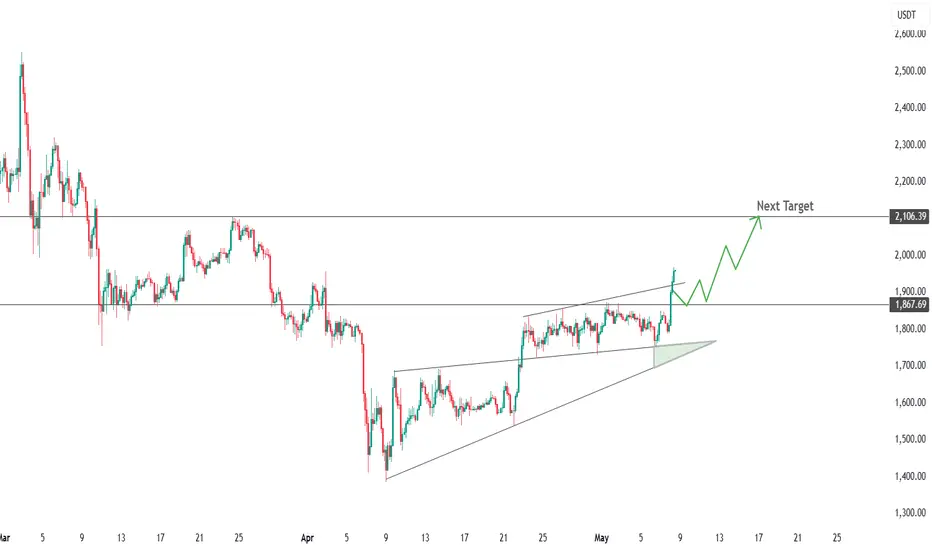
Broke the resistance levelCRYPTOCAP:ETH - wedge broken, target 2,100 USDT
After a three-week contraction, the price broke above the upper boundary of the ascending wedge and the 1,870 USDT horizontal, confirming a change of momentum in favor of the bulls.
📌 Levels
- S1 1 870 USDT - top of the wedge, retest zone
- S2 1,800-1,820 USDT - base of the formation
- R1 1 900-1 920 USDT - local obstacle near trend lines
- R2 2,106 USDT - calculated wedge height target and March supply area
📈 Scenario
Holding S1 opens the way to R1; a consolidation above 1,920 activates the march to 2,100 USDT. A run-up to 2,200 is not ruled out with strong volume.
⚠️ Risks
A failure ⇩ 1,870 would indicate a false breakout; a move below 1,800 would bring the price back to the wedge and increase the chance of a test of 1,740.
ETHUSDT.P trade ideas
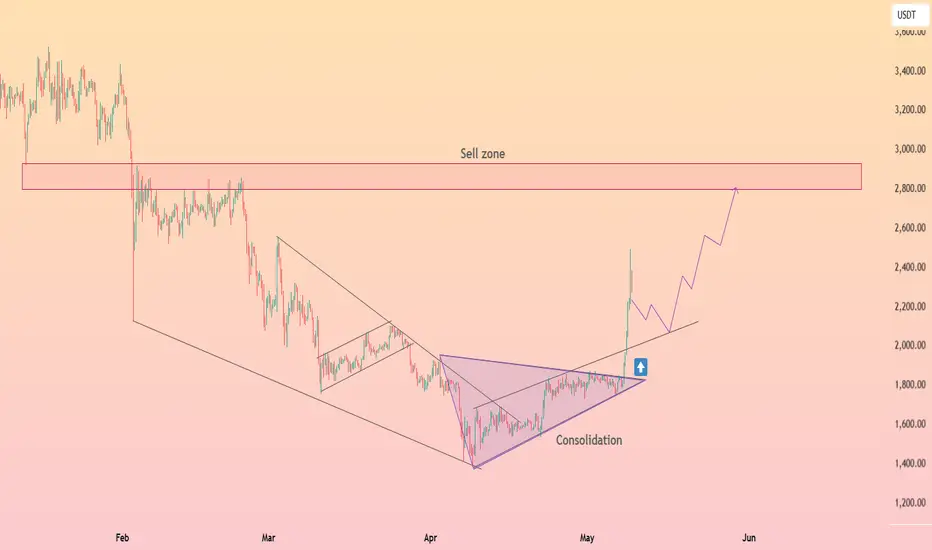
HolderStat┆ETHUSD breakout toward key resistanceAfter weeks of consolidation inside a symmetrical triangle, ETH has confirmed a bullish breakout with strong momentum. Price is now aiming for the $2800–$3000 sell zone, a key level from previous distribution. The breakout suggests increased buying pressure and a potential mid-term rally continuation.
💡 If ETH holds above the $1800 breakout zone, we could see a gradual climb toward $2800 in the coming weeks.

Ethereum (ETH): Reached Sideways Channel's Resistance LineEthereum is back at the resistance zone where sellers failed to show a proper breakdown, which would have triggered our sell entry yesterday.
Now that we've reached the resistance zone, this is the area we are looking for rejection now, which would give us similar movement to what we had each time we reached the resistance zone. As always, wait for MSB on smaller timeframes and once we see it short position can be taken!
Swallow Academy

Ethereum Future: Limited Upside Ahead?Ethereum price dropped roughly 25% since April 2 due to an overall market crash following Trump’s tariffs implementation.
Compared to the almost 40% drop back in February after the first tariff announcement, this time the correction wasn’t as harsh or brutal.
So what can we expect next from Ethereum in the coming weeks?
The main hope for ETH price remains the upcoming Pectra upgrade.
Historically, major Ethereum upgrades have acted as bullish catalysts — for example, ETH roughly doubled in price ahead of both the Merge and the Shanghai upgrade.
If history rhymes, we could see a similar pre-upgrade pump this time too.
However, even if that rally materializes, I expect it to be limited to the $3,000–$3,400 range. The market lacks the kind of momentum or macro tailwinds needed to push ETH beyond 4k in this cycle — unless there’s a major shift in sentiment.
Overall, I remain cautious. The broader crypto market seems to be rolling over, and Ethereum hasn't even reclaimed its ATH.
With the next bear cycle approaching, long-term bullish targets might need to be revised — at least for now.
Short-term bounce possible thanks to Pectra hype, but don’t expect miracles. ETH likely capped below 3.4k unless something big changes.

Ethereum Rebounds from Key Confluence Zone$ETH/USDT Weekly Chart Analysis
Ethereum is holding a major long-term uptrend as the price bounces off the ascending trendline support. This level also aligns with a strong historical resistance-turned-support zone, adding more confluence to the current bounce.
As long as ETH stays above this structure, it suggests a potential macro bullish continuation, with eyes on the upper resistance line near $3,200–$3,500.
A strong defense at this zone reinforces long-term bullish sentiment.


Eth Whales Poised to Sell at $2,700: What It Means for Market?The potential for Ethereum (Shark)whales to sell at $2,700 underscores the importance of tracking large holders' behavior in the crypto market.
While such moves can create short-term volatility, they are also a natural part of market cycles. By staying informed and adopting a strategic approach, we can navigate these fluctuations effectively and make decisions aligned with their long-term goals using Candles Patterns .

ETH vs USDT Crypto Heist - Bullish Breakout Plan!🔥 Thief Trading Style: ETH/USD Bullish Heist Plan 🔥
Dear Money Makers & Market Robbers 🤑,
Ready to pull off a master heist in the Ethereum vs. U.S. Dollar (ETH/USD) crypto market? 📈 Using Thief Trading Style’s technical and fundamental analysis, here’s our strategic plan to ride the bullish wave and escape near the dangerous MA zone. Follow the chart, stick to the plan, and let’s secure those profits! 💪🎯
---
📊 Trade Setup: The Heist Blueprint
- Market: ETH/USD (Crypto) 🌐
- Bias: Bullish Breakout 🌟
- Timeframe: 1D (Swing Trade) ⏰
Entry 📈:
- Breakout Entry: Wait for a confirmed breakout above the Moving Average (MA) at 2500. Set Buy Stop orders just above 2500 to catch the momentum. 🚀
- Pullback Entry: For safer entries, place Buy Limit orders at the most recent 15M/30M swing low (e.g., 2450-2475) for pullback opportunities. 📍
- Pro Tip: Set an alert on TradingView for the 2500 breakout to never miss the move! 🔔
Stop Loss 🛑:
- Breakout Traders: Place your Stop Loss below the recent 1D swing low at 2000 after the breakout confirms. This protects against false moves. ⚠️
- Pullback Traders: Adjust Stop Loss based on your risk tolerance (e.g., 1-2% of account per trade). Use lot size and multiple orders wisely. 📏
- Risk Warning: This is a high-risk heist! Manage your position size and stick to your risk plan. 🔥
Target 🎯:
- Aim for 2900 (near the dangerous MA zone, a risky overbought level with potential consolidation or reversal). 🏴☠️
- Escape Plan: Consider taking profits early if bearish signals (e.g., reversal patterns, high volume) appear near 2900. 💸
Scalpers 👀:
- Focus on Long-side scalps using tight trailing stops. Join swing traders for the full heist or scalp quick moves with high leverage (if your capital allows). 💰
---
📡 Why This Heist Could Work
The ETH/USD market is currently neutral with bullish potential, driven by:
- Technical Signals: Breakout above the 2500 MA signals strong bullish momentum, supported by higher lows on the 1D chart. 📊
- Fundamentals: Positive sentiment in crypto markets, fueled by macroeconomic trends and institutional interest (check COT reports for positioning). 📰
- Seasonal Factors: Crypto often sees Q2 bullish runs, aligning with our setup. 📅
- Intermarket Analysis: Bitcoin’s strength and USD weakness could propel ETH higher. 🌎
For deeper insights, review COT Reports, Geopolitical News, and Sentiment Analysis on platforms like Bloomberg or Cointelegraph. 🔗
---
⚠️ Risk Management: Protect Your Loot
- News Alerts: Avoid new trades during high-impact news (e.g., FOMC, CPI releases) to dodge volatility spikes. 🗞️
- Trailing Stops: Use trailing Stop Loss to lock in profits as price approaches 2900. 🔒
- Position Sizing: Never risk more than 1-2% of your account per trade. Stay disciplined! 🚨
---
💥 Boost the Heist! 💥
Support our Thief Trading Style by liking, commenting, and following for more high-octane trade plans! 🚀 Every boost strengthens our robbery crew, helping us conquer the markets together. 🤝 Let’s make money with ease and style! 🏆🎉

possible target estimationPrice at the moment looks more bullish.
we should consider we are moving into downtrend channel in a bigger time charts yet.
so if the price could hold the base area at my chart has big chance to break out that channel.
at this scenario the closest target is around 2100$ for short term.
if price could manage to break up the channel we could consider our main trend changed to
bull trend.
Enjoy the market

Ethereum ETH Is Gaining Strength Agains BitcoinHello, Skyrexians!
BINANCE:ETHUSDT was a huge underdog last 4 month on the bearish phase, but recently it started to gain power, on the recent dump it has not showed correction.
On the daily chart we can see that price has printed 5 waves Elliott cycle. Wave 3 corresponds to the minimum Awesome oscillator. After that wave 5 has finished this cycle with divergence. The conservative bounce target is $3000 at 0.61 Fibonacci level, but we have one problem here. AO did not crossed zero line at wave 4, so we can be in wave 4 only now, in this case another one lower low will happen. We need to count sub waves every day. Wait for our updates.
Best regards,
Ivan Skyrexio
___________________________________________________________
Please, boost this article and subscribe our page if you like analysis!

Ethereum price increaseThe influx of liquidity and increased demand for Ethereum has caused the price of Ethereum to increase in various technical analysis models. In previous analyses, I had identified the Ethereum price resistance area, according to which the price increased at the specified time, and for a short-term weekly or daily target, we can consider a price of $2,000 per Ethereum unit, but it should be taken into account that this increase is likely to ultimately cause a new price record for this currency in the crypto market.
Sasha Charkhchian

$ETH Surprised $2.4K Price Mega Big pumping & touch to $3K ✨ CRYPTOCAP:ETH Surprised $2.4K Price Mega Big pumping & Trying to $3K Milestone again.
💫 From Breaking News:
• Ethereum Foundation Invests $32.65M in Ecosystem Growth
• Ethereum To Expand Network Capacity with Gas Limit Increase
Ethereum blockchain is preparing for a major upgrade that could make its network faster, cheaper, and more efficient. Developers have proposed raising the gas limit by 66% in a new development, from 36 million to 60 million units.
This change aims to improve the number of transactions the network can handle per block. This is to help users and developers enjoy smoother and more affordable activity on the blockchain.
Developer Says Testing Success Leads to Mainnet Rollout
Ethereum core developer Parithosh Jayanthi recently confirmed that the upgrade had passed early tests and is now ready for broader use. The new gas limit was successfully tested on the Sepolia and Holesky testnets. According to Jayanthi, the final rollout to Ethereum’s mainnet will begin shortly.
This is the second time Ethereum has raised its gas limit in 2025. The first increase happened in February, when the limit increased from 30 million to 36 million. These changes came after there hadn’t been any gas increase on the network since 2021.
#Write2Earn #ETH #BinanceSquareFamily #MarketRebound #SUBROOFFICIAL
Disclaimer: This article is for informational purposes only and does not constitute financial advice. Always conduct your own research before making any investment decisions. Digital asset prices are subject to high market risk and price volatility. The value of your investment may go down or up, and you may not get back the amount invested.


Short trade 🟥 Sellside Trade Log
📉 Pair: ETH/USD
🏷️ Type: Intraday | NY Session PM
🧠 Setup: Breakout (Downside)
📅 Date: Tuesday, 13th May 2025
🕕 Time: 6:20 PM
🔹 Entry Price: 2,702.20
🔹 Profit Target: 2,654.27 (-1.77%)
🔹 Stop Loss: 2,710.31 (+0.30%)
🔹 Risk-Reward Ratio: 5.91
🔍 Reasoning:
Sellside breakout trade assumes a clear momentum-driven directional bias during the NY PM session. The move was reinforced by forming a Fair Value Gap (FVG) on the lower timeframe (5min), indicating institutional selling pressure and inefficiency. Price broke below a key structural level and continued into the FVG, confirming bearish intent. Entry was taken with confluence from the gap, targeting the next liquidity pool while maintaining tight stop control above the invalidation zone.
5min TF entry

Ethereum (ETH): Time For Ethereum To Shine | Buyers DominatingBuyers are heavily dominating Ethereum right now, pushing us into the second stage of the upcoming bull market. As many of you know, the money flow usually starts with BTC, then moves into ETH, followed by large caps, mid caps, and finally low caps.
At this point, we’re clearly in stage two—Ethereum still has room to grow. First target already hit, two more to go!
Swallow Academy

Buy Trade Strategy for ETH: Powering the Future of Web3 and DeFiDescription:
This trading idea centers on ETH (Ethereum), the second-largest cryptocurrency by market cap and the backbone of the decentralized application (dApp) ecosystem. ETH is not just a digital currency, but a programmable blockchain supporting smart contracts, DeFi platforms, NFTs, DAOs, and much more. With the successful transition to Proof of Stake through the Ethereum 2.0 upgrade, the network has significantly improved its scalability and energy efficiency, reinforcing its long-term viability. Institutional interest, widespread developer activity, and real-world utility make ETH a cornerstone asset in the blockchain space, especially as Web3 adoption accelerates globally.
Despite its strong fundamentals, the crypto market remains highly volatile and susceptible to macroeconomic trends, technological developments, and regulatory changes. Therefore, even well-established assets like ETH carry risks that investors should carefully consider.
Disclaimer:
This trading idea is provided for educational purposes only and does not constitute financial advice. Trading or investing in cryptocurrencies like ETH involves substantial risk, including the potential for complete loss of capital. Always conduct your own research, evaluate your financial situation, and consult a licensed financial advisor before making investment decisions. Past performance is not indicative of future results.

ETH Bulls Waking Up – But Can They Break This One Last Barrier ?Hello Traders 🐺
As the old man said: "Those who survive the dump, deserve the pump." 😂😉
I hope you're doing well — and if you're still here after the last few weeks, you're already ahead of the crowd.
Let’s break down the current ETH situation and see why this could be the beginning of a major shift:
🔹 Daily Chart Overview :
ETH is testing the top of a descending channel. If we see a breakout here, the road toward $2100 is wide open — that’s a +23% move and could signal the start of a full trend reversal toward $4000.
But why am I so confident? Let's dive deeper:
🔹 Market Sentiment & On-Chain Signals
ETH is heavily oversold
Fear & Greed Index is at extreme fear
Altseason Index near historic lows
ETH/BTC is sitting on long-term support
🔹 ETH/BTC Monthly Chart:
ETH is at a key monthly demand zone against BTC. Historically, this area has triggered ETH dominance and massive altcoin rallies.
🔹 BTC.D vs ETH:
BTC Dominance (BTC.D) is showing signs of topping out at key resistance, while ETH/BTC is forming a bullish divergence — a classic setup for rotation from BTC to ETH and altcoins.
🟢 Weekly ETH Chart ETH is sitting right on a major support zone. This is where reversals begin. If it holds, this could be the last dip before a major breakout.
💬 Final Thought:
Let me know your thoughts in the comments. Are you loading ETH or still waiting for confirmation?
And as always:
🐺 Discipline is rarely enjoyable, but almost always profitable 🐺
🐺 KIU_COIN 🐺

** ETH/USDT Update: Key Levels & Reversal Watch** Hello everyone, this is Dark Analysis.
### **📌 Latest Technical Outlook**
1. **Previous Analysis Hit Target**:
- Support at **$2,435.32** held as expected, and the target was achieved.
- Break above **$2,513.43** has shifted bias to **bullish**.
2. **Current Price Action**:
- **Bullish Scenario**: Price is likely to hunt liquidity in the demand zone near **$2,463.45**.
- *Entry (Long)*: Only if a **reversal pattern** (e.g., Bullish Engulfing, Hammer) forms here.
- *Stop Loss*: **$2,449.44** (below recent swing low).
- **Caution**: No long trades if price approaches the zone with **weak bullish momentum**.
3. **Bearish Invalidation**:
- Shorts are **off the table** unless:
- A new **supply zone** forms.
- Price shows **weakness after retesting highs** (e.g., lower high + RSI divergence).
---
### **🎯 Trade Plan (If Setup Triggers)**
- **Entry Zone**: **$2,463.45** (Demand Area)
- **Confirmation**: Reversal candle + volume spike.
- **Target**: Previous high (**$2,513.43**) → **$2,550** (next liquidity zone).
- **Stop Loss**: **$2,449.44** (tight risk management).
---
### **📊 Key Chart Levels**
- **Support**: $2,463.45 (Demand Zone) → $2,435.32 (Strong Base)
- **Resistance**: $2,513.43 (Breakout Confirmation) → $2,550 (Next Target)
---
### **⚠️ Critical Reminders**
- **No Longs on Strong Momentum Dips** (Wait for structured pullbacks).
- **Avoid Shorts Unless New Supply Forms** (Trend is bullish above $2,513.43).
- **Always Use Stops** (Protect capital in volatile moves).
---
**📌 Final Note**: *"Trade the structure, not the noise!"* Updates will follow if the scenario changes.
**🔍 Follow for real-time insights!**

ETH/usdtreclaimed area it can help you for your knowlege how to get enter in market for to make your trading for short time period and earn profit

Bump and Run Reversal Bottom Pattern (BARR)Ethereum on Daily Tim Frame formed a bump and run reversal bottom pattern which is a bullish reversal pattern. During the beginning of the pattern, price often follows a down-sloping trendline that ranges from 0 to 45 degrees or little more in rare cases. Afterwards, a sharp decline in the price of an asset happens that is often followed by a relief bounce till the price touches key resistance level. A breakout above this key resistance level confirms the validity of Bump and Run Reversal Bottom Pattern.
Ethereum broke the key resistance level and we are expecting the price to retest the broken structure and trendline before it continues to upside and the target price measured from Lead In phase. In this scenario Ethereum looks more bullish then ever and all Atl coins will follow suit.
Also Ethereum’s major Pectra upgrade, combining Prague and Electra, went live on May 7, 2025. It introduced 11 key changes to improve speed, cost-efficiency, and usability which helped the price of Ethereum to bump to the upside.

HOW: TradeAgent Pro Technical Analysis FrameworkWelcome to our technical analysis community! This comprehensive guide explores advanced trading concepts and systematic risk management approaches.
SYSTEM OVERVIEW
TradeAgent Pro combines multiple technical analysis tools into an educational framework for market analysis and risk management.
KEY FEATURES:
1. Advanced Market Analysis
• Multi-Timeframe Integration
- Long-term trend identification (EMA/SMA)
- Short-term momentum signals
- Market structure validation
• Visual Confirmation System
- Strong trends: Green/Red signals
- Moderate trends: Yellow/Orange indicators
- Multiple confirmation points
2. Risk Management Suite
• Dynamic Stop Loss Technology
- ATR-based volatility adaptation
- Multiple timeframe validation
- Automatic adjustment system
• Strategic Take Profit Framework
- Multiple TP levels
- Position scaling methodology
- Risk-reward optimization
• Intelligent Trailing System
- Dynamic trailing activation
- Position-based adjustments
- Momentum-driven modifications
3. Professional Tools
• Entry Management
- Systematic confirmation signals
- Risk-adjusted sizing
- Market structure analysis
• Exit Framework
- Multiple exit strategies
- Risk reduction system
- Position adjustment logic
EDUCATIONAL RESOURCES:
• Regular technical analysis updates
• Community trading discussions
• Educational content sharing
• Risk management concepts
IMPLEMENTATION GUIDE:
1. Study the framework thoroughly
2. Practice in demo environment
3. Document your observations
4. Adapt to market conditions
5. Focus on risk management first
IMPORTANT DISCLAIMERS:
• Educational content only
• Not financial advice
• Requires extensive testing
• Trading involves significant risk
• Past performance isn't indicative
JOIN OUR COMMUNITY:
1. Send private message
2. Include:
- Trading experience
- Preferred markets
- Analysis timeframes
3. Await verification
No public access requests.
Stay updated with our latest educational content and technical analysis discussions.

After a 37% Surge, Is Ethereum Still a Buy...?Ethereum Breaks Key Resistance, Signaling Potential Trend Reversal
Ethereum has delivered two significant technical signals indicating a potential trend reversal. The first is a breakout above the longstanding downtrend line, and the second is the breach of the critical \$2,100 resistance level. These developments suggest growing bullish momentum in the market.
With both confirmation signals in place, Ethereum appears poised for further upside. Traders may now look for a potential pullback or retest around the \$2,100 level, which could serve as a strategic entry point for long positions.
If this level holds as new support, the next target to watch is the \$2,800 mark, aligning with broader market expectations and previous price structure zones.
As always, traders should monitor price action closely and manage risk accordingly in case of volatility around key levels.
