ETHUSDT Finally breaks long term wedge patternThis is dangerous for ETH this is a madness, we may meet the targets of 1200 or even all the way through 800 bucks in this
ETHUSDT.PS trade ideas

Ethereum (ETH): We Are At Major Support Area $1,500 Where Now?Ethereum has had one of the nastiest drops since the top, where the price has been dipping and dipping, breaking every supportive zone we had on the way. We are closely monitoring the current zone where ideally we need to see some sort of bullish volume, which we wait for in order to start buying but we are careful here.
If we break the current zone, then the $1,000 zone will be the next to watch for!
Swallow Academy

ETH May Drop to $1,400ETH May Drop to $1,400
Ethereum (ETH) lost nearly 12% of its value within just three days after breaking out of its recent pattern last Friday.
The movement of ETH, along with the rest of the cryptocurrency market, is closely tied to Bitcoin (BTC). BTC has already dropped to $81,300 and shows signs of further decline.
It's likely that ETH will consolidate near its current level before continuing to move lower, as seen in the chart.
For now, it would be wise to wait for the price to form another bearish pattern before entering a trade. There's a strong possibility that ETH may extend its drop to $1,400.
You may find more details in the chart!
Thank you and Good Luck!
❤️PS: Please support with a like or comment if you find this analysis useful for your trading day❤️

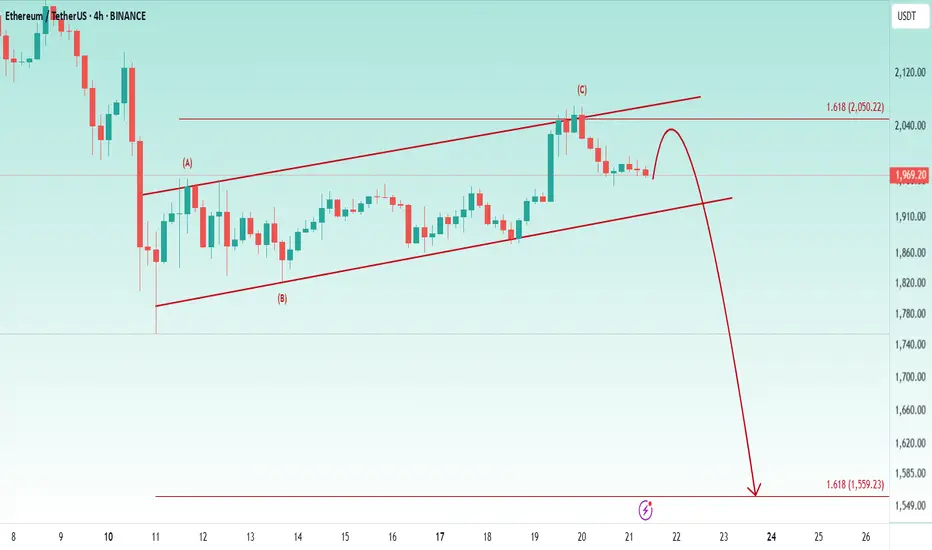
Down Rally All Over The Market Soon📥 There Is No Major Changed About My Bearish Expectation About Ethereum
📉 The Price Perfectly Rejected From 1.618% PRZ And Currently Playing At The Middle Of a Bearish Flag, Expect a Breakdown The Trend Line Toward a 1560$ Soon
ETHEREUM REVERSAL INCOMING !!!!Ethereum formed major bat harmonic pattern and now approaching to it's Potential Reversal Zone. Also with that, it's approaching to it's range low. We can expect sweep of range low, although 1400-1200$ region is strong PRZ after that targets would be straight towards 4500-5000$

Expecting this move on Ethereum We will likely hold this level with some consolidation, if we do hold it firm on these levels. We should be expecting this move in the upcoming weeks.
Eth is gonna be back into play very soon.

Ethereum nearing resistance—ready for a 13% drop to $1,700?Hello and greetings to all the crypto enthusiasts, ✌
All previous targets were nailed ✅! Now, let’s dive into a full analysis of the upcoming price potential for Ethereum🔍📈.
Ethereum is moving within a descending channel and nearing a key daily resistance level at the channel’s upper boundary. A potential 13% decline is anticipated based on technical analysis. The primary downside target remains at $1,700.📚🙌
🧨 Our team's main opinion is: 🧨
Ethereum is near key resistance in a falling channel, with a 13% drop to $1,700 looking likely.📚🎇
Give me some energy !!
✨We invest hours crafting valuable ideas, and your support means everything—feel free to ask questions in the comments! 😊💬
Cheers, Mad Whale. 🐋

Last Chance To Buy Eth That Lowthis chart is published in 2 weeks before on eth usd dollar sorry for delay
you can see it
I Am Warning You This Is The Last Chance To Buy Eth That Low
TP1 4000
TP2 7000
TP3 10000
Iam not magician i am just mensa

ETH/USDT Weekly Breakdown, Major Support Lost!📉 ETH/USDT Weekly Breakdown – Major Support Lost
Ethereum broke down from a 1,885-day ascending trendline support, confirming a significant structural shift. The weekly closed at $1,707 (-4.2%), but within just four hours of the close, ETH dropped another 14.8%, hitting $1,543 – a clear sign of weakness and market uncertainty.
🟢 Support Levels to Watch:
$1,348 – strong historical demand zone
$1,042 – next key weekly support
$885 – June 2022 low (less likely, but not off the table)
📅 Historically, April tends to be bullish for crypto, but so far, the charts show no bullish momentum.
🚫 Not my opinion – just what the charts are saying.
Let me know what you think in the comments and please hit that like button if you like it.
Thank you
#PEACE

ETH - BUY ZONEThe time has come. The train is leaving.
Everyone is caught up in pessimism.
BTC dominance is near its peak. ETH/BTC is at the bottom.
Interest rates will drop and monetary expansion will begin.
A PERFECT ENVIRONMENT FOR A RALLY.

Long here.Genius I know right.
I though I was special calling for a big drop on XPR and closed out a nice trade to start my week with my morning coffee here in NZ.
Of course I look at the rest of the market and see that the drop was clearly across the board. I don't feel as special, but still happy. And will be really happy if we are close to a support level on ETH after this 10% drop. I am already in long with some size and ready to average into a much bigger long position. This is where I am happy to not run close stops, size up without crazy leverage and let my liquidation point act as my stop. Very rarely, but this is a very good opportunity in my opinion. Just be mindful to have a plan if we go lower, but I think we will retrace back up to $1687 within the next couple of hours.


ETH touches the 78.6 FIB - Time to buy? Is it time to buy back into ETH?
If we get rejected here at the 78.6 and go up it is a very good buy. Fear and greed index at the lowest ever in history if you compare it with the price levels. Price high, but fear at the bottom.
Are you buying?

Sell ethHello friends, I predict the same analysis for Ethereum in the future. If Ethereum loses this support at 1500, the next target will be $1000._900$

ETHUSDTEthereum will definitely return from this price range to the target of $4000, the price range is the price retracement ($1428-$1125-$802).

Ethereum Buy Zone: The 1632–1521 Range as a Strong InstitutionalEthereum (ETH), being one of the most dominant cryptocurrencies in the market, often experiences significant price fluctuations driven by market sentiment, institutional interest, and macroeconomic conditions. A critical price range to watch for accumulation is between $1632 and $1521, which serves as a strong demand zone for both long-term investors and institutional players.
Why This Range is Significant?
1. Historical Support Level
The $1632–$1521 range has historically acted as a key support level where Ethereum has rebounded multiple times.
Previous price action suggests that buyers step in aggressively in this zone, preventing further decline.
2. Institutional Interest & Smart Money Accumulation
Large investors, also known as “smart money,” tend to accumulate ETH in strong support zones, and this area has seen increased institutional buying in the past.
Institutional investors prefer entering the market at lower, well-established support levels to maximize their long-term gains.
3. Risk-Reward Ratio is Favorable
Buying in this range offers a strong risk-reward ratio because the downside risk is limited compared to the potential upside.
If Ethereum holds this support, a bounce toward $2000+ levels becomes more likely.
Conclusion
The $1632–$1521 zone is a high-probability buy area for Ethereum, backed by strong technical and fundamental reasons. Institutions and long-term investors are likely to enter aggressively here, making it an ideal range to accumulate ETH for future growth. However, risk management remains crucial, and tracking Bitcoin’s movement, market trends, and global economic factors will help refine the entry strategy further.

My eth short Last night not broken
Price keeps mitigating the supply zones signaling down movement
Trendline acting as resistance
Targeting the spike low to be cleared

ETHUSDT 4H | CONSOLIDATION Break UP or DOWN?
From the ETH/USDT (Ethereum) chart on the 4H (4-hour) timeframe you see, here’s a brief analysis of the support and resistance levels based on the existing price structure and horizontal lines:
1. Support:
• Main support around $1,751
This is visible from the purple horizontal line and previous price reactions that rejected further downside in this area.
• Minor support around $1,578 – $1,580
This area is marked below (also seen as a previous reaction zone). If the $1,751 support breaks, the price is likely to move toward this area.
2. Resistance:
• Strong resistance around $2,280 – $2,300
Marked by the thick purple horizontal line at the top. This is a significant area from a previous supply zone and could be a potential target if the price breaks upward.
• Minor resistance in the FVG 4H area (around $1,880 – $1,900)
This Fair Value Gap area could act as a balanced zone that often attracts price for a retest.
• Dynamic resistance:
• 200 MA (orange curved line): currently may also act as a dynamic resistance level.
Summary:
• The price is currently in a sideways/consolidation phase above the $1,751 support level.
• It’s important to watch whether the price will bounce from support or break downward toward $1,580.
• If the price starts to rise, the FVG 4H zone could be a short-term target, with the major resistance at $2,280 as the next potential target.
Remember trading is to manage your risk & reward
so do your own research

I am Still Bullish ! For me Price will hold this support for today both ETH and BTC
I am Bullish and long on ETH for the next 48 hours
Weekly will rise later tonight i suppose
Just a thought !


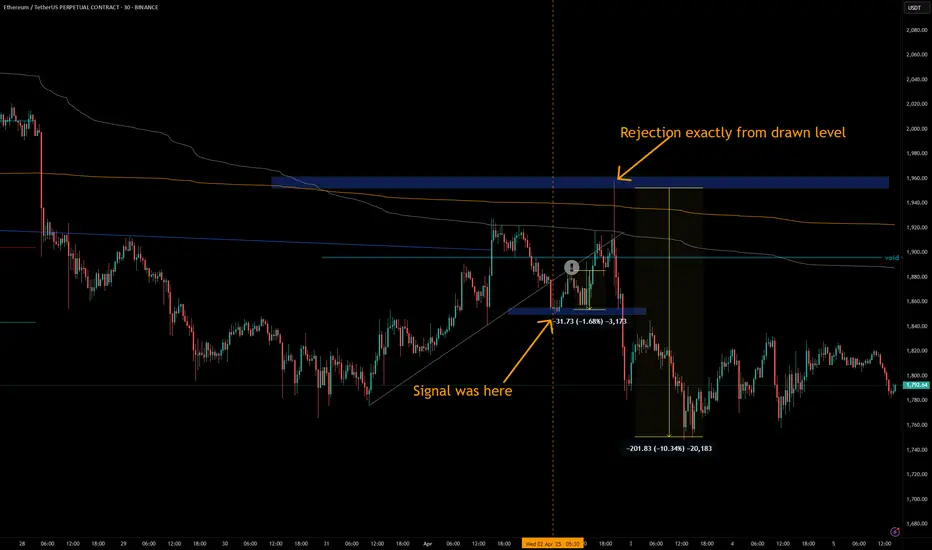
ETH - Excellent Signal/TA two days ago.I again gave my levels for ETH and got a hilarious reactions on my levels :)
1️⃣) A nice reaction on grey trend line which was marked grey .
Reject exactly from where I wanted 👌 🎯.
💵💲 1.6 %
2️⃣) How my blue box was rejected. Just perfect. I was awaiting that manipulation big red wick to my upper blue box👌🎯 . Crypto movement was way too healthy in last weeks.
That rejection gave over 10 % 💵💲 .
3️⃣) I opened a short right under the grey TL and the grey AVWAP. 👌 🎯
Here my Original Signal:
Follow for more ideas/Signals. 💲
Look at my other ideas 😉
Just donate some of your profit to Animal rights and rescue or other charity :)✌️
Lingrid | ETHUSDT approaching Key SUPPORT LevelBINANCE:ETHUSDT market has been moving sideways throughout the month, with the price gradually approaching the support level around 1700. The current month has closed bearish, and there is a possibility that the price may dip below the previous month's low before making a move higher in the long term. As we approach the mid of the current month, there seems to be a potential for the price to start moving upward. I anticipate that the price may briefly go below the 1700 level and then bounce back if it forms a fake breakout. This could present a buying opportunity, especially if the price shows signs of reversal after testing that support level. My mid-term goal is resistance zone around 2300.
Traders, if you liked this idea or if you have your own opinion about it, write in the comments. I will be glad 👩💻

ETH-----Sell around 1810, target 1750 areaTechnical analysis of ETH contract on April 5: Today, the large-cycle daily line level closed with a small negative line yesterday, and the K-line pattern continued to fall. The price was below the moving average. The fast and slow lines of the attached indicator were glued together and flattened. From this point of view, the time happened to be on the weekend, and the weekend was mainly focused on corrections. So can we predict whether the trend of the second big drop will continue next week? Let's wait and see; the short-cycle hourly chart was under pressure in the early morning, and the K-line pattern showed continuous negative lines. The attached indicator was dead cross running, and the high point of the correction was near the 1836 area. From the perspective of various technical indicators, the current decline will continue, but the strength will not be very large.
Therefore, today's ETH short-term contract trading strategy: sell directly at the current price of 1813 area, stop loss in the 1843 area, and target the 1750 area;
