Ethereum Prepares for Major Pectra UpgradeEthereum—the second-largest cryptocurrency by market capitalization—is set to undergo a major upgrade in May 2025, known as “Pectra.” This update promises to significantly improve scalability, performance, and user experience. But what exactly does it entail?
Pectra follows the groundbreaking "Merge" event of 2022, which shifted Ethereum from proof-of-work to proof-of-stake consensus. With that transition complete, developers have now turned their focus to making the network faster, cheaper, and more user-friendly.
The upgrade includes several Ethereum Improvement Proposals (EIPs), targeting transaction processing, wallet functionality, and validator operations. Some key highlights are improvements in staking, partial withdrawals, adaptive fee structures, and better client compatibility.
Most notably, Pectra enhances staking mechanics, allowing validators to partially withdraw funds—something that was previously restricted. This change is expected to attract more participants to Ethereum’s staking ecosystem.
Transaction efficiency is also a central focus. The upgrade aims to reduce network congestion and lower gas fees, which have long been a pain point for users of decentralized finance (DeFi) platforms and NFT marketplaces.
Investor sentiment is cautiously optimistic. Though ETH price action remains relatively stable, trading volumes have increased as traders position themselves ahead of the upgrade. Analysts suggest that a successful implementation could trigger a rally in Ethereum’s price, especially if the changes deliver on promised performance gains.
Ethereum continues to dominate the smart contract space despite increasing competition from blockchains like Solana and Avalanche. Pectra could further solidify Ethereum’s lead, especially if it improves network speed and lowers costs without compromising decentralization.
This upgrade isn’t just a technical patch—it’s a strategic move to future-proof the Ethereum ecosystem in the Web3 era. With Pectra, Ethereum reinforces its role as the foundational infrastructure for decentralized applications.
ETHUSDT.PS trade ideas

possible short entry reversal point!Levels to keep an eye on for BOS for a high possibility short entry. In order to reach the higher levels a ABC structure is vital. looking for trendline break for confirmation.

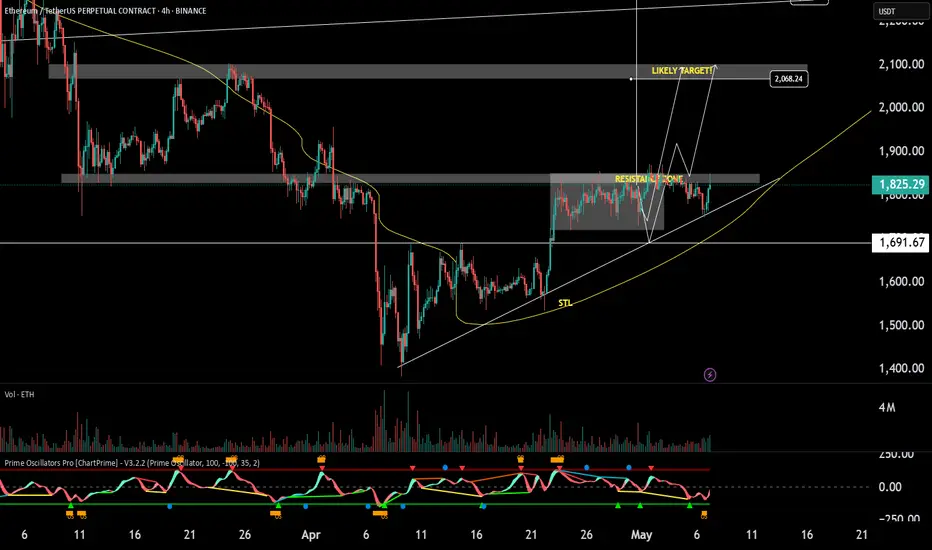
$ETH Bullish!CRYPTOCAP:ETH continues to hold strong at support — a breakout is likely.
Target remains at $2,000.
This is the 6th attempt to break the same resistance zone — remember, every touch weakens it.
We still have higher lows plus bullish divergence forms on the oscillator. (bias - BULLISH!)
ETH Rejects from 0.618 Fibonacci — $1,540 in Sight?Ethereum has rejected from a key resistance cluster around the 0.618 Fibonacci level. With price slipping below the point of control, downside continuation toward $1,540 looks increasingly probable — unless bulls step in soon.
Key Highlights:
Confluence Resistance Zone: 0.618 Fib, daily resistance, and descending VWAP capped recent price action.
POC Lost: The local point of control has broken down, showing sellers are dominating the short-term range.
Lower Structure Forming: Ethereum is setting lower highs, with $1,540 as the next key support and potential draw for price.
Full Analysis:
ETH/USD has stalled under a strong resistance zone combining the 0.618 Fibonacci retracement, daily structure, and a descending VWAP from the prior lower high. After multiple failed attempts to break higher, price is rolling over — and has now lost the local volume point of control (POC).
This breakdown suggests that value is no longer being accepted at this level, and we may see a rotation lower. Ethereum is also forming a short-term bearish structure — with lower highs and weak attempts at reclaiming lost levels. The next key support sits at $1,540, which also aligns with unfilled inefficiencies and resting liquidity from previous upside moves.
If ETH loses the recent swing low, a move toward $1,540 becomes increasingly likely. However, a reclaim of the POC could indicate this is just a fakeout before buyers attempt another breakout.
What to Watch Next:
Hold above current swing low = potential bounce.
Break below = opens path to $1,540.
Reclaim of POC = short-term bullish invalidation.

#ETH Breakout is incoming!$ETH/USDT – Breakout Watch
Ethereum is currently retesting a key descending resistance line after an extended period of consolidation. The structure suggests growing bullish momentum.
🟢 A successful breakout and daily close above the $1,900–$2,000 zone could trigger a move toward $2,200–$2,400 in the coming sessions.
Watch for confirmation with volume expansion and retest behavior. Rejection at this level could delay the move, but the pressure is clearly building.
Key Levels:
Resistance: $1,900–$2,000
Target: $2,200–$2,400
Support: $1,800
Chart looks clean breakout potential is real.
DYOR NAF
BINANCE:ETHUSDT BITSTAMP:ETHUSD

ETH/USDT ETH/USDT 4-hour chart
Price is currently just above the 200 EMA, which often acts as dynamic support.
ETH has been consolidating around this level neither showing strong bullish breakout nor bearish breakdown.
The price is ranging sideways in a relatively tight band, showing a lack of strong momentum either way.
There’s no clear higher high or lower low — a neutral/balanced market phase.
Recent candles show wicks on both ends, indicating indecision and equal pressure from buyers and sellers.
As long as price holds above the 200 EMA (~$1780), bulls maintain slight control.
If ETH breaks and closes below the 200 EMA, it may open a path toward lower support zones (~$1740, $1700).
To regain bullish momentum, ETH need to break and hold above ~$1840–$1860, the recent local highs.
Looking for breakout with strong momentum, watch for massive volume candle.
stay strong and take care.

Ethereum (ETH/USDT) Trading Analysis: Bullish Momentum AheadEthereum (ETH/USDT) Trading Analysis: Bullish Momentum Ahead
1. Trend Overview
ETH/USDT is displaying a strong bullish trend, with recent upward price action marked by consecutive green candlesticks. The current price of 1,833.02 USDT reinforces bullish momentum, suggesting sustained buying pressure.
2. Key Levels
Support: The 200-period moving average (green line) acts as dynamic support, offering a potential entry point on pullbacks.
Resistance: Immediate resistance lies near recent highs. A breakout above this zone could trigger further upside. Bollinger Bands highlight volatility, with the upper band signaling potential resistance.
3. Technical Indicators
MACD: Bullish momentum is confirmed, with the MACD histogram in positive territory.
RSI: At 45, the RSI indicates neutral conditions—no overbought or oversold signals—leaving room for upward movement.
4. Trade Setup
Entry: Enter long at 1,840 USDT (above current price) to confirm trend continuation.
Stop-Loss: Set at 1,800 USDT (below the 200 MA) to limit downside risk.
Take-Profit: Target 1,900 USDT (short-term) and 2,000 USDT (mid-term)**—a 3-9% return potential.
Final Summary
Asset: ETH/USDT
Bias: Strong Buy
Entry: 1,840 USDT
Stop-Loss: 1,800 USDT
Take-Profit: 1,900 / 2,000 USDT
Confidence: High
Pro Tips:
Monitor Bollinger Band width for volatility shifts.
Watch for reversal patterns (e.g., bearish engulfing candles) near resistance.
Why This Matters: Ethereum’s bullish structure, backed by technical confirmation, offers a high-probability trade. With clear risk-reward parameters and untapped upside, this setup is ideal for trend followers.
Ready to capitalize? Let me know if you need real-time updates or adjustments! 🚀

HolderStat | Insane Profits in 9 Deals🚀 Wallet turned $5.9K into 25.78 ETH CRYPTOCAP:ETH (~$47.4k) with just 9 trades, netting a massive 2567% profit in 58 months! With avg buy at $705 & avg sell at $4,647, it’s proof that smart timing and patience pay off big in crypto! 🔥

HolderStat | Tracking a long-term strategistThis trader turned $127 into $4,626 — that’s +3623% with just 3 trades over 5+ years.
He didn't chase hype.
He bought at $671 and sold at $4,741.
Minimal action. Maximum gain.
Wallet still holds 0.74 ETH CRYPTOCAP:ETH ($1.3K).
Proof that sometimes… doing nothing is the best strategy 🧘♂️

ETH Summer BearishA potential path for ETH before resuming a bullish major trend, is drawn with a purple arrow.
I don't think the FED will cut rates today. In fact, maybe in September. Maybe. If the FED cut rates, then the target scenario (green box in the chart) would not play out, we would shift to a bullish movement. I wish for that, but I don't think is near yet.
That being said, the current potential risk, I calculated it to -30% from current levels. Exact prices are impossible to predict, rather I focus on target areas.
DISCLAIMER:
Do Your Own Research, don't use mine to invest! This is not a financial advice, it is only a mere opinion of mine. I own several cryptocurrencies, including ETH.

ETH ~ H4 ETHUSDT.P LONG TRADE
SETUP
E : 1814.76
TP : 1952.00
SL : 1767.62
BREAKDOWN
Decent Structure break (Cisd ) change in state of delievery taking previous range highs,
Looking for some fills over h4 breaker block resting @ 1814.76ish aiming range highs ( erl ).

Eth ~ H4 AnalysisETHUSDT.P
Exchange : Bitget
Directional Bias
Htf : Bullish
Ltf : Locally Bearish to fill ineffiecines lower - send it higher from there.
Breakdown:
Price currently breaking Previous resistance zones while we had a Daily close above @ 1742ish confirming the bullish trend intact,
Tagged local Volume Gap marked by indicating aggresive buys sitting at these lows which they dont want to lose,
Key Important Levels :
1) 1956 (Low - term targets )
2) 2017 (Mid - term targets )
Looking at the 1811 zone for ltf confirmation to bid largos aiming 1956ish region,
After tagging 1956ish fills - > ltf accumulation and we squeeze aiming our secound zone resting @ 2017

Ethereum about to flyAs the falling channel for ethereum has broken few days ago, now the weekly MACD is about to make a bullish cross as well, and that makes ethereum to fly soon

Ethereum Nears Breakout: Strong Support, $1950 Targeted NextHello and greetings to all the crypto enthusiasts, ✌
All previous targets were nailed ✅! Now, let’s dive into a full analysis of the upcoming price potential for Ethereum 🔍📈.
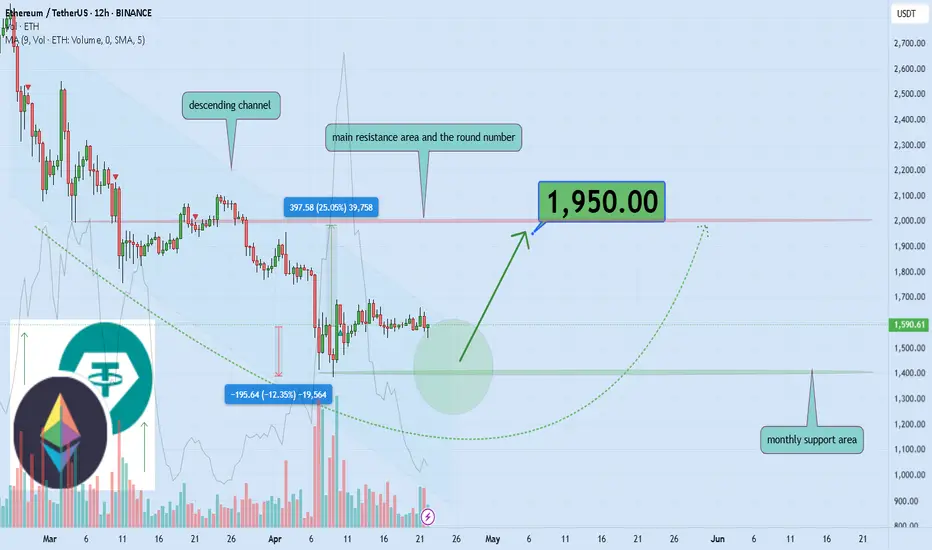
Ethereum has been trading within a downward cycle, but a short-term breakout above the descending channel appears likely. The price is approaching the key psychological level of $2,000, with a primary target of $1,950. This suggests a potential upside of at least 25% from a strong support zone.📚🙌
🧨 Our team's main opinion is: 🧨
Ethereum looks set to break out of its downtrend, eyeing the $2,000 mark with a main target of $1,950—about a 25% move up from strong support.📚🎇
Give me some energy !!
✨We invest hours crafting valuable ideas, and your support means everything—feel free to ask questions in the comments! 😊💬
Cheers, Mad Whale. 🐋
ETHETH had a trend reversal when it broke out of the daily downtrend as seen on chart with a clean a strong displacement. I am looking for a sweep of local highs and swing highs of the range that eth is in with a displacement and a confirmation before entering.

Ethereum Starts Moving Toward $7,000 With...Ethereum starts its next major advance towards a target of $7,000 and beyond with a full green candle this week.
This week is not only a full green candle signal it also cancels out the last two which produced a bottom and neutral signal, as well as recover more than three weeks of bearish action.
So now Ethereum is moving back to levels it traded back in late March, above $1,800. Going to this level means higher prices and this is only the start.
The 7-April week is such a strong clear reversal signal it is hard to explain. We have a Doji with a multi-year low, but this low ended with a green candle and confirmation comes this week as Ethereum turns full green. This is the last chance to get Ethereum below $2,000 and while prices are low.
When the next move happens, which is a close and confirmation above $1820, ETHUSDT will never trade at these prices and levels again, likely ever. It will grow and grow so much that nobody will be selling as much as they sold in the past. The start of a new long-term bullish cycle; the 2025 bull market.
I wanted to let you know that market conditions are green and you don't have to hold anymore. The market will start moving and produce a period of expansion that has not been seen in so long.
Even if you have experience with previous bull markets, it is hard to put in words. When it is happening it is so much different. It is not the same saying or knowing that Ethereum will grow as seeing it happen, and when it happens it goes more than what you think is possible or you are prepared for.
If for some reason you did not position yourself when the time was right, now, you will be thinking, "Why didn't I buy? The market was trading so low for long..."
You don't have to reach this point.
The charts are yours, the market is yours and you have experience.
You can take advantage of this situation and become a big winner in 2025 and beyond.
Many millionaires will be produced this year, will you be one of those?
I don't know but I am working hard.
Let's win together, we can do this with hard work, smart work and dedication.
Thanks a lot for your support.
Namaste.

ETHUSDT is Breaking Out!! Is the Bull Run Finally Here?After a long period of consolidation within a descending channel, BINANCE:ETHUSDT is showing signs of life as it finally breaks out with bullish intent. This technical breakout could mark the beginning of a fresh bull run, reminiscent of past explosive moves we’ve seen from MARKETSCOM:ETHEREUM following major corrections. Historically, CRYPTOCAP:ETH has experienced drawdowns of over 90%, only to bounce back stronger and reach new all-time highs.
Currently, BITSTAMP:ETHUSD remains deep in the oversold zone, suggesting it’s still undervalued relative to its potential. As momentum begins to pick up, we could see targets being hit one by one, driven by renewed investor interest and favorable market conditions.
Moreover, the recent surge in COINBASE:ETHUSD ETF inflows adds fundamental weight to the technical setup. This institutional participation could act as a catalyst for a sustained rally, reinforcing the bullish bias.
That said, risk management is key. Always trade with a clear stop loss and position sizing to protect capital. The opportunity is brewing – the question is, are you ready to ride the wave?
BYBIT:ETHUSDT Currently trading at $1790
Buy level : Above $1750
Stop loss : Below $1490
Target : $4000
Max leverage 3x
Always keep stop loss
Follow Our Tradingview Account for More Technical Analysis Updates, | Like, Share and Comment Your thoughts

Ethereum vs SolanaIn 2025, the competition between Ethereum and Solana is no longer just a rivalry — it’s a pivotal chapter in blockchain evolution.
We are witnessing a clash of two philosophies:
Ethereum — maturity, security, and deep ecosystem
vs.
Solana — speed, efficiency, and adaptability.
📈 Price Resilience vs. Market Legacy
While Ethereum still holds the crown in market cap and institutional trust, Solana is rewriting the rules with superior transaction speed and cost-effectiveness.
The question is no longer "Who is better?"
It’s "Who is evolving faster?"
⚡ Key Drivers Shaping the Ethereum-Solana Rivalry
1️⃣ Scalability vs. Stability
Solana leads with up to 65,000 TPS, attracting high-frequency traders, NFT creators, and DeFi innovators.
Ethereum, relying on its Layer-2 solutions, tries to balance security with scalability.
2️⃣ Institutional Shifts
Funds like Galaxy Digital and Ark Invest are reallocating capital towards Solana, betting on efficiency and growth.
Ethereum, meanwhile, is waiting on ETF approvals to regain momentum.
3️⃣ Technological Innovation
Ethereum focuses on sharding and Layer-2 expansion.
Solana pushes aggressive ecosystem growth but pays the price with occasional network instability.
📊 Market Performance Snapshot — 2025
Ethereum: ▼ 56% YTD | ~$1,600
Solana: ▼ 40% YTD | ~$135
Solana’s DEX market share jumped to 39.6% in Q1, driven by meme coins and retail traders.
Ethereum’s dominance continues to erode under macro pressures and rising competition.
But don’t be fooled — Ethereum's foundation remains strong. Institutional adoption and infrastructure upgrades still offer potential for a rebound.
📉 ETH/BTC Looks Like a Meme
ETH/BTC:
SOL/BTC: Potential -50% in next 160 weeks ➡️
ETH/SOL:
⚡ Where Did the Liquidity Go?
The real question isn’t why ETH is dropping —
It’s why no one cares.
Layer 2 solutions — Arbitrum, Optimism, Base — have drained liquidity from Ethereum’s mainnet.
DeFi activity? → Migrated to L2
Users? → Choosing lower fees and speed
Ethereum L1? → A blockchain for whales and archives
No liquidity = No rally
No narrative = No attention
Funds are betting on Solana and L2, not Ethereum’s base layer.
🎯 When Could ETH Take Off?
Only if we see:
A strong “Liquidity Returns to L1” narrative (RWA could be a trigger)
Spot ETH ETFs launching with institutional accumulation
A new DeFi wave on L1 (unlikely with current gas fees)
Or simply — when the market decides to pump forgotten assets
For now, Ethereum is about patience.
Smart money is flowing into L2, Solana, and high-risk narratives.
🕒 But Time Will Tell...
Today, we debate ETH vs. SOL.
Tomorrow — the bull market ends, and we’ll be discussing entirely different narratives.
Are you SOL or ETH?
As always, stay one step ahead.
Best regards,
EXCAVO
______________________________
Disclosure: I am part of Trade Nation's Influencer program and receive a monthly fee for using their TradingView charts in my analysis.

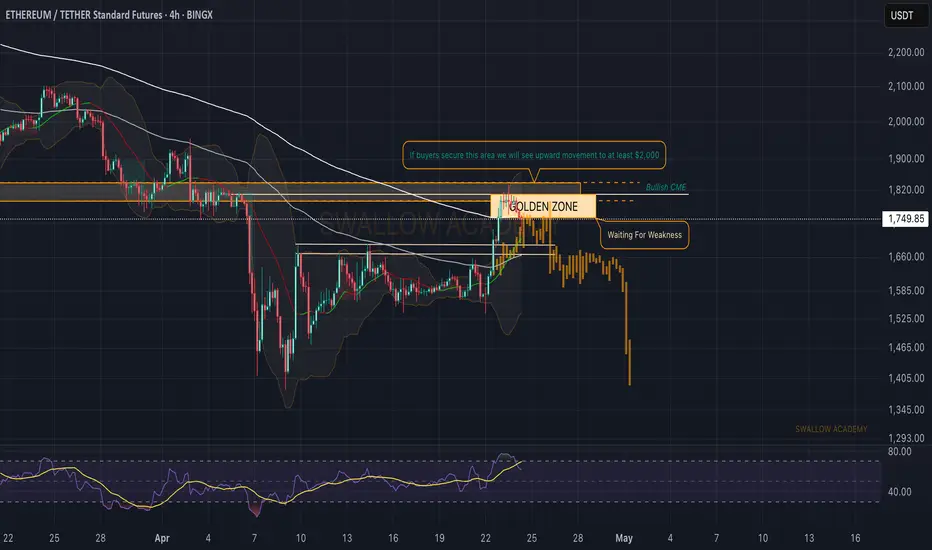
Ethereum (ETH): Reached "Golden Zone" | Zone of Rejection?Ethereum has done a decent pump since bottoming, where now the price has reached our golden zone where we had a nice 10% pump so far, which filled our CME, touched our resistance zone and also formed a nice liq candle above 200EMA.
If all goes well, we might see an MSB form here, which would send the price to lower zones here, but if we see any sort of further movement to upper zones and buyers manage to secure that resistance zone and turn it into a support zone, then we will be looking for the $2,000 area.
Swallow Academy
$ETH Breakout – High Probability Move Ethereum has been in a downtrend since December 16, showing consistent lower levels. However, we’re now seeing a confirmed breakout above the trendline, which signals a strong potential reversal.
This breakout suggests a high-probability move to the upside, with price targeting the $4,000 level in the coming period.
Keep watching — the momentum is building.
Follow me for updates and analysis as the setup plays out. BYBIT:ETHUSDT.P


ETH(20250429) market analysis and operationTechnical analysis of ETH contract on April 29: Today, the large-cycle daily level closed with a small positive line yesterday, and the K-line pattern was a single negative line. The price was consolidating at a high level. The attached indicator was in a golden cross operation. The overall trend of rising is still obvious. However, it should be noted that the price seems strong but the rebound did not break the high and did not continue. Instead, it quickly retreated under pressure after touching the high pressure level. At the same time, the low point moved up. In this way, the price will maintain a range of fluctuations before it breaks through the pressure position and support position; the short-cycle hourly chart was also in a range trend yesterday, with a high of 1850 and a low of 1750. The current price is in correction.
Therefore, today's ETH short-term contract trading strategy: buy in the 1750 area when it retreats, stop loss in the 1720 area, target the 1815 area, sell in the 1815 area when it rebounds, stop loss in the 1845 area, target the 1750 area; give real-time trading strategies based on real-time trends during the session

$ETH – The move is obvious.CRYPTOCAP:ETH – The move is obvious.
We already know what’s next.
If you’re not in, you’re watching gains walk away.
You snooze, you lose. 🚀
