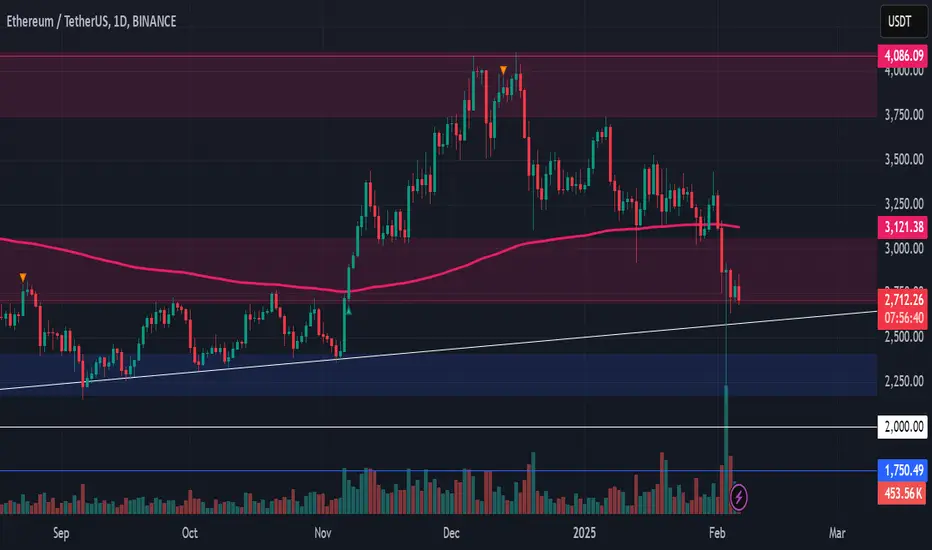
Another dip on ETH.ETH is once again at the support trendline and must hold this support on a weekly timeframe. Previously, ETH reached the accumulation range and delivered an approximate gain of 80%.
Now, it has hit the same accumulation range once again and moved back inside the triangle, leaving a long wick behind. The challenge is to close above the support within the weekly timeframe, which is 2 days and 8 hours away.
I expect a rebound in ETH in the second quarter.
Note: Always do your own research and analysis before investing.
ETHUSDT.PS trade ideas

Ethereum (ETH): Full Plan For EthereumOn Ethereum, we decided to give a proper look at what we are expecting to see in the upcoming month.
Basically, we are looking for a bullish momentum that would send the price to the upper resistance zone, from where we are expecting to see another movement of liquidity to lower zones, which we would count as a last drop before the final bullish momentum for this coin. I doubt that we will see $2000 but somewhere in the mid $2000s we should see it one more time!
Swallow Team

Update ETH: wicked out on my limit 1:7The setup I had before going to bed wicked me out when I was dreaming about my future life.

ETH ping pongLet's see if this plays out. Short only on chart, I didn't take but there was a nice 1 minute divergence as a confluence.

ETh 1:7Eth similar setup to BTC. I tried to snipe the short multiple times until I got it. It looks like it's holding stronger than btc, therefore my tp did not hit but I fully close the position at 1:6

ETH It is so Over ?ETH still in downtrend in mid timeframe on 4H and 1D or maybe big sideways on 1D
But if we continue down and break below 2k i think we can see cycle is over and posible to go to 1.2k
And take a note buying presure altcoin is low

ETH Next Move Fake-Out Zones and Trend Reversals AheadDo you enjoy spotting fake-out areas? I certainly do—it's a key part of my trading strategy. Why? Because fake-outs are the tricks that make the majority of traders lose their money.
Let’s take a look at what’s happening right now: we’ve just seen a break of the triangle structure, accompanied by two fake-out circles highlighted in the orange boxes.
The green, yellow, and red lines represent key support areas I’ve marked from 2023 (the colors don’t mean anything specific it’s just a way to differentiate them). As you can see, price is reacting to these levels quite clearly.
What’s my outlook for Ethereum (ETH)?
Scenario 1: We could see some consolidation within these lines, with movement targeting the levels created by the Fibonacci lines.
Scenario 2: A possible consolidation within the blue box, followed by price action moving upwards, just like we've seen in previous cycles.
Right now, I view ETH as being in a zone of disbelief, and it’s clear that we’ll need some time before we see a shift in the trend to the upside. What’s interesting is that this area on the chart has shown similar behavior in the past, and I believe this could be a fake-out zone, convincing many traders that it’s the perfect time to buy.
Also, I’ve added my new Trend Follower Indicator at the bottom of the chart, which is designed to help you track trends more accurately. This tool can assist in identifying the prevailing trend and potential reversals, making it a valuable addition to your trading strategy.

Ethereum may return to the track! Weekly close crucial! Ethereum is currently trading near the lower boundary of a falling wedge pattern, which typically signals a potential bullish reversal, though confirmation is still needed. If the price breaks downward, it may test the $2,400 support, while an upward breakout could push it towards $3,200. The price is hovering around the 200-day moving average (MA), a key support level, while the 50-day MA acts as resistance. Volume Profile (VPVR) indicates strong resistance around $3,200-$3,400, while the $2,400-$2,500 zone has lower liquidity, suggesting a risk of sharp declines if broken.
If Ethereum breaks above $2,900-$3,000, it could gain momentum towards $3,200-$3,400, confirming a bullish breakout from the wedge pattern. Conversely, if the $2,500 support fails, the price may drop towards $2,400 or even $2,000, with further downside risk if it stays below the 200-day MA.
In conclusion, $2,500 is a critical support level, and a breakdown could trigger stop-losses. A sustainable uptrend is unlikely unless Ethereum clears $3,200. High volatility is expected in the coming days, so traders should remain cautious and manage risk accordingly.

ETH Long Spot OpportunityMarket Context:
ETH has retraced into a major support zone, presenting a high-probability long setup. If the price stabilizes and confirms support in this range, we expect a move toward key resistance levels.
Trade Details:
Entry Zone: $2,180 - $2,400
Take Profit Targets:
$2,700 - $3,050
$3,750 - $4,100
Stop Loss: Just below $2,000
This setup provides a favorable risk-to-reward ratio, targeting higher timeframe bullish continuation. Stick to the plan and manage risk accordingly! 📈🔥
ETHUSDT: Buy ideaBuy idea on ETHUSDT as you can see on the chart if only if we have the breakout with force the vwap and the resistance line by the buyers.

ETH Holding Strong – A Massive Move Ahead?Ethereum has shown strong respect for key price levels, particularly around $2.1K and $2.8K. Despite market volatility, the $2.1K support has held well, reinforcing its significance in Ethereum’s price structure. These levels have consistently influenced price action throughout the year, acting as crucial areas for buyers and sellers. Holding above them signals strength while breaking below could indicate weakness.
Currently, ETH is trading near the $2.8K resistance, a critical level for further upward movement. A decisive breakout above this zone would improve the higher timeframe outlook, potentially opening the door for a stronger rally. The faster Ethereum clears this resistance, the more bullish the market structure remains, increasing the likelihood of sustained momentum toward higher levels.

ETH/USDT Breakout Watch: Bullish Momentum Building?ETH is forming an ascending triangle , a bullish pattern . The price is testing the resistance near $2845 . A breakout above this level could push it toward $2900-$3000 .
- Bullish Scenario: A breakout above $2845 with strong volume may trigger an uptrend.
- Bearish Scenario: If ETH breaks below $2737 , it could drop to $2611 .
Watch for a decisive move—momentum is building!

This is just the beginning for altcoinsThe last downside move for most altcoins was probably the last liquidity grab before we can see some major upward moves .
note that i only buy spot and don't recommend futures leveraged trading because of high market volatility.

Different Types of W Patterns and How to Trade ThemHello dear KIU_COIN family 🐺 .
Recently, I decided to provide some educational content for you, my dear audience, and introduce some essential and basic trading terms.
Here’s what you should know: In these lessons, we will cover three different seasons:
🔹 Season 1: Reversal and continuation patterns.
🔹 Season 2: How to use RSI and other indicators to find good entry points.
🔹 Season 3: Definitions of Fibonacci and seasonality in trading.
Stay tuned for valuable insights! 🚀
✅ For the first section of 🔹 Season 1 , I’ll be covering W patterns— a well-known bullish reversal pattern :
As you can see in the chart above, we usually have three types of W recovery patterns , which are the most important ones for us. However, in this section, we just want to get a general understanding of them. In the upcoming section, we will learn how to trade them and explore how they actually appear on the chart and the story behind them !
✅ This is the first and most common type of W pattern:
✅ This is the second type of W pattern:
✅ This is the third type of W pattern:
Ok, guys; I think this is enough for today, and I hope you enjoyed this educational content. However, don't forget to ask your questions below and support me with your likes and follows for more of this content. 🐺🔥

ETHDo not be distracted with Eric Trumps tweet regarding them buying more ETH. They can buy more at a lower level.

Ethereum (ETH): Smaller Recovery Before Next Liquidity Grab?We thought to keep up with those daily updates on a daily timeframe, as we do not see any clarity on smaller ones.
So here we are, Ethereum has made an amazing recovery of 30% since the price reached $2000 and now we are trading back near $2700 and possibly moving towards $3000.
To be honest, we expect to see possibly another dump to come here but overall we would say that we do not think that we will see prices lower than $2000 anytime soon, if not never!
Bitcoin had it's time in this run; now it is time for Ethereum to overtake!
Swallow Team

ETHUSDT BINANCE DTailwinds:
- Trump's son tweets about twitter
- Possible ETF with yield incoming
- Clearer regulatory regim
Headwinds:
- old tech
- infighting at EF
Technical analysis:
PA:
- red support/resistance & 0.236 held as support.
OBV:
- tight channel has formed.
- break out of channel will show direction of movement.
Overall nice R:R if aiming for previous ATH ($4,868)
R:R: 2820/4868 = 58% growth
Sell if:
- PA drops/closes below red line / 0.236
- OBV drops below channel

Ethereum Every liquidity oportunity those big dogs buys eth by the millions every dip they can get they fill their bags while scare fish panic sell . The only difference between this crash and the ftx or luna crash is that there is no distribution but accumulation hitting all time high . There is no way this dudes are buying to lose money long term they never lose .

Ethusdt buy zoneI think eth dump to 2300 then upward to 8000
Because for fear in market and buy Walls


ETH/USDT 1H: Hidden Bullish Divergence – $3,300 on the Horizon?!ETH/USDT 1H Analysis
🚀 Follow me on TradingView if you respect our charts! 📈 Daily updates!
Current Market Structure:
Price at $2,785 consolidating in equilibrium zone after recovering from the $2,400 low.
RSI showing hidden bullish divergence, confirming strong momentum with higher lows.
Market structure remains bullish, but a clean break of $2,900 is required for continuation.
Smart Money Concepts:
Market Makers likely accumulating in the $2,750-$2,780 range, shaking out weak hands.
Liquidity resting above $2,900, suggesting potential breakout to premium zones.
Volume profile supports bullish continuation if resistance is cleared.
Key Levels:
Entry Zone: $2,750-$2,780
Targets:
T1: $2,900 (key resistance)
T2: $3,100 (psychological level)
T3: $3,300 (premium zone)
Stop Loss: Below $2,650 (recent swing low).
Risk Score:
7/10 – Favorable R:R ratio with clear invalidation point below $2,650.
Market Maker Intent:
Liquidity appears to be building above $2,900, indicating Smart Money's intent to push higher.
A break of $2,900 could trigger significant upward momentum toward premium zones.
Recommendation:
Long positions favorable within the $2,750-$2,780 range.
Monitor for volume confirmation above $2,900 before adding to positions.
Confidence Level:
8/10 – Bullish bias supported by strong technical structure and volume profile.
🚀 Follow me on TradingView if you respect our charts! 📈 Daily updates!

Trading: Do You Have What It Takes?Say whatever you want, I am the Master of the charts.
Are you scared? Are you scared now because the market moved?
I can see that you are scared... I can feel it, here it and sense it.
What is wrong with you today?
You are scared now because of a major flush but you were not scared when Ethereum was trading at 3.5K. In fact, you were ready to buy and go LONG. Not only LONG but you were ready to add up to 10X, sometimes even 20X at the worst time possible, how did that go?
Are you going to cry or become depressed?
Are you going to quit life and trading or, will you try again?
What happened to you?
I thought I earned your trust, why did you follow the rookie when I was here warning you, continually, that the market was going down and not going up?
How about removing leverage, no leverage... It is only gambling, it is an addiction.
90% of traders are losing money, only 10% are consistently taking money home.
What will you do?
Will you continue to fool yourself, your friends and your family telling everybody that it was somebody's else fault that you lost everything you put on a trade?
Will you accept your reality, change your approach to the market; learn from your mistakes?
I say you are better off leaving all together.
What's the point if you are not going to accept that you were wrong?
Well, if you accept that you made a mistake, all is good. Just don't repeat the same mistake anymore.
The mistake was a lack of experience.
The mistake is always the same. You got greedy and you thought you could make money fast and easy. Fast money does not exist, you will always get what you earn.
If you can't be successful with 1X, you won't be able to be successful with 20X.
If you cannot double $10, you will never be able to double $1,000. Please, get that straight.
The problem is not that you don't have enough money. That you need more money to trade, no. The problem is that you are approaching the market with the wrong mentality, this is a game for adults, this is not an easy game.
Once you appreciate this simple fact, the fact that trading is not something that is to be pursued for fun. You will realize that it will take a genius to be successful in this job.
Just as you cannot become a mechanic in a matter of hours or days;
Just as you cannot become a doctor without the right preparation, nor a singer, an actor or a dancer, trading is the same.
The only way to become a successful trader, is through hard work; dedication, consistency and persistence pay.
Get your mind straight.
Either develop patience, or invest the time that is needed to achieve success.
The market can be going up or down, you will never win if you don't learn to play the game.
It is a game for adults, a very expensive game.
Fortunes can be made, but, do you have what it takes?
Namaste.

Public trade #22 - #ETH price analysis ( Ethereum )💰 In continuation of our global idea for #Ethereum
03/02/25 for the first time liquidations on CRYPTOCAP:ETH exceeded liquidations on CRYPTOCAP:BTC
There are already a lot of “investigations” from Twitterers and not only how manipulative the market drain was on “red-black” Monday, but these are the realities of an unregulated market and “crazy” participants at all levels and ranks!)
They achieved their goal of wresting assets, including CRYPTOCAP:ETH , from weak hands and accumulating them in strong hands for future achievements.
In particular, the Trump family foundation owns $400m+ of #ETH, half of which was bought back at the recent notorious drop.
Well, we need to be in the trend and also bribe #ETH into our investment portfolio and crypto trading
🟢 Desirable OKX:ETHUSDT purchase zone - $2441-$2551
1️⃣ TP1 - $3800-3900
2️⃣ TP2 - $5900-6000
⌛️ And then: we'll see...
_____________________
Did you like our analysis? Leave a comment, like, and follow to get more
