ETH
ETH is aiming for a confident long-term growth.
The nearest areas of interest for profit-taking are $2,175 and $2,565.
ETHUSDT.PS trade ideas

Ethereum (ETH): Buyers Forming Market Structure Break Ethereum has made a decent foundation near $1,500, where buyers have formed a market structure break and secured the area.
This might be the turning point for the Ethereum and we might see a great start of a rally from here, as price has not yet reached anywhere near its potential price near ATHs, while Bitcoin has already formed its new high.
What we are expecting is the possible market volume to flow into ETH and coins that have been built on the Ethereum blockchain so we will be keeping an eye on them.
Swallow Academy

ETH at a critical Zone - Bounce or Drop?Ethereum is trading at a key level. Will we see a strong reversal to the upside, or is a deeper drop coming? What's your expectation?
Share your thoughts below!
Kindly support this idea with a LIKE👍 if you find it useful🥳
Happy Trading💰🥳🤗

ETHUSDT UPDATEEthereum is currently in a downtrend, but I want to predict where it will come back from. The area I mentioned has both an imbalance and an indecision candle. This means that 1680-1700 is an important support for us. We have fallen too much, that's enough. I will try to increase my analysis and add value to you.

HolderStat | Smart ETH whale spotted💼 Holding 6.5 ETH (~$11,722)
💰 Invested: $1.1K → Profit: $11K (+1006%)
📉 Avg Buy: $1,289 | 📈 Avg Sell: $4,572
📌 Bought more CRYPTOCAP:ETH a month ago
🦄 Still holding BME:UNI
Knows how to ride the cycle like a pro 😎

Ethereum (ETH/USDT) BULLISH wave?Ethereum’s weekly price chart reveals a structured trading range, with the cryptocurrency oscillating between a well-defined range low and range high. This cyclical pattern has repeated over time, suggesting that ETH could be poised for another upward move. However, confirmation will be essential before traders commit to any directional bias.
The chart demonstrates a consistent range-bound structure, where ETH finds strong buying support at the range low and faces resistance at the range high. Recently, the price has retested the lower boundary, signaling a potential bullish reversal. If past trends persist, Ethereum could face key resistance levels at $2,484, $2,910, $3,254, and $3,743 which we could mark as upside targets with the $4,200 level marking a critical breakout point.
If Ethereum surpasses $4,200, it could trigger a strong bullish trend. However, a failure to break this level may result in a return to the lower range, continuing the established cycle. A weekly close above $2,200 would reinforce a bullish outlook, while a break below support could lead to further downside pressure.
While the market hints at an upward move, caution is advised. Investors should watch for volume confirmations and price action signals at resistance zones. External factors such as macroeconomic conditions and fundamental developments could also influence Ethereum’s trajectory. Proper risk management remains key to navigating potential price fluctuations.

ETH is showing a potential reversal !on the 15 minute chart,
Price is holding strong above the support zone
and is now testing resistance at $1815
if it breaks, the next target is $1830.
scalpers don't miss this breakout opportunity!

ETHUSDT – Long Setup ETHUSDT – Weekly Structure + FVG + Fibonacci Confluence | Potential Long Setup
---
📌 Summary
Ethereum is showing signs of basing out after a prolonged downtrend, hovering near a high-timeframe fair value gap (FVG) zone. Weekly RSI is recovering from oversold territory, and the price is reacting around the 61.8% Fib retracement from the macro low to the 2021–22 highs. I'm watching for a potential long if price holds above $1,700 and pushes back toward the $2,000–2,200 supply zone.
---
🔍 Fundamentals Snapshot
While crypto is primarily sentiment-driven, ETH remains a core network token with strong utility, staking growth, and continued developer activity.
- Market Cap: ~$220B
- Narrative: Staking yield + DeFi backbone
- Risk: Macro pressure + Regulatory overhang
- Key On-Chain Trends: Supply contraction post-merge, L2 growth, ETH burn
---
📈 Technicals Overview
- **Trend**: Downtrend, but flattening; possible bottom structure
- **Fair Value Gap (FVG)**: Weekly FVG between ~$1,550 and ~$1,700 acting as support
- **Fibonacci**: Price reacting to the 61.8% retracement (~$1,800) from the 2020–21 run-up
- **RSI**: Near 40 on the weekly, bouncing from oversold levels
- **Moving Averages**: 8/21 EMAs compressed; momentum shift possible on crossover
- **Structure**: Possible bullish MSB (market structure break) if ETH closes above $1,900
- **Support/Resistance**:
- Support: $1,700, $1,550
- Resistance: $2,000, $2,200
---
🧠 Sentiment & Positioning
- Sentiment has been washed out post-liquidation cascade
- Open Interest flattening; some early long buildup visible
- Crypto Twitter showing cautious optimism, no euphoria (bullish)
---
Risk/Reward Snapshot
- **Entry**: On pullback toward $1,720–$1,760 or breakout above $1,900
- **Stop Loss**: Below $1,540 (weekly FVG invalidation)
- **Target 1**: $2,000
- **Target 2**: $2,200
- **R/R**: ~2.5 to 3.0 depending on entry
- **Position Size**: Scaled in across FVG zone with tighter risk at midpoint
---
📝 Final Thoughts
ETH is at a potential turning point structurally. The weekly FVG, Fib retracement, and improving RSI suggest a favorable risk/reward for swing longs. A confirmed weekly close above $1,900 would increase confidence in a trend reversal. Watching for confirmation via volume expansion and follow-through candles.
---

HolderStat | What second top ETH holder do?He HOLD his position 7.02 ETH ~ 12 790 USD.
He know how to hold ETH/USDT for profit 😎
🧠This dude makes money by buying near a bottom and waiting for signs of a decline.
Statistic:
📥Invested($): 649
📈Profit ($): 41 820
💹Profit (%): 6448

ETH USDT PositionETHUSDT long opened — Margin: $835 | Leverage: 55x. Targeting breakout continuation above key resistance zone

Ethereum Technical OutlookEthereum remains in its overall downtrend 📉; however, the recent sharp upward move shows early bullish signals 🟢.
The highlighted supply zone in red ($1994–$2012) could serve as a strong resistance area, potentially triggering a pullback.
Additionally, the daily flip level (marked in green) may also act as a barrier, pushing price lower.
Despite the bearish setup around these zones, we do not anticipate a deeper correction for ETH.
Any pullback is expected to be limited to the $1760 level, after which a bullish continuation and a potential breakout of the descending trendline are anticipated.

ETHUSDT Critical Rejection Zone | Bearish Outlook Towards 1672Ethereum (ETHUSDT) H4 Analysis: Bearish Outlook from Critical Resistance Zone
Overview:
Ethereum (ETH) is currently navigating a key resistance area between $1,788 and $1,814 on the 4-hour (H4) timeframe. After a strong bullish rally, the price action shows signs of exhaustion, suggesting a potential bearish reversal is developing.
Technical Analysis:
Critical Zone: The range of $1,788–$1,814 has emerged as a strong resistance. ETH has repeatedly tested this area without a decisive breakout, highlighting seller dominance.
Structure Break: The price has broken down from an ascending wedge/parallel channel structure, which typically signals a shift in momentum from bullish to bearish.
Moving Averages: ETH has recently fallen below the 50 EMA (orange line) and is now approaching the 200 EMA (green line). A sustained move below the 200 EMA would reinforce the bearish outlook.
RSI: The Relative Strength Index (RSI) is neutral around 50 but slightly tilting towards bearish territory. It indicates weakening buying pressure and a potential move towards oversold conditions if selling accelerates.
Volume Profile: The volume during recent pullbacks is higher than during bullish pushes, reflecting an increase in selling activity and reinforcing the probability of further downside.
Bearish Scenario:
As long as ETH remains below the $1,788–$1,814 zone, the broader expectation leans towards a bearish continuation. The next major areas of interest lie around $1,672 — a previous support and reaction level — and further down at $1,588, which aligns with a strong historical demand zone.
Conclusion:
ETH is at a decisive point. Failure to reclaim the $1,788–$1,814 resistance zone could pave the way for a larger bearish move in the coming sessions. Traders and investors should closely monitor price behavior around the 200 EMA and key support levels to assess the continuation potential.
#ETH #Ethereum #ETHUSDT #CryptoTrading #TechnicalAnalysis #BearishSetup #CryptoAnalysis #PriceAction #TradingView

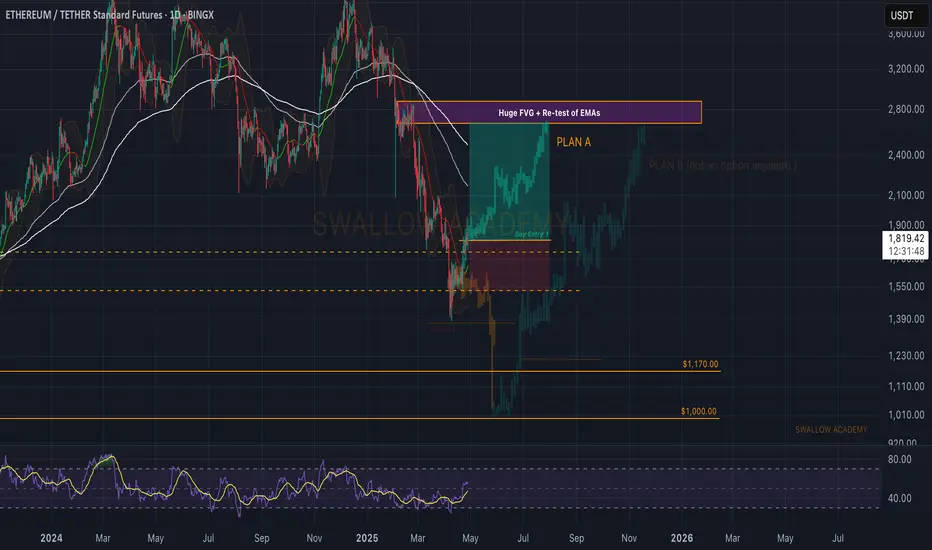
Ethereum (ETH): Plan A playing Out Well / Possible 50% MovementEthereum has established a strong supportive zone where buyers have formed a nice MSB on smaller timeframes and now are breaking breakingthe structure step by step.
This kind of movement seems like a pretty good start for a possible movement that we are looking for, which would fill the big FVGs that price has left on upper zones and the retest of EMAs, which are MUST-HAVE if we want to see any kind of proper movement in the future without choppy moves like we have been having lately.
So, we are aiming to see a good upward movement from now on....
Swallow Academy
Ethereum price increaseThe influx of liquidity and increased demand for Ethereum has caused the price of Ethereum to increase in various technical analysis models. In previous analyses, I had identified the Ethereum price resistance area, according to which the price increased at the specified time, and for a short-term weekly or daily target, we can consider a price of $2,000 per Ethereum unit, but it should be taken into account that this increase is likely to ultimately cause a new price record for this currency in the crypto market.
Sasha Charkhchian

Ethereum: The biggest Opportunity in 2025!Ethereum is following Bitcoin—but with way worse performance. While BTC is still holding up relatively well, ETH has dropped all the way back to March 2023 levels, wiping out the entire rally. Since its top, Ethereum is down over 63%. 😮💨
Still—or maybe because of that—I’m beginning to slowly scale into spot positions here.
Yes, we could fall further. I’ve got limit orders set lower, specifically around $1,260, which aligns with the 88.2% Fibonacci retracement and the midpoint of the monthly order block. That’s a key zone I’ll be watching if price keeps dropping.
That said, this Wave (2) should be nearing its final stage. The sell-off has been steep, and if we lose $804, that would flip Ethereum’s entire monthly structure bearish—a scenario I’d consider extremely negative.
I don’t expect ETH to suddenly blast past $5,000 from here, but at these levels, I see a clear opportunity to build longer-term spot exposure—and that’s exactly what I’m starting to do now.

ETH / USDT supporting chart for the BTC pairNow this isnt meant to be a prediction of any kind, rather a supporting chart to the BTC pair i posted already. This is typically how these bottoms would unfold in the case of a broadening bottom, or inverted head and shoulders.
Looking for support above 1754, to reclaim this range, however it doesnt have to come back that far, and i wouldnt want to see it fall back into that deviation zone under1685.
The idea being, the breakdown lower got rejected, and traders are looking for confirmation of support, back inside of the range. If thats achieved, we're going to look for the range high, and the partial decline typically, which is your last sign of strength before the mark up phase.
None of this HAS to happen, just merely larping what ive seen in previous bottoms, including BTCs bear. If we see a change in character here, or a partial rise, with the inability to retest the range high / neckline, then of course, i will restrategize.

ETH Short - Sweep of 12 H HighsETH Short was planned 5 days prior to when it got triggered, main idea is a sweep of the 12 H highs, and a continuation of the bear trend on higher time frames.
We got the sweep, now we wait for the setup to play out.
Ethereum Up 30% — But Is This the Start of a Trend Reversal..?Ethereum Up 30% — But Is This the Start of a Trend Reversal..?
Ethereum has seen a notable bounce this month, climbing approximately 30% from its local bottom of $1,400 to its current level around $1,800. While this rally might appear promising at first glance, a deeper look at the daily timeframe reveals a more cautious picture.
Despite the recent price surge, Ethereum remains technically in a **downtrend**. A well-respected downtrend continues to hold as resistance, and ETH is currently **retesting this trendline**. This point of contact now sets the stage for two potential scenarios:
**Scenario 1: Rejection from the Trendline**
If Ethereum fails to break above the trendline, it’s likely to face **rejection**, which could send the price back toward the $1,400 level. A revisit to this support zone would form a **potential double bottom**, a classic reversal pattern. If that plays out, we could then start to look for signs of a genuine trend reversal.
**Scenario 2: Breakout Above the Trendline**
On the other hand, if ETH manages to **break through the trendline**, that alone shouldn't be a green light to go long just yet. There’s a significant resistance level sitting around **$2,100**, which has previously acted as a ceiling for price action. A true breakout would require Ethereum not only to cross this level but also to **sustain above it for 2–3 days**. Only then could a long position be considered relatively safer, with upside targets extending to **$2,800** and even **$4,000**.
**Final Thoughts**
While the recent rally is encouraging, it's essential to remain cautious. The downtrend isn't officially over until key technical levels are cleared and held. Until Ethereum breaks above both the downtrend and the $2,100 resistance zone — and proves its strength with sustained movement — the **best strategy may be to sit on the sidelines** and let the market play out.
Patience often pays in crypto — and right now, **watching closely** could be the smartest move.

Long trade
ETHUSDT Buyside Trade – Full Journal
Date/Time: Saturday, 25th April 2025, 7:55 AM NY Time
Pair: ETHUSDT
Session: London AM
Entry TF: 5min
🔹 Entry: 1789.52
🔹 Take Profit: 1826.93 (+2.88%)
🔹 Stop Loss: 1775.30 (–0.42%)
🔹 Risk-Reward Ratio: 5.40
Trade Reasoning
Price showed bullish structure with higher lows forming leading into the London open.

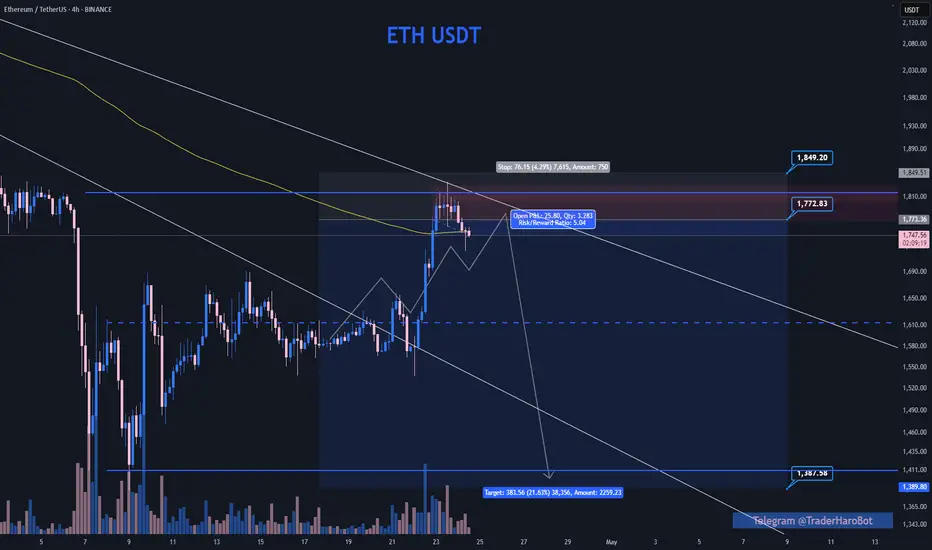
Long trade
Trade Overview: ETHUSD – Long Position
Entry Price: 1778.55
Take Profit (TP1): 1808.63 (+1.68%)
Stop Loss: 1774.44 (–0.23%)
Risk-Reward Ratio (RR): 7.52
🕖 Entry Time: 7:45 AM (New York Time)
📅 Date: Saturday, 26th April 2025
🌍 Session: NY AM
🧭 Entry Timeframe: 1-Hour TF (focused on FVG)
Reasoning Narrative
ETHUSD showed clear bullish intent on the 1-hour timeframe, with price forming a series of higher highs and lows. Leading into the entry, the market had recently filled a fair value gap (FVG) left behind from the prior bullish expansion, signalling a potential continuation setup.
5min TF Overview

$ETH Breakout – High Probability Move Ethereum has been in a downtrend since December 16, showing consistent lower levels. However, we’re now seeing a confirmed breakout above the trendline, which signals a strong potential reversal.
This breakout suggests a high-probability move to the upside, with price targeting the $4,000 level in the coming period.
Keep watching — the momentum is building.
Follow me for updates and analysis as the setup plays out. BYBIT:ETHUSDT.P

Ethereum Eyes Bullish Momentum After Resistance BreakoutUpon a confirmed breakout above the resistance line, Ethereum will be well-positioned for a potential bullish move.

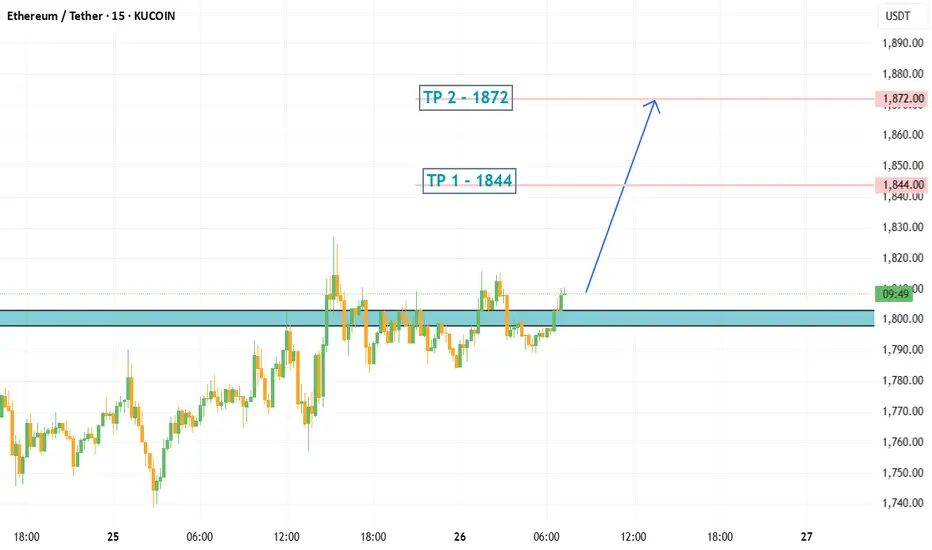
ETH/USDT LONG IDEAPosition opening range 1798~1803 USDT in batches
Total Position Recommendation Within 5% of total funds (or 1~2% of total account loss)
Stop Loss 1784 USDT, liquidate the position when triggered.
Take Profit First Target 1844, Second Target 1872
Cooling-off rule: 24 hours cooling-off after stop loss
Prohibition Prohibition of chasing high, prohibit the increase of positions, prohibit continuous trading