$ETHUSDT - Major Breakout Alert! CRYPTOCAP:ETH has officially broken out of a long-standing descending parallel channel on the daily chart — a key structural shift in market sentiment. This breakout is further supported by a successful close above the 50 EMA, which had acted as dynamic resistance throughout the downtrend.
Key Technical Developments:
- Broke out of a descending parallel channel
- Closed above 50 EMA for the first time in weeks
- Strong daily candle with 8% gain confirms momentum shift
Immediate Support: $1,790 (former resistance zone turned support)
Next Major Resistance: $2,393
This is the mid-zone before ETH challenges the broader supply area around $2,550–2,850.
This breakout mirrors Ethereum's typical behavior during previous cycle expansions — grinding accumulation followed by aggressive breakout moves. The confluence of the EMA breakout and channel structure suggests we could be looking at the beginning of a broader trend reversal.
Trading Plan:
Retests towards $1,850–$1,790 can offer high R:R entries.
Watch for continuation patterns or consolidation above $2,000 for the next push.
CRYPTOCAP:ETH is reclaiming momentum — if BTC remains stable, this move could expand quickly.
If you find this analysis helpful, please hit the like button to support my content! Share your thoughts in the comments, and feel free to request any specific chart analysis you’d like to see.
ETHUSDT.PS trade ideas

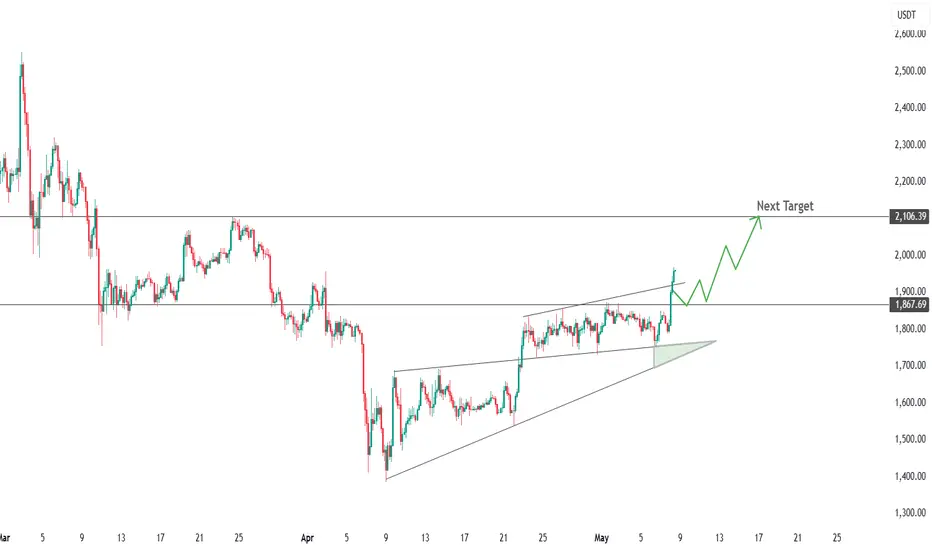
Broke the resistance levelCRYPTOCAP:ETH - wedge broken, target 2,100 USDT
After a three-week contraction, the price broke above the upper boundary of the ascending wedge and the 1,870 USDT horizontal, confirming a change of momentum in favor of the bulls.
📌 Levels
- S1 1 870 USDT - top of the wedge, retest zone
- S2 1,800-1,820 USDT - base of the formation
- R1 1 900-1 920 USDT - local obstacle near trend lines
- R2 2,106 USDT - calculated wedge height target and March supply area
📈 Scenario
Holding S1 opens the way to R1; a consolidation above 1,920 activates the march to 2,100 USDT. A run-up to 2,200 is not ruled out with strong volume.
⚠️ Risks
A failure ⇩ 1,870 would indicate a false breakout; a move below 1,800 would bring the price back to the wedge and increase the chance of a test of 1,740.
ETH TO OUTPERFORM?Ethereum printed a textbook bullish reversal candle on the monthly chart - a strong signal that buyers may finally be stepping in with conviction. After a prolonged downtrend and a brutal April close below the 50-month moving average, this kind of recovery is exactly what bulls were hoping for.
The candle itself is notable: a long lower wick and a solid body closing near the highs of the month, which indicates strong demand at lower prices and rejection of further downside. This type of price action at support often marks a key inflection point in market structure.
It’s still early in the month, but this bounce from the ~$1,600 zone, paired with the potential reclaim of the 50-month moving average, could set the stage for a sustained move higher - especially if macro tailwinds return or sentiment improves across the broader market.
Momentum has been weak for months, and ETH has severely underperformed BTC. But reversals don’t start with euphoria - they begin when few are paying attention, and this chart is quietly showing signs of life.

Ethereum (ETH): Strong Breakout From EMAs | Buyers DominatingA strong breakout happened on Ethereum, where we broke out from the local resistance zone on smaller timeframes and now we also have a very strong bounce from EMAs.
This might be the start of Ethereum's bull run, where most of the money inflow will now be into this one. We have 2 possible moves here where ideally we would need a smaller correction to secure that lower breakout zone so we are looking mainly for this area there.
As long as we are above that area, we will be looking for a bullish outcome (despite the fact that yesterday we had one short position on ETH).
Swallow Academy


ETHUSDT should be at the bottom for this cycle
I believe the price of ETH at the current zone is among the lowest and it should be the bottom for this cycle. DR1 structure is prominent here. (Mind you its on the monthly TF!!!! :D)
Can buy ETH now! But for me I prefer to trade - will TP around 23XX - 2400
I will not trade crypto on other coins for now.

ETH/USDT Trading Alert – May 6, 2025, 18:30 UTCKey Signals
Trend: Downtrend (4H chart) showing potential reversal signs.
RSI: 29 (Oversold) → Higher rebound probability.
MACD: Bullish crossover forming near zero line.
Critical Level: Resistance breakout at $1,781.77.
Action Plan
✅ Entry: $1,780.00
✋ Stop-Loss: $1,765.00 (0.8% risk)
🎯 Take-Profit:
TP1: $1,800.00 (1.1% gain)
TP2: $1,820.00 (2.2% gain)
Why Now?
Oversold Bounce: RSI divergence suggests selling exhaustion.
Volume Spike: 18% increase in buy orders at $1,775 support.
Macro Context: ETH futures open interest rising ahead of ETF decision.
Risk Warning
⚠️ Upcoming US CPI data (May 8) may increase volatility. Hedge with 2% portfolio max exposure.
Tools Used: TradingView (Bitget data) + AI pattern detection.

ETH 2025.05.06🔔 Follow SEOVEREIGN to get real-time alerts.
🚀 Your boosts empower SEOVEREIGN to analyze more assets.
📊 Our team regularly publishes detailed crypto market analysis reports.
📊 Ethereum (ETH) Technical Analysis Report
Date: May 5, 2025
■ Summary
Ethereum is currently in a corrective phase, but the broader outlook suggests a continuation of the mid-to-long-term uptrend. Based on wave analysis, the market appears to be in the midst of a Z wave, indicating that a rebound could follow the current short-term pullback.
■ Technical Analysis
The formation of the Z wave suggests we are in the final leg of a complex correction.
Notably, the Y wave has extended to 1.272 times the length of the W wave, which aligns with typical conditions for a technical rebound.
As a result, we may see some short-term downward pressure, but the overall structure still points to a likely upside move in the coming sessions.
■ Target Levels
Target 1: 1,746
Target 2: 1,706
⚠️ Note: Prices are subject to market conditions. Always use proper stop-loss and risk management strategies.

HolderStat | preparing for the May saleThis smart trader withdrew 2.965 CRYPTOCAP:ETH ~$4.9K to Crypto.com—proof this trader is primed to load up on alts. With a lifetime 1832% return over 9 trades this fresh deposit signals full force into the next altcoin rally 🌟

[LONG] ETHUSDT | ETG Going Up Follow BTC?Welcome,
- Status: 📈 Long
- TP & SL On Chart
Keep wait..
Lets see..

Eth to dump back down to 1795Eth short . target $1795 . Not the best setup but still seems quite probable.
Stop: $1842.2
Target: $1795.00 full exit

Did you succeed in climbing Ethereum?Ethereum announced its 3200 decline and went until 1350! lol to lol
Now it's time back
1850/1900 is the resistance that can be rejected and maintained, it is easy to cross and maintain its 2200 and 3000 targets for the next 3 months.
Unless the downward trend is so that we don't get better, it's still early.

Complete Analysis and Unified Trading Signal for ETH/USDT Across
1. Main Trend:
30-Minute Chart: Shows a bullish trend with recent upward movements, indicating strong buying pressure.
1-Hour Chart: This timeframe also indicates a bullish trend, although it shows some signs of consolidation as the price oscillates near resistance levels.
4-Hour Chart: The longer timeframe reflects a slightly bullish trend but suggests potential exhaustion as price approaches key resistance.
2. Key Levels:
Support Levels:
1,800.00 USDT (strong historical support across all timeframes).
Resistance Levels:
1,841.31 USDT (near-term resistance visible in the 1-hour and 4-hour charts).
1,850.00 USDT (major resistance level to watch for breakout potential).
3. Technical Indicators:
MACD:
Positive divergence across timeframes suggesting bullish momentum, particularly strong on the 30-minute and 1-hour charts.
RSI:
30-Minute: Around 62 (indicating bullish momentum but nearing overbought).
1-Hour: Approximately 55, suggesting neutral to slight bullish sentiment.
4-Hour: Around 55.41, confirming that the market is not overbought yet.
Bollinger Bands:
Currently, price is near the upper band on the 30-minute chart, indicating potential overbought conditions but with room for further moves.
4. Risk/Opportunity:
Asset: ETH/USDT
Direction: Long
Entry: 1,835.00 USDT (entering at the current price level with bullish indicators).
Stop-loss: 1,800.00 USDT (setting the stop-loss just below the strong support to manage risk effectively).
Take-profit:
1,841.31 USDT (first target at resistance level).
1,850.00 USDT (second target if momentum continues upward).
Confidence: Medium (the bullish signals across multiple timeframes provide a reasonable basis for entering a long position, but caution is advised due to proximity to resistance levels).
5. Additional Notes:
Market Volatility: The analysis indicates that the ETH market is experiencing fluctuations, with notable spikes and retracements, suggesting traders should monitor for any rapid changes.
Conclusion: A careful approach is warranted, as the bullish sentiment may face challenges at key resistance levels. Traders should consider these dynamics when planning their trades.
This comprehensive evaluation synthesizes insights from multiple timeframes to provide a unified trading signal for ETH/USDT, assisting traders in making informed decisions based on current market conditions.

Analysis of the Financial Chart for ETH/USDT
1. Main Trend:
The primary trend of the chart indicates a bullish trend. The predominance of green candlesticks suggests that recent price movements have favored buyers. This is supported by the current price of 1,838.46 USDT, which is above the moving averages.
2. Key Levels:
Support: A significant support level is at 1,820.00 USDT, which could act as a barrier if the price were to decline.
Resistance: Resistance is observed at 1,850.00 USDT, and a breakout above this level could signal a continuation of the bullish trend.
Breakout/Breakdown: The highlighted areas in blue and red on the chart indicate periods of consolidation and volatility, suggesting potential trading opportunities at breakout points.
3. Technical Indicators:
MACD: The MACD bars indicate positive momentum, suggesting that the market currently has an upward push.
RSI: With a value of 60, the RSI shows that the market is near overbought territory but has not yet reached it, indicating there may still be room for further gains.
Moving Averages: The short-term moving average (blue line) is above the long-term moving average (green line), confirming the bullish trend.
4. Risk/Opportunity:
Asset: ETH/USDT
Direction: Long
Entry: 1,840.00 USDT (suggested as an entry point, ideally above the resistance level).
Stop-loss: 1,820.00 USDT (below support to protect against unfavorable movements).
Take-profit: 1,860.00 USDT (first profit target, aligned with the next resistance).
Confidence: Medium (given the current strength of the bullish trend and favorable technical indicators).
Additional Notes: Recent price movements show some volatility, so it is important to monitor trading signals closely. Any macroeconomic news or developments in the cryptocurrency market could further influence sentiment.
This analysis provides a clear view of the current situation for ETH/USDT, helping traders make informed decisions based on technical indicators and key price levels.

Liquidity zonePlease note, there is no collected liquidity here. Technically we cannot go higher yet. Everything is relevant.

ETH-----Sell around 1838, target 1750 areaTechnical analysis of ETH contract on May 2: Today, the large-cycle daily level closed with a medium-yang line yesterday, and the K-line pattern was single-yin and single-yang. The price is still consolidating at a high level. The attached indicator is running in a golden cross. The high pressure is in the 1885 area, and the low support is in the 1720 area. This is the current high and low point of the range. In addition, the trend over the weekend is likely to be mainly corrected, so try not to hold positions until the weekend for today's trading; the short-cycle hourly chart shows that the European session rose and corrected the day before, and the US session continued to break the previous high position. The current K-line pattern is continuous and negative, and the attached indicator is running in a dead cross. The trend is likely to fall during the day.
Therefore, today's ETH short-term contract trading strategy: sell at the current price of 1838, stop loss in the 1858 area, and target the 1750 area;

Financial Chart Analysis of ETH/USDTFinancial Chart Analysis of ETH/USDT
Primary Trend:
Upon examining the chart for the ETH/USDT perpetual contract on the Bitget exchange, we observe that the primary trend is sideways. Despite periods of volatility, the current price of 1,830.00 USDT reflects oscillations without a clear dominant direction, as indicated by alternating blue and red areas representing varying market conditions.
Key Levels:
Support: A significant support level lies at 1,820.00. Holding above this level is critical to avoid a potential breakdown.
Resistance: Resistance is evident at 1,837.67. A breakout above this level could signal a resumption of the bullish trend.
Breakout/Breakdown: Triangular markers on the chart highlight critical thresholds. A breakout may occur if price surpasses resistance, while a breakdown could follow if support is breached.
Technical Indicators:
MACD: The MACD displays green and red bars, suggesting neutral momentum with no clear buy or sell signals.
RSI: At 48.03, the RSI indicates a neutral market, neither oversold nor overbought, aligning with the sideways trend.
Moving Averages: Short- and long-term moving averages (blue and red lines) show potential for a crossover but currently lack definitive directional bias.
Risk/Reward Assessment:
Asset: ETH/USDT
Direction: Neutral (due to the absence of a clear trend)
Entry: 1,820.00 (suggested entry if price breaks support in a short scenario)
Stop-loss: 1,840.00 (placed above resistance to limit losses in case of upward movement)
Take-profit: 1,800.00 (initial profit target, aligned with identified support)
Confidence: Moderate (given the sideways trend and ambiguous technical signals)
Additional Notes:
Bollinger Bands suggest the price is testing the lower band, hinting at a potential rebound opportunity. However, recent volatility, as highlighted in the chart, warrants close monitoring.
This analysis provides a clear snapshot of Ethereum’s current standing against USDT, with recommendations grounded in technical signals and key levels. Always consider macroeconomic factors that may further impact the market.

ETH 2000$📈 CRYPTOCAP:ETH Analysis – May 2, 2025
Ethereum is forming a bullish ascending triangle and reacting to the key resistance at 1812, possibly preparing for a breakout.
🔹 Resistances:
1812 USDT 🔼
1910 USDT 🎯
2000 USDT 🎯
🔹 Supports:
1728 USDT 🛡️
1680 USDT ⚠️
1484 USDT ⚠️

ETHUSDT LONG ETHUSDT
LONG opportunity
Ethereum is the most undervalued asset right now us we can prove that on weekly RSI and stochastics.
The 4HR chart looks good to buy in short time period. As it is shown in the chart price has been bounced 3 time from the 200 EMA which acts as support and consolidating sideways once we break out of the 1856.98 price zone, we may probably hit the 2000$ dollar mark. let me know what you think


Buy ETH for Mid-Term GainsBuy ETH for Mid-Term Gains: High Potential at a Discounted Price
Hey everyone, it's Tradevietstock again!
The market is currently in an extreme fear state according to CNN Fear and Greed Index, which often signals a potential historical bottom across major trading assets, including the S&P 500 and Bitcoin, or even ETH.
Although the market has moved out of the Extreme Fear zone, the recovery is still modest and recent — which means there's still time to position yourself! If you still hesitate, you'll probably miss the chance.
Signals that we need to confirm a bull run:
There was a pretty flat and boring market for ETH in October 2023 —
yet shortly after, a bullish breakout occurred, triggering a strong upward move and marking the start of a new bull run.
After the signal appeared, ETH doubled!
Ethereum (ETH) has been trading at a significant discount since late 2024—down more than 66% from previous highs. According to the Quantum Flux indicator, ETH has officially exited its bear market phase, as evidenced by multiple buy signals (including green dots and crosses). This marks the conclusion of Phase 1: the Bear Market. For investors, this presents a rare opportunity to buy ETH at one of the most heavily discounted levels seen in recent history.
After experiencing an 80% correction in 2022, ETH has since shown several key signals—signals similar to what we're watching for right now.
After the biggest fall by 80% in 2022, ETH had some significant signals, which will be what we are waiting for right now.
First, the Quantum Flux Indicator has shown multiple buy signals (green dots and crosses) right at the very end of Phase 1 (the bear market). This suggests that ETH is in a historical bottom zone.
Second, we’ve observed bullish breakouts—decisive price movements that confirm a reversal of the recent downtrend.
➡️ This combination of signals is exactly what we typically expect to see before a major bull run in ETH. As of now, we've received the first wave of signals from Quantum Flux.
My signals:
Position: BUY
Price zone: 1290-1700
Target: 4000
Please prioritize your risk management. No one can survive in this market and come to the victory in a long run without risk management.


ETHUSD NEXT MOVE?etherium currently trading at 1800 around and we are looking for buy here and target are 2042
