ETHUSDT.PS trade ideas

ETHUSD NEXT MOVE?etherium currently trading at 1800 around and we are looking for buy here and target are 2042

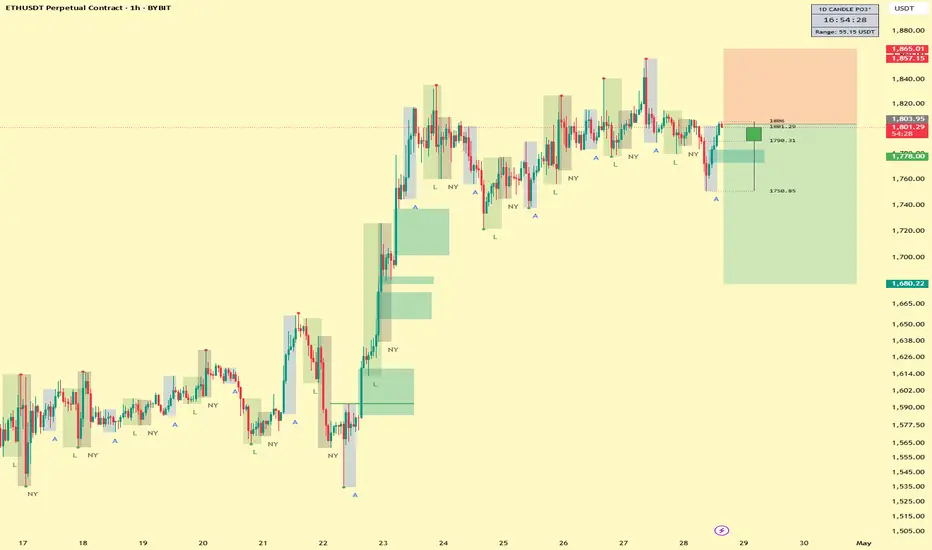
ETH/USDT 1H: Bearish Structure with Potential Bounce ETH/USDT 1H: Bearish Structure with Potential Bounce – Long Setup from Discount Zone
🚀 Follow me on TradingView if you respect our charts! 📈 Daily updates!
Current Market Conditions (Confidence Level: 8/10):
Price at $1,796.97, currently bearish after breaking equilibrium zone.
Hidden bearish divergence visible on RSI, suggesting weakening bullish pressure.
Smart Money likely accumulating positions in the $1,740 – $1,760 discount zone.
Trade Setup (Long Bias):
Entry: Optimal between $1,795 – $1,805 range.
Targets:
T1: $1,840
T2: $1,860
Stop Loss: $1,765 (below recent low).
Risk Score:
8/10 – Smart Money accumulation supports the setup, but confirmation bounce from support is crucial for entry.
Key Observations:
Resistance at $1,820 (previous high) acting as local cap.
Support solid at $1,760 (discount zone), strong reaction expected.
Premium zone between $1,840 – $1,860 ideal for scaling out profits.
Smart Money potentially setting up shorts from premium zone for later liquidity grab below $1,740.
Recommendation:
Wait for clear confirmation of support hold before entering longs.
Manage risk carefully; consider partial scaling at $1,840 and securing full profits at $1,860.
Monitor price action at $1,820 resistance for possible early signs of rejection.
🚀 Follow me on TradingView if you respect our charts! 📈 Daily updates!

Ethereum Critical Resistance| Price Action| Macro Trend Ethereum is trading at a major resistance zone aligned with the 0.618 Fibonacci, VWAP SR, and a strong daily horizontal level. Despite the recent impulsive move, multiple daily candles have failed to close above this resistance, highlighting underlying weakness.
Key support is situated around $1,055, a high-timeframe level critical for establishing a higher low. If Ethereum fails to hold this region on a retest, it risks breaking the swing low and extending the macro downtrend of lower highs and lower lows on the daily timeframe.
At this stage, a rejection from the current resistance would likely lead to continued bearish momentum and a push toward lower support levels. Conversely, a strong support hold at $1,055 followed by a breakout above resistance would be needed to signal a potential shift in structure and early signs of strength.
Price action remains at a decisive juncture: rejection favors bearish continuation, while a higher low backed by volume could flip the trend bullish in the coming sessions.

ETH 2025.04.29***Follow SEOVEREIGN to receive real-time alerts.
**Boosts empower SEOVEREIGN to expand coverage and deliver more analyses across a wider range of assets.
**Our team regularly publishes in-depth reports on the cryptocurrency market.
We are officially announcing a shift from the long (buy) perspective we have consistently maintained up until the 22nd, to a short (sell) perspective in the near term. Based on a comprehensive interpretation and analysis of the current market dynamics, we believe it is time to adjust our strategic positioning.
The primary basis for this change lies in the clear emergence of a Harmonic Pattern, specifically the completion of a Butterfly Pattern, as observed on the charts.
The Butterfly Pattern is regarded as one of the most reliable reversal signals among harmonic structures, and the current market appears to have reached the critical reversal zone with near-perfect ratios.
Additionally, we are considering the potential formation of a Head and Shoulders Pattern should the downtrend gain momentum.
If the market unfolds as anticipated, this reversal could lead not merely to a minor correction, but to a deeper and more structurally significant decline.
Accordingly, for those who align with this perspective, we suggest taking the following targets into account when formulating your strategies:
1st Target: 1,734
2nd Target: 1,659
Of course, market conditions are inherently volatile and subject to change. Effective risk management and flexible responsiveness are fundamental to navigating such environments.
Reading the market goes beyond interpreting charts; it demands adaptive thinking and swift decision-making.
The market continues to move relentlessly, and opportunities will always favor those who are prepared.
We encourage each of you to approach this moment with careful analysis and bold conviction.
Wishing you wise and decisive trading ahead.

Stromm | ETHEREUM No Life Signal YETCompared to Bitcoin, Ethereum is honestly still moving at a snail’s pace — and the performance is almost embarrassing at this point.
There’s still barely any strength showing on the CRYPTOCAP:ETH chart.
Yes, ETH has finally reclaimed the Previous Monthly Low, and it’s holding it — which is a positive step.
But let’s be real:
We’re still 83% below the Yearly Open — a mind-blowing distance when you consider how BTC is behaving right now.
I'm currently risk-free on my trade here, which is a nice position to be in.
If we get another drop, I plan to add at the next Monthly Order Block.
But something serious needs to happen at the Ethereum Foundation level — real fundamental shifts — if ETH is going to deliver the kind of rally people keep hoping for.
Otherwise?
Everything else in the market is outperforming ETH by a mile — and that’s the worst-case scenario for Ethereum:
It doesn't die,
It just gets left behind.
For now, at least I’m sitting in profit, and that's a good start.
Everything beyond this will need careful watching — no blind assumptions, no blind faith.
ETH needs to prove itself — and fast.

Two Bullish Scenarios to Watch on ETHUSDTThis week, BINANCE:ETHUSDT has shown a significant upward movement, and there's a good chance it could continue its bullish momentum.
There are two bullish scenarios developing on BINANCE:ETHUSDT :
1. After a pullback, we could see an impulsive move that breaks the previous high (marked with the red arrow) and pushes the price towards the first target at 1,911 – 1,957.
2. The price could move sideways for a while, forming a bullish pennant pattern. In this case, a correction towards 1,756 – 1,731 might occur before the price resumes its move to the first target at 1,911 – 1,957.
Both scenarios remain valid as long as the price holds above 1,722.
If the second scenario plays out, the pullback to 1,756 – 1,731 can be considered a good buy zone (for those who are not in position yet).
Remember: wait for a confirmation candle before entering and place your stop-loss just below the confirmation candle.

ETHUSD SHORT 1PercentFundedTICKER: ETHUSD
ENTRY 1: 1810
ENTRY 2: 1795
SL: 1865
TP1: 1720
TP2: 1680
Trade Active
ETH USDT LONG TRADE SETUPETH is currently holding a strong support level , with a high probability of the price moving upwards. Additionally, other indicators, such as the 200 EMA, are also acting as support .

ETH Ethereum (ETH/USDT) Technical Analysis (April 29, 2025)
🔵 Trend Analysis:
Overall trend remains bearish on the daily timeframe.
ETH is trading below the Ichimoku Cloud, indicating continued downward pressure.
The price is struggling around $1,790, facing strong resistance and unable to break into bullish territory.
🌫️ Ichimoku Cloud Insight:
Kumo (Cloud) is thick and bearish ahead, suggesting strong resistance at higher levels.
Conversion Line (Tenkan-sen) and Base Line (Kijun-sen) are flat, showing a range-bound market recently.
The Lagging Span (Chikou Span) is below the price and the cloud, confirming bearish sentiment.
📏 Fibonacci Retracement Levels:
ETH is retracing after a heavy downtrend.
Key Fibonacci levels:
0.236 at ~$1,721 — already surpassed.
0.382 at ~$1,927 — acting as a next resistance.
0.5 at ~$2,093 and 0.618 at ~$2,260 — higher resistance zones.
Immediate local resistance sits near the $1,927 - $1,930 region.
🔥 Support and Resistance:
Strong range support near $1,700 is marked (labeled "Eth range support 1700" on the chart).
Resistance above at:
~$1,809 (local highs and the edge of Ichimoku Cloud).
~$1,927 (Fibonacci 0.382).
If ETH breaks below $1,700, the next major support is at $1,621 and even deeper at $1,387.
⚡ Momentum (RSI Indicator):
RSI 14 is at 54.37, slightly above neutral (50), suggesting mild bullish momentum.
RSI above 50 usually indicates buyers are gaining slight control.
RSI has risen recently, but without strong divergence from the price action, meaning strength is moderate, not explosive.
📊 Volatility:
Volatility has compressed recently (visible from smaller candlestick sizes).
Price action remains in a tight range between $1,750 and $1,810.
A breakout from this range could trigger larger moves.

Ethereum | Short | Money Flow Weakness | (April 2025)Ethereum (ETHUSDT) | Partial Profit + Watching Short Setup | Money Flow Weakness | (April 27, 2025)
1️⃣ Insight Summary:
Ethereum is showing early signs of weakness as money begins to flow out. I'm taking partial profits and carefully watching for a possible short setup if momentum continues to shift downward.
2️⃣ Trade Parameters:
Bias: Partial profit taken; preparing for possible Short
Entry Zone: Watching current levels for short entries if weakness confirms
Stop Loss: Above recent local highs (if short position is activated)
TP1: Dynamic — adjust based on structure breaks
Partial Exits: Continue trimming profits on any major liquidity grabs or breakdowns
3️⃣ Key Notes:
✅ Order flow shows clear signs of money exiting Ethereum — confirming caution is needed.
✅ My own indicators align with the outflow and loss of bullish momentum.
✅ Partial profits locked to secure gains before volatility increases.
✅ Potential for a much deeper move down exists if selling pressure accelerates.
❌ Risk if a sudden reversal trap happens — short setups must wait for full confirmation.
4️⃣ Follow-up:
I will stay flexible here and update if we get a stronger breakdown or if conditions change rapidly.
Please LIKE 👍, FOLLOW ✅, SHARE 🙌 and COMMENT ✍ if you enjoy this idea! Also share your ideas and charts in the comments section below! This is best way to keep it relevant, support us, keep the content here free and allow the idea to reach as many people as possible.
Disclaimer: This is not financial advice. Always conduct your own research. This content may include enhancements made using AI.

ETH/USDT – Rising Wedge Breakdown ConfirmedEthereum has officially broken down from the rising wedge pattern on the 1-hour chart, confirming a bearish reversal. The wedge breakdown was accompanied by a clear bearish divergence between price and RSI, where price made higher highs but RSI formed lower highs — a strong early warning of weakening bullish momentum. 🔻
The price action has now closed below the wedge support line, signaling potential continuation to the downside.
🔹 Current Outlook:
Breakdown has been confirmed with a bearish candle close below support.
RSI is turning down, suggesting more room for further downside movement.
Immediate minor support zones are near $1780 and $1750.
Bigger target lies around $1690 based on the measured move of the wedge.
🔹 Trade Management:
✅ If you are already short from the wedge break,
managing the trade with stop-loss above $1850 would be reasonable.\
✅ First take-profit levels: $1750, then $1690 for extended targets.
📌 Note: Watch for retest scenarios — price might come back toward the broken wedge support (~$1800–$1810) before continuing the drop ("kiss of death" retest pattern).

ETH ShortLast night got a distribution model 1 on ETH confirmed with a BOS on the 15 min. Technical target is the range low, but since we are above a 15 day range this could evolve into a PO3 which would bring ETH to new lows. I would love to see BTC's distibution model and USDT's accumulation model to confirm for more validation. Invalidation for ETH is above the recent high.

ETH SHORT SETUP ALL trading ideas have entry point + stop loss + take profit + Risk level.
hello Traders, here is the full analysis for this pair, let me know in the comment section below if you have any questions, the entry will be taken only if all rules of the strategies will be satisfied. I suggest you keep this pair on your watchlist and see if the rules of your strategy are satisfied. Please also refer to the Important Risk Notice linked below.
Disclaimer
ETH SHORT TRADE SETUP
ENTRY : 1949.24
PROFIT : 1725.06
STOP : 2020.31

ETH TO THE MOON TRADEETHUSDT Weekly Analysis | 3M & 12M Supply/Demand Zones
Currently, Ethereum (ETHUSDT) is trading around $1803, sitting close to major higher timeframe zones:
3-Month Supply/Demand Zone: ~$1691
12-Month Supply/Demand Zone: ~$1557
Price has reacted strongly near the 3M S/D zone after a multi-month decline. Holding above this zone could indicate a potential bottom formation.
Reminder:
This is not financial advice. Always do your own research and trade with proper risk management.

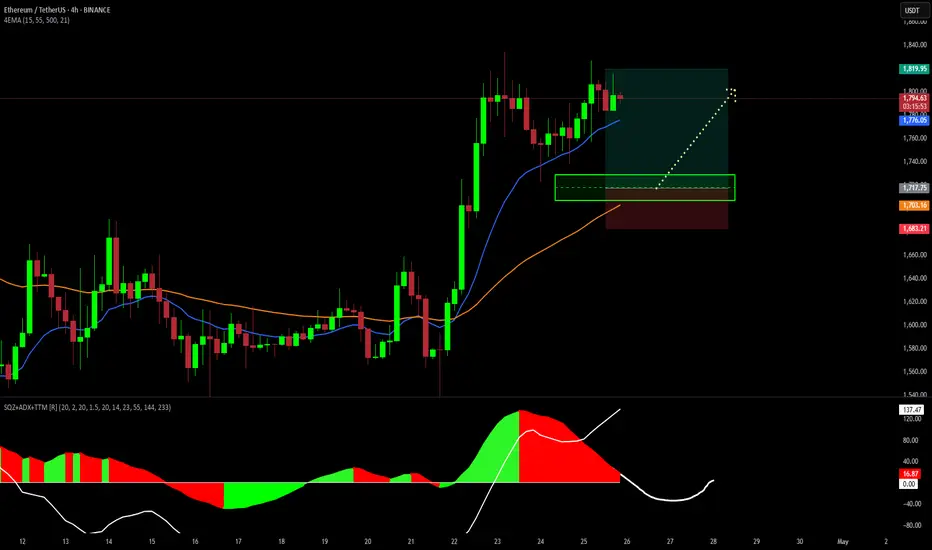
trading ETH/USD FUTURES, 4H.The price of ETH has consumed the bearish time of the SQZ indicator and has made a range above the two moving averages, which gives us a sign of strength in buyers, for the day a bullish pattern will possibly be in place and possibly the best buying zone will be between $1730 to $1700 dollars.
"ETH Breakout Watch: Holding Support for a Push Toward $1900+"ETH 4H chart par price apne key support (purple box) ke upar consolidate kar raha hai. Jab tak yeh support hold karta hai, $1900 - $1920 ka target active rahega.
Agar support toot jata hai to next major demand zone 1660-1680 ke aas paas hai. Tab tak structure bullish hai.
Trading plan simple hai:
✅ Support hold = Buy dips for $1900+
❌ Support breakdown = Wait for lower entries.
Chart clear path dikhata hai, risk manage karte raho! 🚀

ETH Underperformance relative to BTCWhile CRYPTOCAP:BTC is back at its February highs, CRYPTOCAP:ETH is still battling to break above its early April peak.
IF CRYPTOCAP:BTC keeps pushing, CRYPTOCAP:ETH will most likely follow on it's USDT pair.
IF CRYPTOCAP:BTC rejects and goes lower, CRYPTOCAP:ETH will most likely go to the local lows or create new lows.

Ethereum (ETH): Possible Zone of Rejection | Waiting For MSDWe are waiting for further market structure development in order to get the confirmation on upcoming downward movement, which we are looking for currently.
After the fill of bullish CME, we had a nice rejection and first signs of weakness, which might turn into a bigger rejection from our golden zone.
As soon as we see a proper MSB form below that zone, we are going to look for downward movement from there!
Swallow Academy

ETH SCENARIOS - LONG/SHORTThat's what I'm looking at in the near future.
Just some ideas :)
Crypto Introduction
Ethereum is a decentralized platform that runs smart contracts: applications that run exactly as programmed without any possibility of downtime, censorship, fraud or third party interference.
Will book 50% of short at 1:1RR (if given) to make it risk free.
Raw R:R is over 8 so there is room to play with.


ETH-----Sell around 1770, target 1700 areaTechnical analysis of ETH contract on April 24: Today, the large-cycle daily level closed with a small positive line yesterday, the K-line pattern continued to rise, the price was at a high level, and the attached indicator was running in a golden cross. The general trend of rising is relatively obvious, but there are two points we should pay attention to. First: After the current four-hour chart is under pressure, the K-line pattern is continuous and negative, the price is below the moving average, and the fast and slow lines of the attached indicator have signs of sticking and dead cross; Second: Yesterday's high did not continue, so a retracement and decline within the day is a high probability event; the short-cycle hourly chart did not continue to break upward after yesterday's price continued to fluctuate at a high level. Today, it began to retreat under pressure. The current price is below the moving average, and the attached indicator is running in a dead cross, so let's take a look at the strength of the decline within the day.
Today's ETH short-term contract trading strategy: Sell directly at the current price of 1770 area, stop loss in the 1800 area, and target the 1700 area;
