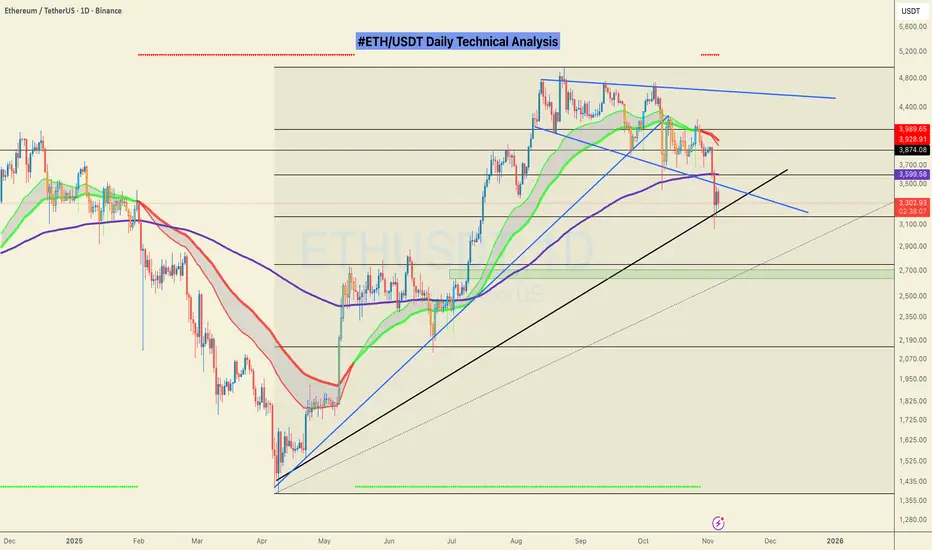
ETH Daily: Tracking S&D Reaction and the Deeper QML SetupHi!
Price is currently pulling back toward a key Supply & Demand zone, where a short-term bullish reaction is still possible. This level acted as resistance previously and now lines up as a logical retest area after the recent drop.
However, the broader structure suggests that even if we do see a
Related pairs

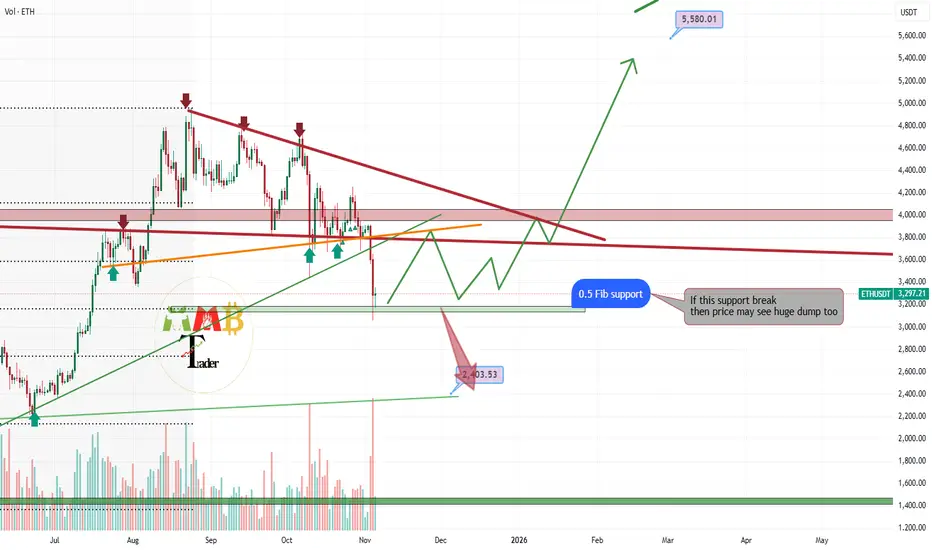
ETHUSDT is testing major Fibonacci support level now As the chart illustrates, ETHUSDT has completed a significant correction and is now testing a crucial technical level: the 50% retracement level of the Fibonacci sequence. This level often acts as a dynamic support zone in a strong trend.
A confirmed bullish rejection at this 0.5 Fibonacci support,
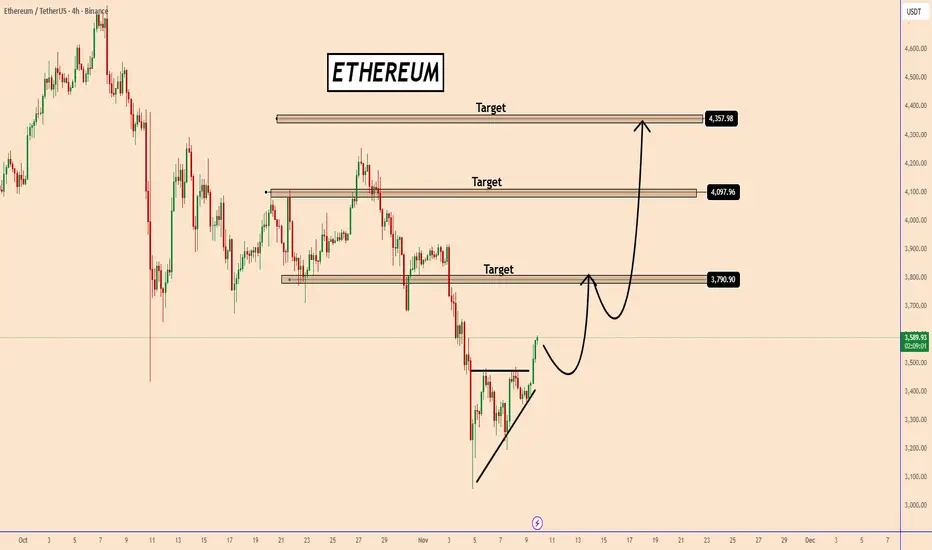
Ethereum Poised for a Bullish ReversalEthereum Poised for a Bullish Reversal
Ethereum has been consolidating in an ascending triangle pattern after a strong bearish move, showing signs of a potential bullish breakout. The price is currently pushing higher from the recent lows, indicating that buyers are slowly regaining control.
If m
Ethereum Bulls Defending $3,500 Zone – Time to Rise?Today, I want to walk you through a quick 15-minute timeframe analysis of Ethereum ( BINANCE:ETHUSDT ), so stick around.
Right now, Ethereum is hovering near a Support zone($3,520-$3,348) and a Cumulative Long Liquidation Leverage($3,507-$3,460) .
From an Elliott Wave standpoint, it seems

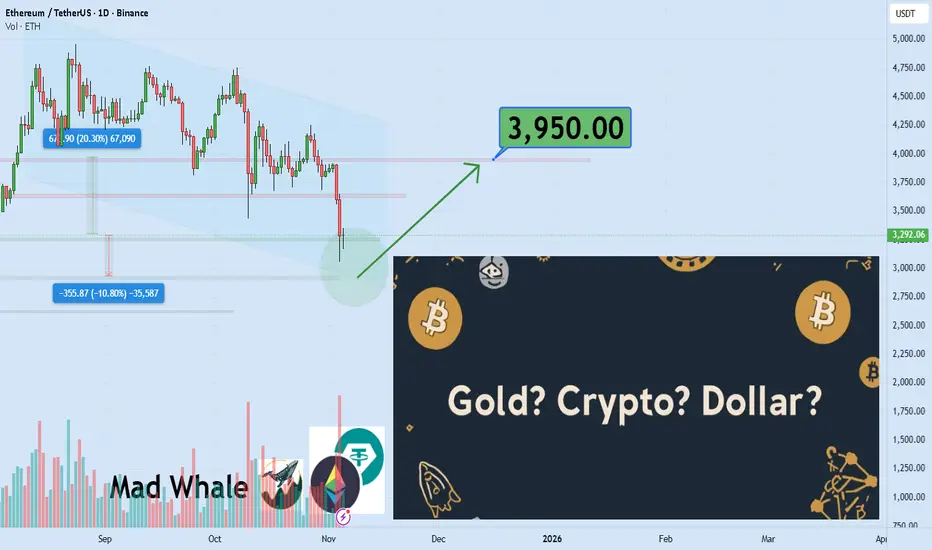
Gold, Dollar, or Bitcoin? The Great Wealth BattleWhen markets are turbulent, where does your capital stay? Do the old assets still shine, or is the new digital generation taking over? The answer lies not in prediction, but in intelligent asset management
Hello✌️
Spend 2 minutes ⏰ reading this educational material.
🎯 Analytical Insight on Ethereu
ETH Breaks Structure! Are the Bears Back in the Race?Ethereum (ETH) is entering a sensitive phase as overall market sentiment turns more cautious following recent declines across the crypto market. While it remains the leading platform for tokenization and DeFi, short-term selling pressure is becoming increasingly evident — especially as speculative
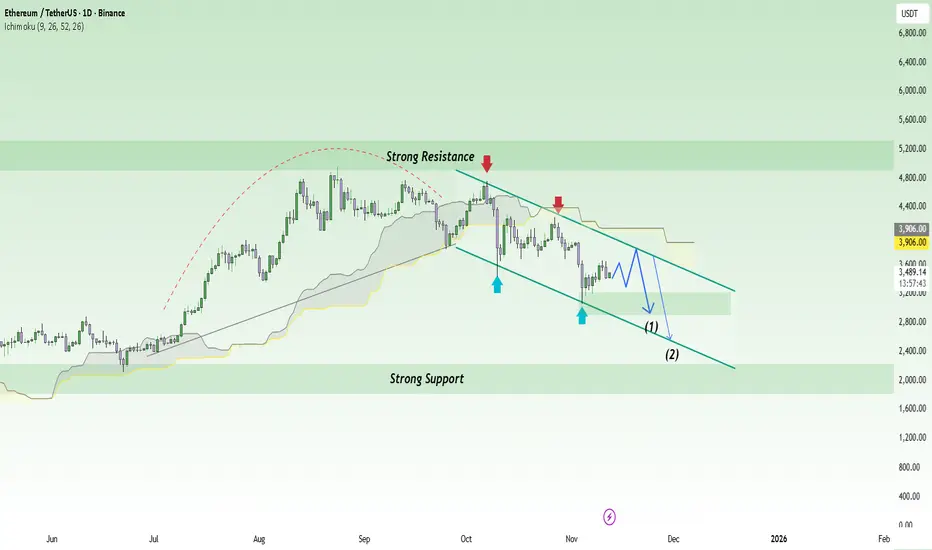
ETHUSDT the supports are holding strong to pump it upAs observed on the ETHUSDT chart, the previously identified support zone near $3,100 has demonstrated expected resilience, validating our technical assessment. The price is now undergoing a corrective phase as it tests a significant trendline resistance around $3,700. We anticipate a potential break

Does this scenario cross your mind? What if…Does this scenario cross your mind? What if…
CRYPTOCAP:ETH drops below $3,000, maybe $2700, and everyone thinks it’s all over. Then, just as everyone is convinced the bears have won, ETH bounces back, shaking out the sceptics while most people stay on the sidelines. Meanwhile, Tether and the Bitc
Ethereum's Updated Map: Giant Flat Correction Corrections can be complex and massive in size
On Ethereum, we have been in a major corrective structure since the strong move up of 2018-2021 completed
The structure shows two large red legs down with a green zigzag joint connecting them
The first large red leg down defines the boundaries of this

ETH/USDT | Ethereum Eyes $4K After Holding Above Key Support!By analyzing the Ethereum (ETH) chart on the weekly timeframe, we can see that after the previous analysis, the price started rising from $3300 and climbed up to $3700 before facing a correction.
Currently, ETH is trading around $3500, and we’ll need to see if it can hold above $3300 in the next cou

See all ideas
Summarizing what the indicators are suggesting.
Oscillators
Neutral
SellBuy
Strong sellStrong buy
Strong sellSellNeutralBuyStrong buy
Oscillators
Neutral
SellBuy
Strong sellStrong buy
Strong sellSellNeutralBuyStrong buy
Summary
Neutral
SellBuy
Strong sellStrong buy
Strong sellSellNeutralBuyStrong buy
Summary
Neutral
SellBuy
Strong sellStrong buy
Strong sellSellNeutralBuyStrong buy
Summary
Neutral
SellBuy
Strong sellStrong buy
Strong sellSellNeutralBuyStrong buy
Moving Averages
Neutral
SellBuy
Strong sellStrong buy
Strong sellSellNeutralBuyStrong buy
Moving Averages
Neutral
SellBuy
Strong sellStrong buy
Strong sellSellNeutralBuyStrong buy
Displays a symbol's price movements over previous years to identify recurring trends.
Frequently Asked Questions
The current price of Ethereum / Tether USD (ETH) is 3,165.28 USDT — it has risen 1.96% in the past 24 hours. Try placing this info into the context by checking out what coins are also gaining and losing at the moment and seeing ETH price chart.
Ethereum / Tether USD price has risen by 1.64% over the last week, its month performance shows a −17.92% decrease, and as for the last year, Ethereum / Tether USD has decreased by −0.69%. See more dynamics on ETH price chart.
Keep track of coins' changes with our Crypto Coins Heatmap.
Keep track of coins' changes with our Crypto Coins Heatmap.
Ethereum / Tether USD (ETH) reached its highest price on Aug 24, 2025 — it amounted to 4,938.08 USDT. Find more insights on the ETH price chart.
See the list of crypto gainers and choose what best fits your strategy.
See the list of crypto gainers and choose what best fits your strategy.
Ethereum / Tether USD (ETH) reached the lowest price of 0.005 USDT on Dec 22, 2015. View more Ethereum / Tether USD dynamics on the price chart.
See the list of crypto losers to find unexpected opportunities.
See the list of crypto losers to find unexpected opportunities.
The safest choice when buying ETH is to go to a well-known crypto exchange. Some of the popular names are Binance, Coinbase, Kraken. But you'll have to find a reliable broker and create an account first. You can trade ETH right from TradingView charts — just choose a broker and connect to your account.
Crypto markets are famous for their volatility, so one should study all the available stats before adding crypto assets to their portfolio. Very often it's technical analysis that comes in handy. We prepared technical ratings for Ethereum / Tether USD (ETH): today its technical analysis shows the strong sell signal, and according to the 1 week rating ETH shows the sell signal. And you'd better dig deeper and study 1 month rating too — it's buy. Find inspiration in Ethereum / Tether USD trading ideas and keep track of what's moving crypto markets with our crypto news feed.
Ethereum / Tether USD (ETH) is just as reliable as any other crypto asset — this corner of the world market is highly volatile. Today, for instance, Ethereum / Tether USD is estimated as 4.56% volatile. The only thing it means is that you must prepare and examine all available information before making a decision. And if you're not sure about Ethereum / Tether USD, you can find more inspiration in our curated watchlists.
You can discuss Ethereum / Tether USD (ETH) with other users in our public chats, Minds or in the comments to Ideas.