ETH - Is $3,000 next?Today marked a significant milestone for Ethereum as it successfully rolled out its much-anticipated Pectra upgrade. The update, which introduces a number of technical enhancements aimed at improving scalability, security, and developer experience, has already had a noticeable impact on market sentiment. In the hours following the upgrade, Ethereum (ETH) surged more than 13%, breaking through key resistance levels and igniting fresh bullish momentum.
From a technical standpoint, ETH is currently breaking out of a descending wedge pattern, a structure often seen as a bullish reversal signal. The price action has decisively pushed through the wedge’s upper boundary, signaling a potential end to the recent downtrend. Additionally, ETH is now testing a significant resistance zone, often referred to as the "resistance box," which has historically served as a key battleground between bulls and bears.
Should Ethereum manage to secure a clean breakout above this resistance area with strong volume. The next major upside target lies around the $3,000 level, a psychologically and technically important price point. This move could mark the beginning of a larger bullish cycle if market conditions remain favorable and momentum continues to build.
With the broader crypto market showing signs of recovery and Ethereum's fundamentals strengthening post-upgrade, traders and investors alike will be closely watching to see whether ETH can sustain its breakout and confirm this bullish trend.
-------------------------------
Thanks for your support.
- Make sure to follow me so you don't miss out on the next analysis!
- Drop a like and leave a comment!
ETHUSDT trade ideas

Understanding Liquidity: Where Big Players Hunt Stops
Understanding Liquidity: Where Big Players Hunt Stops
Ever wondered why price suddenly spikes through your stop-loss and reverses moments later? That’s not a coincidence—it’s liquidity at play. This article will teach you how liquidity zones work, why stop hunts happen, and how to avoid getting trapped like the crowd.
🔵 What Is Liquidity in Trading?
Liquidity refers to how easily an asset can be bought or sold without drastically affecting its price. But in practical trading, liquidity is more than just volume—it’s where traders *place* their money.
Large players—institutions, market makers, or big accounts—need liquidity to fill orders.
They target areas where many retail stop-losses or pending orders are stacked.
These areas are often just above resistance or below support—classic stop-loss zones.
To move large positions without slippage, smart money uses stop hunts to trigger retail orders and create the liquidity they need.
🔵 Where Do Liquidity Zones Form?
Liquidity often builds up in predictable areas:
Above resistance: Where shorts place stop-losses.
Below support: Where longs place stop-losses.
Swing highs/lows: Obvious turning points everyone sees.
Round numbers: e.g., 1000, 10,000, 50,000.
Breakout zones: Where breakout traders place entries or stops.
These zones act like magnets. When price approaches them, it accelerates—seeking the liquidity pool behind the level.
🔵 What Is a Stop Hunt?
A stop hunt happens when price moves just far enough to trigger stop-losses before reversing. This isn’t market noise—it’s an intentional move by big players to:
Trigger a flood of stop orders (buy or sell).
Fill their own large positions using that liquidity.
Reverse price back to fair value or the prior trend.
Example: Price breaks above resistance → stops get hit → institutions sell into that liquidity → price drops sharply.
🔵 Signs You’re in a Liquidity Grab
Look for these clues:
Fast spike beyond key levels followed by rejection.
Wick-heavy candles near highs/lows.
Price touches a level, then sharply reverses.
High volume on failed breakouts or fakeouts.
These are signs of a liquidity event—not a real breakout.
🔵 How to Trade Around Liquidity Zones
You can use liquidity traps to your advantage instead of becoming their victim.
Avoid obvious stops: Don’t place stops directly below support or above resistance. Instead, use ATR-based or structure-based stops.
Wait for confirmation: Don’t chase breakouts. Let price break, reject, then re-enter inside the range.
Watch for wick rejections: If price quickly returns after a level is breached, it's often a trap.
Use higher timeframe confluence: Liquidity grabs are more powerful when they align with HTF reversals or zones.
🔵 Real Example: Liquidity Sweep Before Reversal
In this chart, we see a textbook liquidity grab:
Price breaks below support.
Longs get stopped out.
Candle prints a long wick.
Market reverses into an uptrend.
This is where smart traders enter— after the trap is set, not during.
🔵 Final Thoughts
Liquidity is the invisible hand of the market. Stop hunts aren’t personal—they’re structural. Big players simply go where the orders are. As retail traders, the best thing we can do is:
Understand where traps are set.
Avoid being part of the crowd.
Trade the reaction, not the initial breakout.
By thinking like the smart money, you can stop getting hunted—and start hunting for better trades.

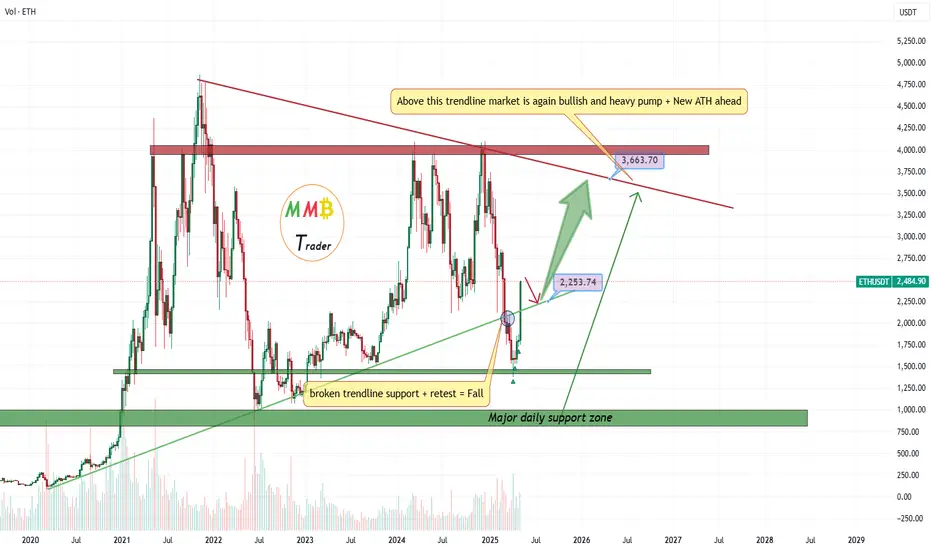
ETHUSDT above green trendline wait for retest and then 3500$As we can see our first target hit which was 2300$ and the pump started from our daily support of 1400$ now we can expect range here for a while or short-term correction to retest the green trendline and this trendline would be once again major support and will pump price to the targets like 3000$.
Also market is bullish and more pump and rise is also possible without any range.
DISCLAIMER: ((trade based on your own decision))
<<press like👍 if you enjoy💚
#ETHUSDT: Price to Touch All Time High $4500 By End Of YearETHUSDT has hit lowest point and we might see a price reversal towards $4500, which would be an all-time high. There are three potential targets for the price to reach.
Good luck and trade safely!
Best regards,
Team Setupsfx_
We’d love for you to support and encourage us!
- Like our ideas
- Share your thoughts
- Share our work if it helps

ETH => Shift In Momentum Almost Done!Hello TradingView Family / Fellow Traders. This is Richard, also known as theSignalyst.
📉 Since breaking below its last major low in December 2024, Ethereum (ETH) has been stuck in a bearish trend.
But don’t lose hope, bulls! 🐂
⚠️It’s evident from the last correction phase, marked in blue, that it's larger than the previous ones — a clear sign that the bulls are stronger than ever.
A growing correction phase is often the first signal of an upcoming momentum shift.
This shift will be confirmed once ETH breaks above the last major high marked in red at $2,100.
📈A break above $2,100 would flip ETH’s trend from bearish to bullish, signaling the potential start of the Altcoin season!
Until then, patience is key. 🧘♂️
📚 Always follow your trading plan regarding entry, risk management, and trade management.
Good luck!
All Strategies Are Good; If Managed Properly!
~Rich

Can Ethereum Break $2,000 and Surge 16% to $2,100?Hello and greetings to all the crypto enthusiasts, ✌
All previous targets were nailed ✅! Now, let’s dive into a full analysis of the upcoming price potential for Ethereum 🔍📈.
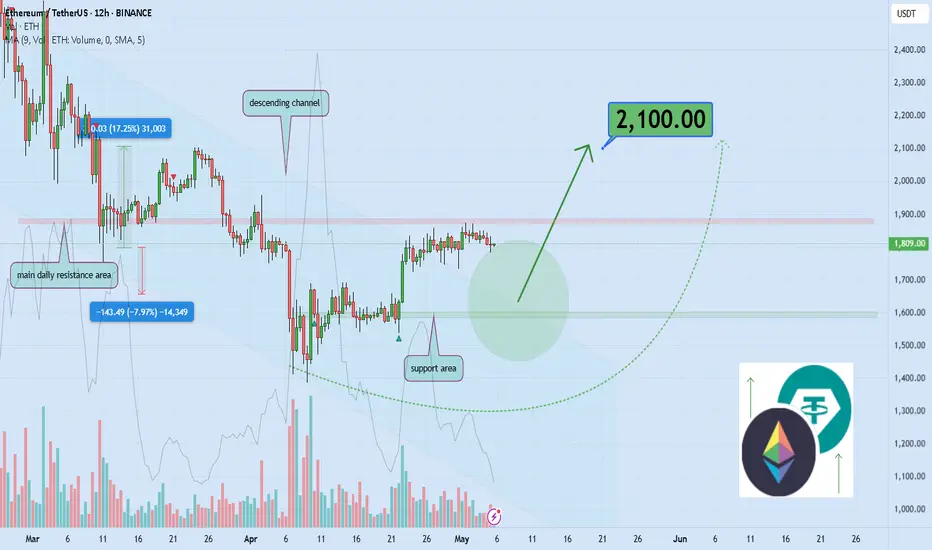
Ethereum has recently broken out of its descending channel to the upside, indicating a potential for at least a 16% price increase. The price is approaching a key resistance zone, with the psychological \$2,000 level in sight. My primary target is \$2,100, but a retest of the channel's upper boundary is also a likely scenario. 🚀📊
🧨 Our team's main opinion is: 🧨
Ethereum broke its descending channel, targeting a 16% rise to \$2,100, with key resistance at \$2,000. 🚀
Give me some energy !!
✨We invest hours crafting valuable ideas, and your support means everything—feel free to ask questions in the comments! 😊💬
Cheers, Mad Whale. 🐋
ETHUSDT - Will likely have 5 Digits by the end of 2025Ethereum has dropped 65% since December, hitting its bottom in April —
that’s 5 full months in a bear market with a massive drawdown, especially for the second-largest crypto by market cap.
Today, it made a strong bounce, rallying over 50% from the grey support zone,
confirming that the bottom was likely in.
Looking at the RSI, Ethereum has entered the oversold zone only 3 times in the last 5 years —
which is another strong indication that a bottom has been reached.
So what can we expect from ETH in the coming days?
- Ethereum is still close to the bottom, and RSI conditions remain healthy.
- Historically, the current RSI level has only occurred three times in five years.
Based on this:
- This bounce is likely just the beginning of a much bigger move. ETH still has a lot of upside potential.
- The next key resistance is around $2,500, which lines up with both the 200 EMA and the 0.618 Fibonacci level — keep an eye on that.
- Long-term, Ethereum is on track for a new all-time high (ATH).

Ethereum's Uptrend Confirmed: Bulls Take ControlEthereum's Uptrend Confirmed: Bulls Take Control
After the FOMC meeting yesterday, ETH started a strong upward move, gaining nearly 8%.
The chances of further growth are increasing.
ETH has already broken out of a solid bullish pattern, signaling more potential upside.
The setup looks promising, and the price is approaching our first target.
You may watch the analysis for further details!
Thank you!

Ethereum Bear Market Over! $10,000 Before 2026 Confirmed!People were badmouthing Ethereum but look what is happening, more than 20% growth in a single day. Awesome right? But this is only the start, the last high will be reached and conquered easily, that I know for certain for sure it is true just watch.
In a previous analysis I mentioned that ETHUSDT was trading within a tight range support buy-zone, marked blue on this chart. This is also a higher low and consolidation was happening before what happened today. Bullish action confirmed. Real bullish action I should say because this action is coupled with really high volume. Confirming a very strong high in the coming weeks and days.
Here is what will happen, Ethereum will grow daily non-stop for months. Now, saying it (reading it) is one thing, experiencing will be something completely different, the market will become euphoric as everything grows.
Hundreds of billions worth of USD will be injected into the market, we already have 30 billions that came in recently but only some 10-15 billions are already in-play. This means that the whales still have 15 billion USD ready to buy, and they will continue to buy long-term. As this capital dries up, more and more players will get involved. Notice how the sentiment is still low. People know we are bullish but that is only the usual market participants, those that are part of the industry, the rest, the mass, they are not in yet. When the masses wake up, that will be very close to the top of the first bullish wave. 250 B$ coming in will change not only the Cryptocurrency market forever but also the global financial landscape.
Ethereum breaking bullish is just step one, there is more to come. Prepare for Ethereum to trade at around $10,000 before this year ends. Would you like to bet? I don't think so, we already won because we've been bullish since before 7-April, now it is time to enjoy the ride nothing more.
Adapt and change. The market always fluctuates from bullish to bearish, from bearish to sideways, from sideways to bullish and bullish the market will stay long-term.
Thank you for reading.
"Buy like it's the end of the world. —Master Ananda"
You can't go wrong when prices are low.
Thanks a lot for your continued support.
Namaste.

Ethereum (ETH/USDT) – Bullish Momentum Building Toward targetHello guys...
Ethereum has broken out of its long-term descending channel and is currently trading inside a smaller ascending channel, showing strong bullish momentum. After a "fake breakout" below major support around $1,400, ETH quickly reclaimed higher levels, suggesting a bear trap.
Currently, ETH is approaching the critical resistance zone around $2,000. As long as the price stays inside this rising structure and continues making higher lows, the bias remains bullish toward a test of the major resistance.
✅ A clear breakout above $2,000 could trigger a stronger move up.
⚠️ However, if the structure breaks down, we should watch for potential pullbacks.
___________________________
Key Levels to Watch:
Support: $1,720–$1,750 zone
Resistance: $2,000–$2,050 zone

Ethereum ETH price analysisThe #Ethereum network has successfully activated the #Pectra update, one of the factors that JPMorgan previously called a bullish driver for CRYPTOCAP:ETH
The update contains 11 improvements, including: support for smart contracts in wallets (simplified use and recovery, payment of fees in different tokens), an increase in the staking limit to 2048 ETH, optimization of validators and management of withdrawals through smart contracts.
All of this should make #Ethereum more convenient, scalable, and accessible.
📊 If we look at the OKX:ETHUSDT chart, I want to believe that the price will not go below $1500-1600 and this will be the “last carriage” buying zone
📈 And then - a smooth “acceleration of a heavy locomotive”, which, let's hope, will reach the $3800 “station” already in 2025.
_____________________
Did you like our analysis? Leave a comment, like, and follow to get more

Ethereum ... Don't miss this train!The Ethereum season has arrived, and in the coming days, we'll be focusing on Ethereum and the tokens built on its network.
The chart shows a descending broadening wedge pattern, which has been broken on the daily timeframe.
Don’t wait for a retest or any major corrections—this train won’t wait for you.
The target for this pattern is $6,600.
Best regards Ceciliones🎯

ETHUSDT Breakout & Retrace: Watching the $2,200 Buy Zone!Hey Traders,
In today's session, we're keeping a close eye on ETHUSDT for a potential buying opportunity around the $2,200 zone. After trending downward, Ethereum has successfully broken out of its downtrend and is now undergoing a correction. It’s currently approaching a key support/resistance area at $2,200, which could act as a strong retracement level.
As always, trade safe.
Joe

ETH is close to big dumpETH is close to the end of the impulse before continuing the major dive from the cycle peak

DeGRAM | ETHUSD keeping the demand zone📊 Technical Analysis
● ETH printed a higher low at the green $1 750‑1 900 demand zone and is now moving along the support line.
● A close above minor trend resistance at $1 900 should trigger a run toward $2 100; downside risk contained at $1 650.
💡 Fundamental Analysis
● SEC cleared options trading on spot‑ETH ETFs, and analysts see staking approval as early as May—fresh catalysts for institutional inflows.
✨ Summary
Trend‑break plus ETF momentum backs a short‑term long stance: targets $1 900 → $2 100; invalidate below $1 700.
-------------------
Share your opinion in the comments and support the idea with like. Thanks for your support!

ETH BreakoutDown‑trend break
A sharp, high‑volume candle has punched through the descending trend‑line, giving a clear bullish break of structure.
Resistance → Support flip
The 2 100‑2 150 USDT band that capped price earlier is now a potential support zone. A brief retest that holds would keep the bullish scenario intact.
First objective: 2 500‑2 550 USDT
Liquidity sits there (horizontal line on your chart). It’s a logical partial‑take‑profit area.
Expected pullback
The arrow sketches a throwback toward 2 350‑2 400 USDT to form a higher low after the breakout.
Second objective: 2 800‑3 000 USDT
3 000 is a psychological level and aligns with a higher supply zone. If that breaks, the broader 3 300‑3 600 USDT grey box comes into play.
Invalidation
A 4‑hour close back under ~2 100 USDT or a move below the broken trend‑line would kill the bullish thesis.
The arrow shows a classic breakout → retest → continuation roadmap. As long as ~2 100 USDT holds, it’s a reasonable bullish path—but keep tight risk management in case the retest fails.

ETH found a bottom at the 2018 All Time High IMO
#ETH RSI also hit the bottom levels🧐
As I said many times 'not accumulating CRYPTOCAP:ETH below $2k' is such a mistake❗️
#Ethereum still the bottom levels, now it's setting for the rally do not miss🚀
@VIPROSE

#ETH is hitting a major resistance next target $4000! Here's Why#ETH is back inside the legendary 1,883-day trendline, a massive bullish signal for altcoins.
Meanwhile, BTC Dominance is getting rejected from the top, adding fuel to the altcoin momentum.
But there's one key confirmation still needed before we talk about new ATHs for ETH, BTC, and the broader altcoin market:
The 200-Week EMA.
Currently sitting around $2,237, this level needs to be claimed with a strong weekly close. ETH is trading above it right now, but the next 2 days and 4 hours are crucial.
A confirmed breakout here would signal a major shift in ETH's 200-week momentum a structural change that could trigger the next big leg up.
I believe it’s only a matter of time before ETH closes above this level. Once that happens, the next target for CRYPTOCAP:ETH would be $2980, $3488 and $4000!
What do you think?
Drop your thoughts in the comments and hit the like button if you found this valuable.
#PEACE ✌️

ETH Hits $2,600 Target! Is a Massive Pullback or Breakout Next? ETH
The price targets of $2,500–$2,600 have been achieved.
At this moment, I would not rush into making trading decisions. We have reached a Premium Price level, where the price is likely to encounter selling pressure from market participants. Consequently, there is a high probability of consolidation around these price levels. Given the broader market conditions, I anticipate even higher price targets in the future, but not from the current levels.
A pullback to the $2,100–$2,200 range would be an optimal zone for initiating buy positions, pending the emergence of new market variables.

GREAT OPPORTUNITY TO BUY ETHAfter several rejections trying to break past the indicated resistance, today, we have a breakthrough on BINANCE:ETHUSDT.P , It would be valid to buy ETH at the retest of the previous resistance that as just been broken, we also have both 50and200 EMAS as our shield to add as extra confluence on this very trading ideas. All the best.

ETHUSDT near two major weekly support and soon 2200$After so many short open at top:
Now we are looking for rise and pump near these weekly supports and soon our target can hit.
DISCLAIMER: ((trade based on your own decision))
<<press like👍 if you enjoy💚

ETH ANALYSIS (12H)This analysis is an update of the analysis you see in the "Related publications" section
Ethereum has finally reached the flip zone.
Pay close attention: Ethereum dominance is sitting on monthly support, which is a level with strong bounce potential.
We have two possible scenarios for Ethereum | either it breaks through the flip zone, or it makes a correction and turns bullish again from around the bottom.
⚠️ What’s clear is that shorting Ethereum is risky and doesn’t make sense!
For risk management, please don't forget stop loss and capital management
When we reach the first target, save some profit and then change the stop to entry
Comment if you have any questions
Thank You

$ETH just woke up. +30% in 2 days. Straight through resistance.Ethereum just woke up.
+30% in 2 days. Straight through resistance.
Reclaimed EMAs. Volume explosion.
Next stop? $2.6K+ if this momentum holds. Altcoin rotation may have just started.
