Lingrid | ETHUSDT Trend Continuation Pattern. Potential LongBINANCE:ETHUSDT is consolidating inside an upward channel, holding just above the 1,757 support and the upward trend-line. After reaching a higher high near the channel top, price pulled back but remains within structure. If the trend-line holds, a rebound toward the 1,990 resistance looks likely. The bullish setup remains valid while price trades above the trend-line.
📈 Key Levels
Buy zone: 1,750 – 1,760
Buy trigger: bounce from trend-line
Target: 1,990
Sell trigger: break below 1,750
💡 Risks
If ETH loses trend-line support, momentum could flip to bearish.
Volatility from BTC or macro events may trigger false moves.
Watch for breakout above consolidation highs for early confirmation.
Traders, if you liked this idea or if you have your own opinion about it, write in the comments. I will be glad 👩💻
ETHUSDT trade ideas

Ethereum - Sell at high, take long after Sl huntEthereum - Sell at high, take long after Sl hunt
Key zone for short $1869
Key zone for long $1697 or $1581

ETH short
Liquidity sweep and rejection at the monthly open.
Short trigger. Aiming for the previous weeks high
Confluent with the value area low of the current week so far (volume profile)

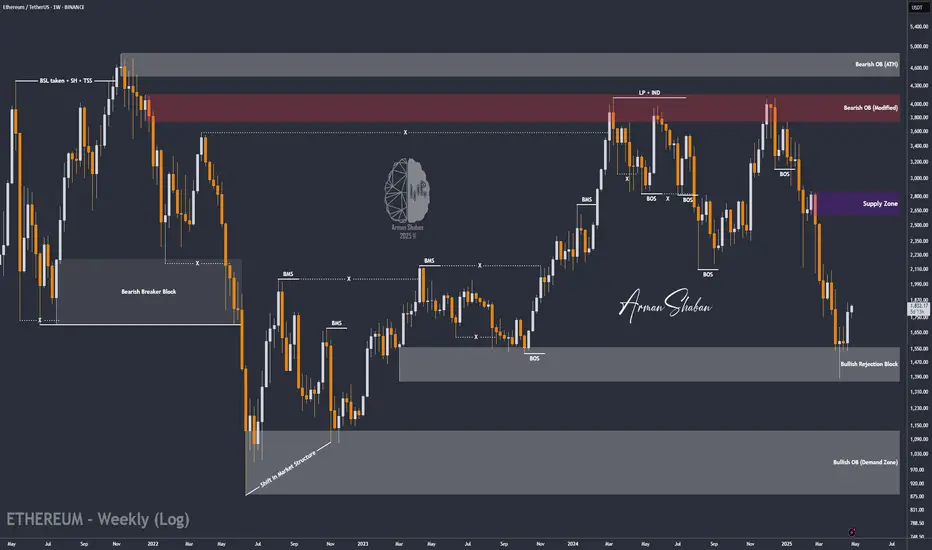
ETH/USDT : Bulls are coming back? (READ THE CAPTION)By analyzing the #Ethereum chart on the weekly (logarithmic) timeframe, we can see that after reaching the demand zone between $1400 and $1550, buying pressure increased significantly. Currently, Ethereum is trading around $1800, and I expect to see the next bullish wave soon. The potential upside targets are $1990, $2500, and $2600. This analysis will be updated accordingly!
Please support me with your likes and comments to motivate me to share more analysis with you and share your opinion about the possible trend of this chart with me !
Best Regards , Arman Shaban
ETHUSDT Soon again Above 2K$The support zone hold price from falling as it was expected:
Now we are looking for more pump here and at least our first target which is 2200$ and if the price pump and get back above the green trendline then market is bullish once again and next Targets like 3K$ is also possible.
DISCLAIMER: ((trade based on your own decision))
<<press like👍 if you enjoy💚

Ethereum - Take LONG with MEEthereum - Take LONG with ME
we have long from 1754 with our team
follow up trend untip it breaks

Ethereum ETH Is Gaining Strength Agains BitcoinHello, Skyrexians!
BINANCE:ETHUSDT was a huge underdog last 4 month on the bearish phase, but recently it started to gain power, on the recent dump it has not showed correction.
On the daily chart we can see that price has printed 5 waves Elliott cycle. Wave 3 corresponds to the minimum Awesome oscillator. After that wave 5 has finished this cycle with divergence. The conservative bounce target is $3000 at 0.61 Fibonacci level, but we have one problem here. AO did not crossed zero line at wave 4, so we can be in wave 4 only now, in this case another one lower low will happen. We need to count sub waves every day. Wait for our updates.
Best regards,
Ivan Skyrexio
___________________________________________________________
Please, boost this article and subscribe our page if you like analysis!

Ethereum Rebounds from Key Confluence Zone$ETH/USDT Weekly Chart Analysis
Ethereum is holding a major long-term uptrend as the price bounces off the ascending trendline support. This level also aligns with a strong historical resistance-turned-support zone, adding more confluence to the current bounce.
As long as ETH stays above this structure, it suggests a potential macro bullish continuation, with eyes on the upper resistance line near $3,200–$3,500.
A strong defense at this zone reinforces long-term bullish sentiment.

BUY MARKET!!!Hello dears
If you are risk-averse, this analysis is for you...
Given the decline we had, you can see that the price was supported within the specified support range and a range was formed that can be purchased with risk and capital management and moved to the specified ranges...
*Trade safely with us*

Technical Analysis: Ethereum (ETH) — April 30, 2025📊 Outlook
Ethereum is trading in a tight range with slight upward momentum. Current RSI is neutral, and price remains above the 50-day SMA, hinting at a sustained bullish trend. The Fear & Greed Index supports this positive sentiment. A break above $2,000 could confirm bullish continuation, while a drop below $1,700 may shift sentiment to bearish.
📌 Analyst Note: Maintain bullish bias while ETH remains above $1,790.66. Monitor resistance at $2,000 for breakout confirmation.
🔍 Indicators
RSI (14): 51.60 — Neutral
SMA 50: $1,790.66 — Price slightly above → Bullish
30-Day Volatility: 4.97%
Fear & Greed Index: 61 (Greed)
Technical Sentiment: Bullish
📈 Levels
Next Resistance: ~$2,000
Next Support: ~$1,700
Short-Term Price Target: $1,804.35 by May 30, 2025

Ethereum ETH price analysisThe #Ethereum network has successfully activated the #Pectra update, one of the factors that JPMorgan previously called a bullish driver for CRYPTOCAP:ETH
The update contains 11 improvements, including: support for smart contracts in wallets (simplified use and recovery, payment of fees in different tokens), an increase in the staking limit to 2048 ETH, optimization of validators and management of withdrawals through smart contracts.
All of this should make #Ethereum more convenient, scalable, and accessible.
📊 If we look at the OKX:ETHUSDT chart, I want to believe that the price will not go below $1500-1600 and this will be the “last carriage” buying zone
📈 And then - a smooth “acceleration of a heavy locomotive”, which, let's hope, will reach the $3800 “station” already in 2025.
_____________________
Did you like our analysis? Leave a comment, like, and follow to get more

ETH : BUY...Hello friends
Due to the entry of buyers and the breakdown of the trading range, we can buy in the direction of the trend and with capital and risk management within the specified limits and move to the specified targets.
*Trade safely with us*

ETH/USDT – Weekly Chart AnalysisETH/USDT Unique Technical Structure: Large Accumulation + Recovery Setup
This chart shows Ethereum’s price action over the past few years, highlighting key support and resistance areas. A strong visual signal (blue arrow) indicates bullish potential.
Chart Pattern Implications:
The pattern on this chart is not a classical shape (e.g., cup and handle), but it does show a Wyckoff-style accumulation phase followed by a failed breakout and reaccumulation:
Strong base formed between $1,000-$1,400
A series of lower highs and a range-bound structure after the 2022 peak
The bullish projection illustrated by the arrows shows a potential recovery towards the ATH again
This setup suggests that Ethereum is at a critical juncture – either:
It retests current support and begins a new uptrend.
Or it risks another test of the $1,400-$1,050 range before a breakout.
Risk-Reward: Current levels ($1,796) offer attractive long-term entries if you’re bullish.
Caution Zone: If ETH breaks below $1,400 with volume, $1,050 becomes the next key defense.
If you found this analysis helpful, hit the Like button and share your thoughts or questions in the comments below. Your feedback matters!
Thanks for your support!
DYOR. NFA

ETH Short (Short term)ETH has just completed manipulation on weekly time frame which just closed earlier (2 hours ago from writing). Expecting down move to 50% of the weekly range ($1695) before continuing it's overall bullish trend to higher prices.
Able to position a short from $1818 to $1720 (range low).
$1816 is the opening of the 4 hour fair value gap.
Reference to ICT peoples 1W-> 4H.
Will write another idea on the overall long position.

Ethereum (ETH): Reached Sideways Channel's Resistance LineEthereum is back at the resistance zone where sellers failed to show a proper breakdown, which would have triggered our sell entry yesterday.
Now that we've reached the resistance zone, this is the area we are looking for rejection now, which would give us similar movement to what we had each time we reached the resistance zone. As always, wait for MSB on smaller timeframes and once we see it short position can be taken!
Swallow Academy

ETH/USD: Struggling at $1,850 – What Traders Should Watch NextQuick Overview:
Ethereum has repeatedly tested the $1,850 zone over the past week but has failed to gain traction. Key technical levels are stacking up to form a robust resistance barrier, and without fresh volume, any breakout attempt will likely fizzle.
Key Highlights:
Confluent Resistance at $1,850: VWAP-based resistance, the 0.618 Fibonacci retracement of the recent swing, a daily supply zone, and the Point of Control all converge here.
Volume Drying Up: Each rally attempt has suffered from below-average volume, indicating a lack of buyer conviction.
Channel Context: ETH remains capped by the upper boundary of its multi-month rising channel, reinforcing the bearish case until broken.
Full Analysis:
Ethereum’s recent price action shows a classic “climbing a wall” pattern: each push toward $1,850 stalls and retreats. This level is not arbitrary—it sits at the intersection of several major technical indicators. The VWAP (Volume-Weighted Average Price) has flipped to resistance after acting as support earlier in the rally, signaling that the average trader is now underwater at these prices. The 0.618 Fib retracement from the last major low to high adds a psychological layer, as many algorithmic strategies key off this golden ratio. Finally, the Point of Control from the current volume profile highlights $1,850 as the price where most trading volume occurred, making it a natural supply zone.
Rallies into this region have been met with tepid volume, suggesting that bulls are unwilling to commit at higher prices without a clear catalyst. On lower timeframes, candlesticks near $1,850 display long upper wicks and declining body sizes—classic signs of exhaustion. Meanwhile, the broader up-channel that’s governed ETH since late 2024 remains intact, capping upside and defining the trading range.
Bias & Trade Considerations:
Bearish Lean: Until ETH can close and hold above $1,850 on strong volume, the path of least resistance remains down.
Short Entry Zone: Consider entering short positions into $1,850–$1,860, with a stop overhead of the channel line. Initial targets near the range mid ($1,700) and the 200-day MA around $1,650.
Invalidation Criteria: A decisive daily close above $1,850 with above-average volume would invalidate the bearish thesis and open targets toward $1,950–$2,000.
What to Watch Next:
Volume Spikes: A volume surge above the 20-day average during an upside move would signal renewed buying power.
Channel Break: A clear break of the channel’s upper trendline on the daily chart is required to shift the bias bullish.
Support Levels: If $1,850 holds as resistance, monitor $1,800 and $1,750 for potential bounce areas.

Ethereum (ETH): Waiting For Dominance By Buyers At $1,900Ethereum has formed a proper foundation from where we might see a good upward movement coming pretty soon; all we need is just to secure the $1,900, which then might send the price towards our target zones.
There is nothing much to talk about rather than waiting for the resistance zone and once we see that buyers will overtake that zone we are going to look for long positions here!
Swallow Academy

Breakout trading point: 1861.57
Hello, traders.
If you "Follow", you can always get new information quickly.
Please click "Boost" as well.
Have a nice day today.
-------------------------------------
(ETHUSDT 1D chart)
The 1861.57 point is the HA-Low indicator point on the 1W chart.
The key is whether it can receive support and rise around the A section, that is, 1861.57.
Since the HA-Low indicator on the 1D chart is formed at the 1647.06 point, it is important whether it can receive support and rise in the 1647.06-1861.57 section.
If it shows support in the 1647.06-1861.57 section, it is a time to buy.
-
If it falls from 1647.06, there is a possibility that a stepwise downtrend will continue, so you should also consider a response plan for this.
In the case of a decline, the Fibonacci ratio section of 0 (1190.57) ~ 0.786 (1259.39) is expected to be an important support and resistance section.
-
Since the price is located below the M-Signal indicator on the 1M chart, it is recommended to conduct trading from a day trading or short-term trading perspective.
When it breaks through the 1861.57 point, a breakout trade is possible, but as I mentioned earlier, trading requires a short and quick response.
-
If the StochRSI indicator is above the midpoint, it is recommended to focus on finding a time to sell, and if it is below the midpoint, it is recommended to focus on finding a time to buy.
When creating a trading strategy by referring to the movement of these auxiliary indicators, you must check whether there is support at the support and resistance points drawn on the 1M, 1W, and 1D charts.
-
Thank you for reading to the end.
I hope you have a successful trade.
--------------------------------------------------
- Here is an explanation of the big picture.
I used TradingView's INDEX chart to check the entire range of BTC.
I rewrote the previous chart to update it while touching the Fibonacci ratio range of 1.902 (101875.70) ~ 2 (106275.10).
(Previous BTCUSD 12M chart)
Looking at the big picture, it seems to have been maintaining an upward trend following a pattern since 2015.
In other words, it is a pattern that maintains a 3-year bull market and faces a 1-year bear market.
Accordingly, the upward trend is expected to continue until 2025.
-
(Current BTCUSD 12M chart)
Based on the currently written Fibonacci ratio, it is displayed up to 3.618 (178910.15).
It is expected that it will not fall again below the Fibonacci ratio of 0.618 (44234.54).
(BTCUSDT 12M chart)
Based on the BTCUSDT chart, I think it is around 42283.58.
-
I will explain it again with the BTCUSD chart.
The Fibonacci ratio ranges marked in the green boxes, 1.902 (101875.70) ~ 2 (106275.10) and 3 (151166.97) ~ 3.14 (157451.83), are expected to be important support and resistance ranges.
In other words, it seems likely that they will act as volume profile ranges.
Therefore, in order to break through these ranges upward, I think the point to watch is whether they can receive support and rise near the Fibonacci ratios of 1.618 (89126.41) and 2.618 (134018.28).
Therefore, the maximum rising range in 2025 is expected to be the 3 (151166.97) ~ 3.14 (157451.83) range.
In order to do that, we need to see if it is supported and rises near 2.618 (134018.28).
If it falls after the bull market in 2025, we don't know how far it will fall, but based on the previous decline, we expect it to fall by about -60% to -70%.
Therefore, if it starts to fall near the Fibonacci ratio 3.14 (157451.83), it seems likely that it will fall to around Fibonacci 0.618 (44234.54).
I will explain more details when the bear market starts.
------------------------------------------------------

$ETH Support + weeklyCRYPTOCAP:ETH is bouncing off a key trendline support + weekly demand zone
A strong reclaim above $2,350 green zone could trigger a clean move toward $4,800 resistance
Watch for retests and bullish structure forming 🧠

Long trade
1hr TF overview
🗓 Date: Saturday, 3rd May 2025
⏰ Time: 9:00 AM
📍 Session: London to New York Overlap (AM)
🪙 Pair: ETH/USDT
📈 Direction: Long (Buy Side)
🔹 Entry Details:
Entry Price: 1830.68
Take Profit: 1838.70 (+0.44%)
Stop Loss: 1830.28 (−0.02%)
Risk-Reward Ratio: 20.05
🔹 Trade Context:
Entered during the London–New York session crossover, a time known for high volatility and volume.

B wave short incoming!if eth breaks its local top before making a double bottom this trade idea is invalid.

ethusdt
After testing $1680 in Ethereum, targets of 1960-2100 and 2260 are expected in order. If a daily close occurs below $1600, a stop may be required.

Ethereum 6X Lev. Full PREMIUM Trade-Numbers (PP: 3,198%)Ether (Ethereum's token) just set a long-term higher low. The main low happened in June 2022 and the higher low now, April 2025.
Ok, let's make a pause. Before going into the chart details and technicals, let me say that this is a high probability trade setup. If you've been following for a year or more, you know what this means. This is a win.
Ethereum is set to grow and this growth will happen based on the long-term.
The numbers below can produce a huge reward with relatively low risk.
This is for advanced traders only. You need to be able to adapt to market conditions and have some experience before your decide to trade. If you are certain and you are a responsible adult; Welcome, I am wishing you tons of success.
The market gives and the market takes.
The market is set up now to give and it will give us big, big wins. These wins are here for you, if you have what it takes.
Full trade-numbers below:
____
LONG ETHUSDT
Leverage: 6X
Entry levels:
1) $1,650
2) $1,500
3) $1,450
Targets:
1) $2,125
2) $2,405
3) $3,347
4) $4,017
5) $4,871
6) $6,000
7) $7,337
8) $8,861
9) $9,947
Stop-loss:
Close monthly below $1,380
Potential profits: 3198%
Capital allocation: 5%
____
Thanks for reading and for your continued support.
I am wishing you health, wealth, success and love.
Thanks for the follow.
Thanks for the comments.
Thanks for all these years of sharing, discussions and personal growth.
Let's continue together long-term.
We are only getting started.
Namaste.
