Ethereum Breakout and Potential RetraceHey Traders, in today's trading session we are monitoring ETHUSDT for a buying opportunity around 1620 zone, Ethereum was trading in a downtrend and successfully managed to break it out. Currently is in a correction phase in which it is approaching the retrace area at 1620 support and resistance zone.
Trade safe, Joe.
ETHUSDT trade ideas

Ethereum (ETH): Possible Zone of Rejection | Waiting For MSDWe are waiting for further market structure development in order to get the confirmation on upcoming downward movement, which we are looking for currently.
After the fill of bullish CME, we had a nice rejection and first signs of weakness, which might turn into a bigger rejection from our golden zone.
As soon as we see a proper MSB form below that zone, we are going to look for downward movement from there!
Swallow Academy

THE CLEAR SKY OF SHORTS POS by ETH As we considered "IF"
The air will go to the zone, then it will need to enter the zone of the previous range of the structure
Therefore, zone 2324 will be as a decision zone.
The zone's fixation and the impossibility of a disruption will give us the zone 2555-2822
Where would I consider the real work on altas?
That is, a reset...below 2k$.

ETH TRADE PLANETHUSDT trend bullish now after CHoCH, currently respected FVG and going up but this is not my entry zone I will enter from lower FVG that caused CHoCH ( After confirmation).

$Ethereum Weekly Outlook Ethereum Weekly Outlook 🔥
CRYPTOCAP:ETH just bounced hard from the macro trendline key demand zone
- Now reclaiming the $2,350 level is a strong bullish signal.
- The next major resistance sits at $4,800.
- The path looks bullish if we hold this zone.
Accumulate smart.

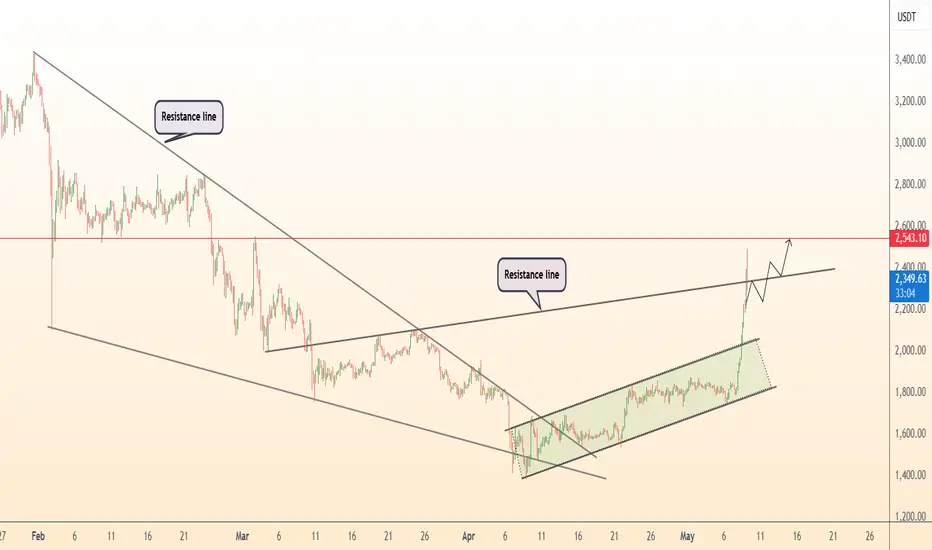
DeGRAM | ETHUSD the best score among the tops📊 Technical Analysis
● ETH blasted above the long‑term resistance line of the descending wedge, flipping it to support and signalling trend reversal.
● Price is riding a new rising channel; holding the mid‑channel support level (~$2 300) sets sights on the marked resistance level at $2 540 – 2 600.
✨ Summary
Wedge breakout + renewed ETF optimism favour a short‑term long: objectives $2 540 → $2 600+; strategy invalidated on a sustained drop below $2 200.
-------------------
Share your opinion in the comments and support the idea with like. Thanks for your support!
ETHUSDT Daily : READY For Ethereum ATH Hi guys ,
So let's see if Ethereum finally gets its turn. The chart has heavy nodes for growth but I think we could see Ethereum at $4,000 again.
SecondChanceCrypto
⏰ 9/May/26
⛔️DYOR

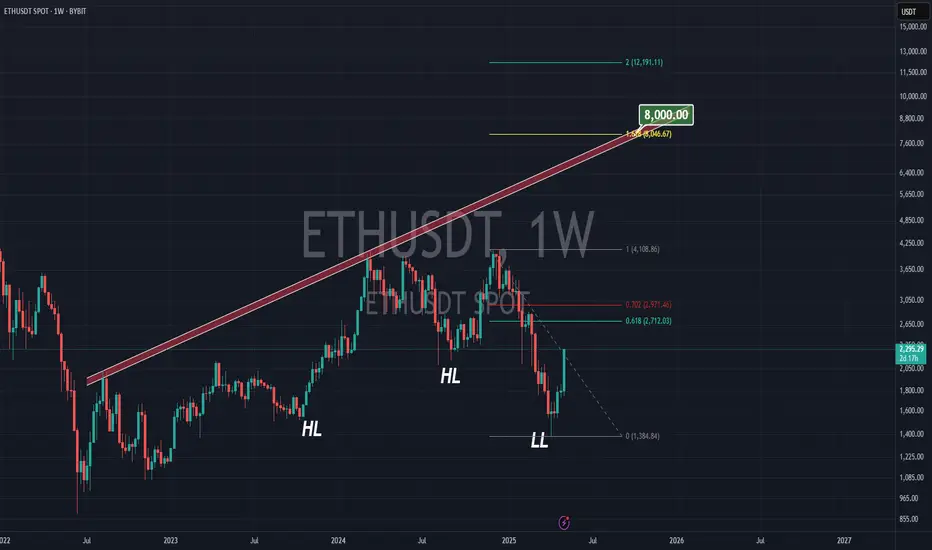
ETHEREUM TO $8000According to the previous tops we have for Ethereum on big time frames, we have a strong & long-term trend-line which gives us $7000 in summer and $8000 in October time.
On the other hand the 161.8% Fibonacci from the previous top the bottom we just saw (about $1500 ) is at $8000 .
Is this a coincident?! I don't think so
ETH/USDT – Ascending channel. Breakdown below support?Ethereum - is a smart contract platform that allows developers to build decentralized applications (DApps) on its blockchain.
CoinMarketCap : #2
↗️ Ethereum is moving within an ascending channel, and the bullish trend remains intact.
Inside the channel, there are two triangles.
The first triangle, with a base of 88%, has played out—its third wave broke through the triangle.
Liquidity grabs and shakeouts before the growth in the inner channel zones are marked with yellow circles.
Currently, we see a mirrored situation with a new triangle, this time with a 156% base. However, if this pattern plays out, it will break the ascending channel.
At the moment, the price has been dragged below the channel support, and there is a lot of negative sentiment in the news and opinions. Few believe in an upward move, and many have been liquidated. To me, this looks like a strong trigger.
⤵️The bearish scenario implies a -61% drop. (A less likely scenario.)
I've marked everything on the chart—consider this in your trading strategy. Remember, there's a lot of negativity around Ethereum, just like with all altcoins...
I also believe that on the monthly chart, it will end up being just a wick of the candle.


ETHUSDT should be at the bottom for this cycle
I believe the price of ETH at the current zone is among the lowest and it should be the bottom for this cycle. DR1 structure is prominent here. (Mind you its on the monthly TF!!!! :D)
Can buy ETH now! But for me I prefer to trade - will TP around 23XX - 2400
I will not trade crypto on other coins for now.

ETH/USDT Trading Alert – May 6, 2025, 18:30 UTCKey Signals
Trend: Downtrend (4H chart) showing potential reversal signs.
RSI: 29 (Oversold) → Higher rebound probability.
MACD: Bullish crossover forming near zero line.
Critical Level: Resistance breakout at $1,781.77.
Action Plan
✅ Entry: $1,780.00
✋ Stop-Loss: $1,765.00 (0.8% risk)
🎯 Take-Profit:
TP1: $1,800.00 (1.1% gain)
TP2: $1,820.00 (2.2% gain)
Why Now?
Oversold Bounce: RSI divergence suggests selling exhaustion.
Volume Spike: 18% increase in buy orders at $1,775 support.
Macro Context: ETH futures open interest rising ahead of ETF decision.
Risk Warning
⚠️ Upcoming US CPI data (May 8) may increase volatility. Hedge with 2% portfolio max exposure.
Tools Used: TradingView (Bitget data) + AI pattern detection.

ETH 2025.05.06🔔 Follow SEOVEREIGN to get real-time alerts.
🚀 Your boosts empower SEOVEREIGN to analyze more assets.
📊 Our team regularly publishes detailed crypto market analysis reports.
📊 Ethereum (ETH) Technical Analysis Report
Date: May 5, 2025
■ Summary
Ethereum is currently in a corrective phase, but the broader outlook suggests a continuation of the mid-to-long-term uptrend. Based on wave analysis, the market appears to be in the midst of a Z wave, indicating that a rebound could follow the current short-term pullback.
■ Technical Analysis
The formation of the Z wave suggests we are in the final leg of a complex correction.
Notably, the Y wave has extended to 1.272 times the length of the W wave, which aligns with typical conditions for a technical rebound.
As a result, we may see some short-term downward pressure, but the overall structure still points to a likely upside move in the coming sessions.
■ Target Levels
Target 1: 1,746
Target 2: 1,706
⚠️ Note: Prices are subject to market conditions. Always use proper stop-loss and risk management strategies.

HolderStat | preparing for the May saleThis smart trader withdrew 2.965 CRYPTOCAP:ETH ~$4.9K to Crypto.com—proof this trader is primed to load up on alts. With a lifetime 1832% return over 9 trades this fresh deposit signals full force into the next altcoin rally 🌟

[LONG] ETHUSDT | ETG Going Up Follow BTC?Welcome,
- Status: 📈 Long
- TP & SL On Chart
Keep wait..
Lets see..

Eth to dump back down to 1795Eth short . target $1795 . Not the best setup but still seems quite probable.
Stop: $1842.2
Target: $1795.00 full exit

Did you succeed in climbing Ethereum?Ethereum announced its 3200 decline and went until 1350! lol to lol
Now it's time back
1850/1900 is the resistance that can be rejected and maintained, it is easy to cross and maintain its 2200 and 3000 targets for the next 3 months.
Unless the downward trend is so that we don't get better, it's still early.

Complete Analysis and Unified Trading Signal for ETH/USDT Across
1. Main Trend:
30-Minute Chart: Shows a bullish trend with recent upward movements, indicating strong buying pressure.
1-Hour Chart: This timeframe also indicates a bullish trend, although it shows some signs of consolidation as the price oscillates near resistance levels.
4-Hour Chart: The longer timeframe reflects a slightly bullish trend but suggests potential exhaustion as price approaches key resistance.
2. Key Levels:
Support Levels:
1,800.00 USDT (strong historical support across all timeframes).
Resistance Levels:
1,841.31 USDT (near-term resistance visible in the 1-hour and 4-hour charts).
1,850.00 USDT (major resistance level to watch for breakout potential).
3. Technical Indicators:
MACD:
Positive divergence across timeframes suggesting bullish momentum, particularly strong on the 30-minute and 1-hour charts.
RSI:
30-Minute: Around 62 (indicating bullish momentum but nearing overbought).
1-Hour: Approximately 55, suggesting neutral to slight bullish sentiment.
4-Hour: Around 55.41, confirming that the market is not overbought yet.
Bollinger Bands:
Currently, price is near the upper band on the 30-minute chart, indicating potential overbought conditions but with room for further moves.
4. Risk/Opportunity:
Asset: ETH/USDT
Direction: Long
Entry: 1,835.00 USDT (entering at the current price level with bullish indicators).
Stop-loss: 1,800.00 USDT (setting the stop-loss just below the strong support to manage risk effectively).
Take-profit:
1,841.31 USDT (first target at resistance level).
1,850.00 USDT (second target if momentum continues upward).
Confidence: Medium (the bullish signals across multiple timeframes provide a reasonable basis for entering a long position, but caution is advised due to proximity to resistance levels).
5. Additional Notes:
Market Volatility: The analysis indicates that the ETH market is experiencing fluctuations, with notable spikes and retracements, suggesting traders should monitor for any rapid changes.
Conclusion: A careful approach is warranted, as the bullish sentiment may face challenges at key resistance levels. Traders should consider these dynamics when planning their trades.
This comprehensive evaluation synthesizes insights from multiple timeframes to provide a unified trading signal for ETH/USDT, assisting traders in making informed decisions based on current market conditions.

Analysis of the Financial Chart for ETH/USDT
1. Main Trend:
The primary trend of the chart indicates a bullish trend. The predominance of green candlesticks suggests that recent price movements have favored buyers. This is supported by the current price of 1,838.46 USDT, which is above the moving averages.
2. Key Levels:
Support: A significant support level is at 1,820.00 USDT, which could act as a barrier if the price were to decline.
Resistance: Resistance is observed at 1,850.00 USDT, and a breakout above this level could signal a continuation of the bullish trend.
Breakout/Breakdown: The highlighted areas in blue and red on the chart indicate periods of consolidation and volatility, suggesting potential trading opportunities at breakout points.
3. Technical Indicators:
MACD: The MACD bars indicate positive momentum, suggesting that the market currently has an upward push.
RSI: With a value of 60, the RSI shows that the market is near overbought territory but has not yet reached it, indicating there may still be room for further gains.
Moving Averages: The short-term moving average (blue line) is above the long-term moving average (green line), confirming the bullish trend.
4. Risk/Opportunity:
Asset: ETH/USDT
Direction: Long
Entry: 1,840.00 USDT (suggested as an entry point, ideally above the resistance level).
Stop-loss: 1,820.00 USDT (below support to protect against unfavorable movements).
Take-profit: 1,860.00 USDT (first profit target, aligned with the next resistance).
Confidence: Medium (given the current strength of the bullish trend and favorable technical indicators).
Additional Notes: Recent price movements show some volatility, so it is important to monitor trading signals closely. Any macroeconomic news or developments in the cryptocurrency market could further influence sentiment.
This analysis provides a clear view of the current situation for ETH/USDT, helping traders make informed decisions based on technical indicators and key price levels.

Liquidity zonePlease note, there is no collected liquidity here. Technically we cannot go higher yet. Everything is relevant.

ETH-----Sell around 1838, target 1750 areaTechnical analysis of ETH contract on May 2: Today, the large-cycle daily level closed with a medium-yang line yesterday, and the K-line pattern was single-yin and single-yang. The price is still consolidating at a high level. The attached indicator is running in a golden cross. The high pressure is in the 1885 area, and the low support is in the 1720 area. This is the current high and low point of the range. In addition, the trend over the weekend is likely to be mainly corrected, so try not to hold positions until the weekend for today's trading; the short-cycle hourly chart shows that the European session rose and corrected the day before, and the US session continued to break the previous high position. The current K-line pattern is continuous and negative, and the attached indicator is running in a dead cross. The trend is likely to fall during the day.
Therefore, today's ETH short-term contract trading strategy: sell at the current price of 1838, stop loss in the 1858 area, and target the 1750 area;

Financial Chart Analysis of ETH/USDTFinancial Chart Analysis of ETH/USDT
Primary Trend:
Upon examining the chart for the ETH/USDT perpetual contract on the Bitget exchange, we observe that the primary trend is sideways. Despite periods of volatility, the current price of 1,830.00 USDT reflects oscillations without a clear dominant direction, as indicated by alternating blue and red areas representing varying market conditions.
Key Levels:
Support: A significant support level lies at 1,820.00. Holding above this level is critical to avoid a potential breakdown.
Resistance: Resistance is evident at 1,837.67. A breakout above this level could signal a resumption of the bullish trend.
Breakout/Breakdown: Triangular markers on the chart highlight critical thresholds. A breakout may occur if price surpasses resistance, while a breakdown could follow if support is breached.
Technical Indicators:
MACD: The MACD displays green and red bars, suggesting neutral momentum with no clear buy or sell signals.
RSI: At 48.03, the RSI indicates a neutral market, neither oversold nor overbought, aligning with the sideways trend.
Moving Averages: Short- and long-term moving averages (blue and red lines) show potential for a crossover but currently lack definitive directional bias.
Risk/Reward Assessment:
Asset: ETH/USDT
Direction: Neutral (due to the absence of a clear trend)
Entry: 1,820.00 (suggested entry if price breaks support in a short scenario)
Stop-loss: 1,840.00 (placed above resistance to limit losses in case of upward movement)
Take-profit: 1,800.00 (initial profit target, aligned with identified support)
Confidence: Moderate (given the sideways trend and ambiguous technical signals)
Additional Notes:
Bollinger Bands suggest the price is testing the lower band, hinting at a potential rebound opportunity. However, recent volatility, as highlighted in the chart, warrants close monitoring.
This analysis provides a clear snapshot of Ethereum’s current standing against USDT, with recommendations grounded in technical signals and key levels. Always consider macroeconomic factors that may further impact the market.

ETH 2000$📈 CRYPTOCAP:ETH Analysis – May 2, 2025
Ethereum is forming a bullish ascending triangle and reacting to the key resistance at 1812, possibly preparing for a breakout.
🔹 Resistances:
1812 USDT 🔼
1910 USDT 🎯
2000 USDT 🎯
🔹 Supports:
1728 USDT 🛡️
1680 USDT ⚠️
1484 USDT ⚠️
