2024-07-23 - priceactiontds - daily update - daxGood Evening and I hope you are well.
overall market comment
Indexes moved mostly sideways and that’s good for the bears. Even decent or in line earnings could not take this rally further, instead we sold off into the close and broke the minor bull trend lines. For tomorrow I expect more downside price action to test the lows.
Commodities - Gold moved sideways inside the same range since Friday after the sell off. Market is trying to bottom but I don’t think bears are done. Wait for the next big breakout.
Oil - Watching Oil on lower tf is atrocious and be smarter than me. Clear down trend. Lower lows and lower highs. Got 2 decent bear channels downwards and right now the 1h 20ema is decent to short against. Any pullback should now stay below 80.
Bitcoin - First decent selling on the daily since last Wednesday. Bull trend line is broken but it was way too steep anyway. Bears need prices below 65000 to have a chance for more downside. If bulls buy the dip again, probably moon again to 700000+.
dax futures
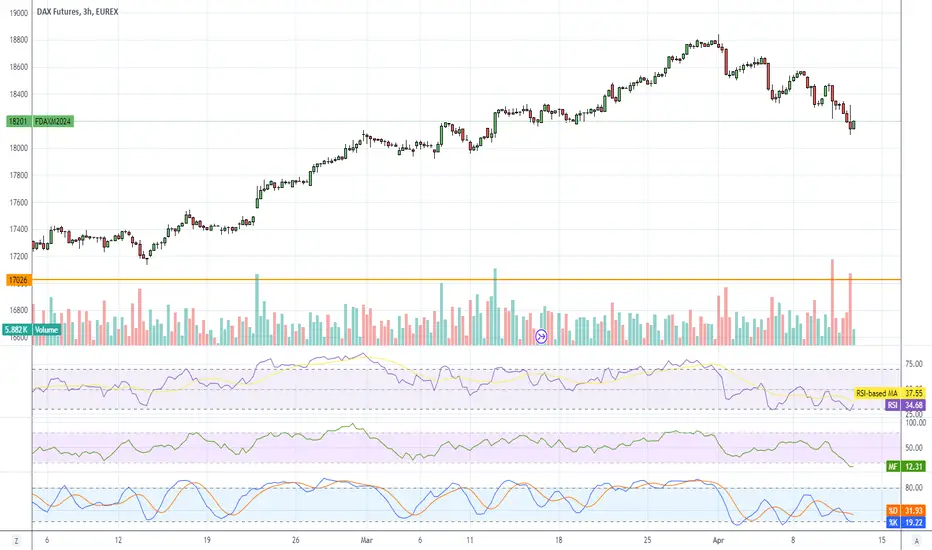
comment: 18600 would need a huge reversal day tomorrow and get below 18400 for a chance of more downside over the next days. Bulls made it clear that this is the big triangle playing out first and not a new bear trend. My bearish thesis still holds as long as we stay below 18900. Just means we probably go sideways for longer. I expect tomorrow will be a big red bar on the daily chart. Close below 18450 would be good.
current market cycle: trading range
key levels: 18300 - 18900
bull case: Follow through buying by the bulls and they continued to stay above the 1h 20ema. Minor bull trend line also holding, so no reason to stop buying every dip. They now had 2 pushed up and a third one could get us to the big bear trend line from the ath. That’s the target for the bulls for tomorrow.
Invalidation is below 18560.
bear case: Bears need stronger consecutive bear bars below the 1h ema, for lower prices. Right now the best they can hope for is to stop the advance and maybe stay between 18600 - 18700. If they would be manage to generate strong selling below 18600, we can talk bear again. Bad stuff to trade currently. Trending trading range upwards.
Invalidation is above 18900.
short term: Yesterday I was neutral and will stay that way. Can see it go both ways again. Minor bull trend line needs to break and market has to trade strongly below 1h 20ema for this to turn bearish. Above 18700, odds favor bulls for 18770 or higher again.
medium-long term: My long term outlook stays bearish and I expect at least a -20% correction in 2024. Medium term is 17100 while I think we can touch the big bull trend line starting 2022-10 around 16700 in 2024. —unchanged
current swing trade: Short since 18700, added to shorts 18900. Will hold this till Cathy closes ARKK or the big short 2.0 is announced. —unchanged
trade of the day: Tough. Any buy around 1h 20ema was good. Bulls made a 100+ ripper but bears quickly sold it, so you had to take profits and keep tighter stops.
FDXM1! trade ideas

2024-07-22 - priceactiontds - daily update - daxGood Evening and I hope you are well.
overall market comment
Indexes pulled back as expected and laid out in my weekly post yesterday. Although a bit stronger and faster than I expected. Dax for example already reached it’s 50% pullback to the tick and bears want this to be the high and reverse hard from here.
Commodities - Gold is also trying to find a bottom after the big rejection. Doji on the day so no deeper analysis needed. Set alarms when market breaks above or below today’s range.
Oil bears tried the follow through selling but bulls actually closed the day above the minor bear trend line support again. So bears are not as strong as they could be. Still lower lows and lower highs.
Bitcoin - BTFD in full force, Doji on the daily. No deeper analysis, bulls are in control, please read my weekly post.
dax futures
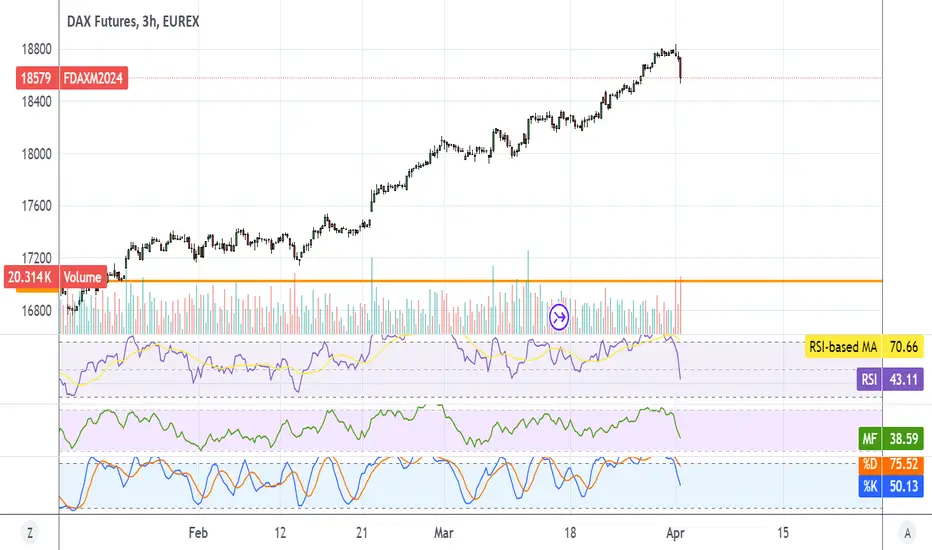
comment: 18600 is my line in the sand for bears. If they keep it below, odds are good, that we are in a bigger down move. If bulls continue up, it’s a triangle on the daily chart and we can expect more sideways movement.
current market cycle: trading range
key levels: 18300 - 18700
bull case: Good bounce by the bulls today and they closed at the highs. They expect follow through buying tomorrow and if they can a 1h close above 18600, many bears will give up on a new bear trend and stronger selling. Market did not have a candle close below the 15m 20ema today. Find those ema early in the day and grind them up or down.
Invalidation is below 18500.
bear case: Bears stopped the market at the absolute last point to keep the sell off thesis alive. 50% pb was hit to the tick. They need a strong overnight reversal or early in EU session. So probably more upside above 18620 and down again below 18500.
Invalidation is above 18620ish.
short term: Full bear mode to hell. Shorter shorty term is neutral as stated above. Bullish scalping above 18620 and full bear below 18500 again.
medium-long term: My long term outlook stays bearish and I expect at least a -20% correction in 2024. Medium term is 17100 while I think we can touch the big bull trend line starting 2022-10 around 16700 in 2024. —unchanged
current swing trade: Short since 18700, added to shorts 18900. Will hold this till Cathy closes ARKK or the big short 2.0 is announced. —unchanged
trade of the day: Long bar 32. Strong breakout of prev range and market never looked back.

#202430 - priceactiontds - weekly update - dax futuresGood Evening and I hope you are well.
Quote from last week:
bear case: Bears are at the exact same spot as last Sunday but just a tat higher. They want a big reversal again at multiple resistance above 18800. They also see all the rejections from the past months at this level and shorting here has been very profitable. They also know it’s a bad buy for the bulls up here. Odds clearly favor them to trade back to at least 18600 but we will probably see 18500 early next week.
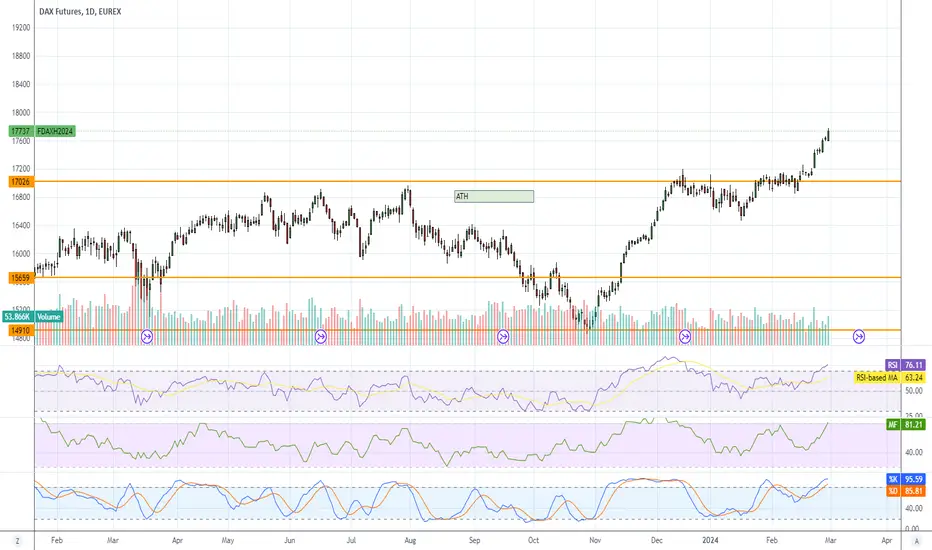
comment: Bears took complete control of the market after the lower high 18927 which formed a perfect head & shoulders pattern. The Measured move down is around 17000 and I expect that price to be hit in 2024. Last bull trend line before the big one from 2020 & 2022 and I expect it to be broken over the next 1-3 weeks. The upcoming pullback is the most important part now because the height will determine the strength of the next bear leg and if this a new bear trend or not. If bulls get above18600 again, there is a decent chance we are still inside a big trading range. If bears keep it below the daily 20ema, we will most likely form a proper channel we can grind down over the next months.
current market cycle: trading range - go look at the monthly chart. It’s a clear 4 month trading range. —unchanged
key levels: small range 18000 / 18900
bull case: Bulls and bears alike knew the recent high at 18900 was a bad buy and they tried to save their bull case on Tuesday but once Wednesday came around and 18700ish was resistance the third time, they gave and we only produced lower highs since. Best bulls can hope for now is to keep it above 18000 and bounce at the weekly 20ema which is exactly right under Friday’s close and that the bull trend line from April will hold. Market expects a pullback and bulls want it to go above 18600, which increases the odds of this being a continuation of the triangle, rather than a new bear trend.
Invalidation is below 18147.
bear case: Bears are in full control and want a lower low below 18148 to break the bull trend line. The recent selling was strong enough for a second leg but I think a pullback is expected after Opex. Also very strong selling on much greater volume. Any pullback should stay below 18600.
Invalidation is above 18650/18700, but that is pure guesswork. Need to see a bounce first. In general, if a pullback goes beyond the 50% mark, it’s hard to argue for a strong bear trend.
outlook last week:
short term: Bearish at least to 18500. It’s 50/50 if bulls can do a higher high or will only print lower highs from here. Looking for early weakness and then at 18500 absolutely neutral and let the market decide where it wants to go next. Any bad Dax earnings next week will probably flush it below 18500 again.
→ Last Sunday we traded 18857 and now we are at 18298. High of the week was 18889 and the low was 18274. Gave you 18500 and you got 18274. That’s 585 points from last Friday’s close. Hope you made some.
short term: Full bear mode. Will try to catch the bounces as good as one can but the big money will be made to the downside over the next months. Short term we will see a bounce that should stay below 18500/18600 and from there I expect another big leg down to 17800.
medium-long term: Time to update this section. I called for 17000 for couple of months now and I said, any short around or above 19000 is amazing. The highs held and now we will see how low we can get in 2024. 17100 is still my first bigger target and should be reached in 2024. At this point it does not make sense to call lower targets.
current swing trade: Short since 18700, added to shorts 18900. Will hold this till Cathy closes ARKK or the big short 2.0 is announced.
Update: Will post also some profit taking and adding to the position again. On Monday I plan to look for strength and take about half off and to add again around 18500 or higher.
Chart update: Be reminded, that I switched from dax cfd to dax futures.
Removed all the bullish lines except the two main trend lines. On from April and the one from 2020. Put text on the shs pattern and added a fat bear trend line from ath to the recent lower high because that’s the triangle we are currently in and about to find out of the bottom will hold.

2024-07-17 - priceactiontds - daily update - daxGood Evening and I hope you are well.
overall market comment
Indexes all read except DJI. Given the overbought conditions especially for the russel, tis was expected. Tech selling continued and is accelerating. For Nvidia all but 1 remaining bull trend line are broken and if bears can close the gap down to 114, they can probably print 100 over the next weeks. My measured move target 96 is from 2024-07-06. Selling today was strong enough to expect more tomorrow, especially going into the weekend.
Commodities - Gold printed a rather neutral doji on the daily chart after a new ath 2488. Will we sell off from here or can they go 2500? I don’t know. 2500 is an obvious magnet but Opex is around the corner and maybe too many yolo’d into 2500 calls.
Oil got the expected bounce to 83, which I have been writing about since Sunday. Buying was strong enough for follow through tomorrow but bears need to keep it below 84 or this is not a pullback anymore.
Bitcoin - Market has still not touched the 4h 20ema since Saturday. Very strong buying by the bulls but it gets weaker. I don’t know if they can break out above again without a deeper pullback first. It’s also very bullish, that nasdaq sells off while btc stays above 62000. Should only look for longs as long as market stays above the 4h ema.
dax
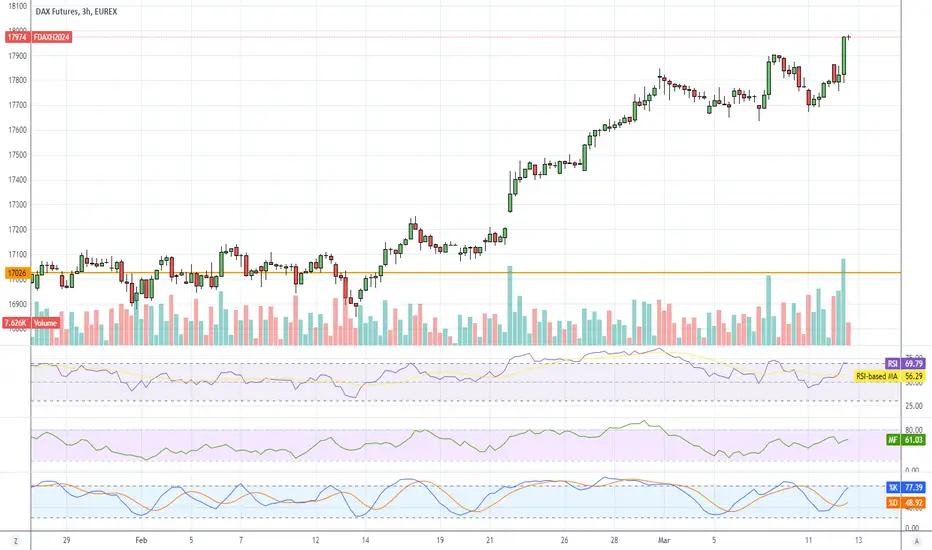
comment: Will change from dax cfd from EasyMarkets to dax futures from now on. Market opened below y close and quickly filled the gap before bears took over and grinded it down. 18500 was bought as expected but the two legs up were so strong, that bears did not try to force another test of 18500 and market went mostly sideways, which is a neutral signal going into tomorrow. The bear channel is holding properly but bears would need a weekly close below 18500 for more selling next week. Market has formed a triangle with the bull trend line and the most recent bear channel resistance line and market will break out tomorrow.
current market cycle: trading range (triangle on the daily chart - technically bears traded back into the triangle)
key levels: small range 18500 / 18900 - If 18500 is broken for good, next support is 18360
bull case: Bulls bought where they had to and stopped a bigger sell off. They need to break the bear channel for another test of 18900 or higher. They bounced at the daily 20ema yesterday and today they closed above it again, which means that bulls are technically still in control but if they do not reverse it tomorrow, it’s night night.
Invalidation is below 18500.
bear case: Bears now had 3 decent legs down to 18500 and market then oscillated around the 50% pullback from the recent bull trend, which is 18570. As long as the bears keep it mostly below the 1h 20ema and inside the bear channel, they are good and market will continue down. Their target is a weekly close below 18500, which would make most bulls cover and it would be a strong sell signal going into next week.
Invalidation is above 18720.
short term: Neutral between 18500 - 18650. Bearish below and bullish only on a strong break above the bear channel.
medium-long term: My long term outlook stays bearish and I expect at least a -20% correction in 2024. Medium term is 17100 while I think we can touch the big bull trend line starting 2022-10 around 16700 in 2024. —unchanged
current swing trade: Short since 18700, added to shorts 18900. Will hold this till Cathy closes ARKK or the big short 2.0 is announced. —unchanged
trade of the day: Longs from the strong open were decent but you had to think fast. After the gap close market quickly reversed and since it reversed right at the 1h 20ema, that was your hint to look for shorts next time market gets near it.

DAX LONG The DAX Future, after 2 days of high volatility, created a High Value Area with POC at 18,082. Today, this level was strongly felt, first with a false breakout, then with an upward break followed by a retest. All framed in a more macro picture in which the price has broken the minimum of the regression channel monitored by me. Tomorrow it is likely that the price will test the next HVA at the 18,300 level. June is a statistically negative month for the DAX which has had negative performances between -4% and -10% in 17 of the last 24 years. For this reason I wouldn't go for more ambitious TPs. Hello everybody

FDAX UpdateNot sure about US market gap direction tomorrow, so looking at FDAX. Not oversold yet, so another Euro selloff could cause US markets to gap down tomorrow.
Decided not to go long yet, probably tomorrow.
Dax Futures SellLiquidity sweep from the day before leaves price targeting daily lows & liquidity. Price to seems to be creating inducement . Stopping out retail once again before the final move down. TP @50% of the daily liquidity pool

DAX Analysis - Continuous, Just as the Markets !This is a Thread, so Follow for Technical Analysis performed with TrapZone Pro & UMVD Indicators.
* Trend is Based on TrapZone Color
* Bar Colors give us Momentum Green from strong Up Moves. Red Bars point to strong Down Moves.
* Red UMVD = Selling Pressure & Green UMVD = Buying Pressure. Purple is for Divergence = Battle of Supply & Demand
>> USE PAGE DN to go DOWN To the LATEST Post <<
--------------------
2-25-2024
Strong Upside Momentum with wide GREEN TrapZone established now and GREEN UMVD continues. Class A Entry at the top of the TrapZone.

FDAX UpdateI feel like there's a high potential for a gap down Monday for US market if Europe rolls over, FDAX indicators pointed in that direction.
Not worth the risk, staying cash.

No tickcharts availabe for years now. It's a shameNo tickcharts availabe for years now. It's a shame

FDAX UpdateOverbought and at ATH.
I think there's a good chance the market gaps down Monday, but can't really short anything because NVDA appears to be melting up.
You can tell some of the traders and algos did a pump and dump on the gap up this morning, but not enough of them to make it worthwhile to short the market yet. I'd like to see the algos dump on indicators instead of inflation news before I start shorting stocks

FDAX UpdateDAX hit overbought and rolled over on the 3 hr. Monday is a holiday for us but not for them.
Chance of a gap down Tuesday, I do not recommend holding a long position this weekend.
I bought a few puts, just beer money bets for now.
Germany [Large Cap EU] vs. USA
This seems to be more difficult for me. I like to discuss this one.
You can see converging lines, but they were converging even more months to years ago.
There was a quite strong spring. It has been tested strong but remained strong untill march 2023, when the banking crisis started. next week a lot of folks are looking at the ecb.
The testing of the clear down channel triggered a very strong down move which is still intact and shaked as well as cutted the VPOC (volume point of control). As of friday there was a week close below the channel. The bears are leading this one down, but there is a possibility of a upward reversal. The up move went to 150 % fibonacci, so the establishing bullish channel is quite strong .
Good look for all of you, trading stocks from europe !
I am in ETFs from Europe .

FDAX TRIANGLE LONG SIGNALThe big difference between an active private investor who makes losses and a successful professional trader is the discipline factor. As a rule, it is not due to a lack of knowledge on the part of the private investor, but rather the sudden change from one technology to another. A professional trader who does not stick to the trading plan will fall out of favor with his superiors, even if the trade was profitable. A retail investor often has difficulty sticking to his own trading rules or systems when things get exciting. Discipline prevents emotions such as fear and greed from taking over. Support clear rules for the profit and loss statement.

FDAX LONG SIGNAL TARGET ZONEThe basic idea of swing trading is a combination of bottom fishing and trend following strategies. The investor acts strictly trend-following by acting exclusively in the direction of the prevailing trend and taking advantage of entry opportunities where the price is close to the technical chart guidance line that accompanies the trend, be it a trend line or a moving average. He is betting that this guiding light will once again become a springboard for a new trend impulse. The advantage of swing trading is that the investor enters close to the zone that is crucial for the trend and is therefore able to work with tight stop prices.

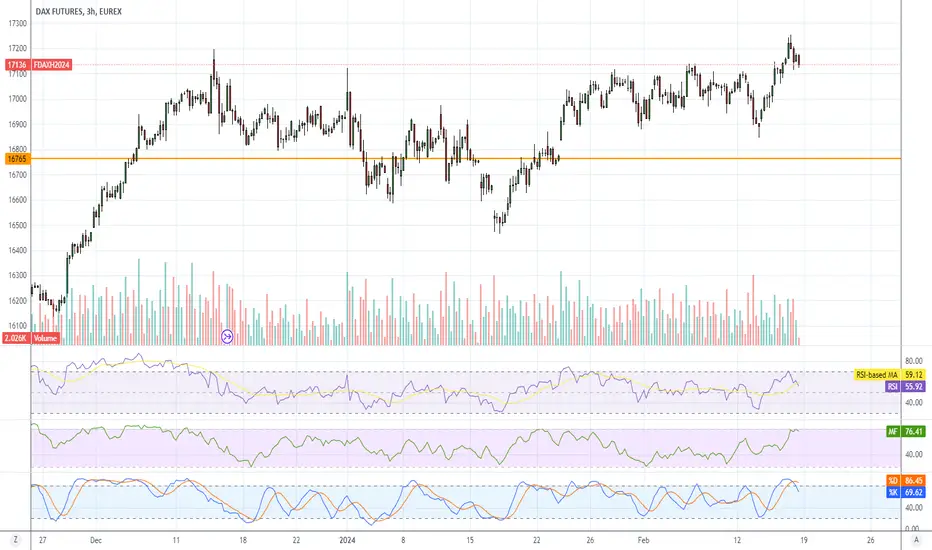
DAX - those EMAs last intersected on November 6thHello Traders,
Following the New Year, the DAX has tempered its upward momentum. After the first significant correction in a long time, resulting in a 3.4% drop from the all-time high.
The price has fallen below the 32 EMA and the 82 EMA on the 4-hour time frame, leaving it sandwiched between the 200 SMA and the remaining pair of EMAs. The last time these two averages crossed was on November 6th, and today they intersect again for the first time since that period. Could this signal a weakening of the trend or even a reversal? Currently, I expect consolidation at these levels as the market seeks acceptance. However, in my opinion, the key will be the 16600 level. If it is positively accepted and the price bounces off from it upwards, I would anticipate a natural continuation of the upward trend.
Conversely, if the price breaks through this average at the 16600 level and is accepted from below, a reversal of the trend downwards is likely. In this scenario, I would consider short positions in the range of 15774 to 15352.

Intraday long DaxPoor high and excess at low of previous day market profile. 30min symmetrical triangle. Will watch OBV to confirm move/breakout. FED day so possibility for choppy price action.
Same course of action if price is to break to the downside of the pattern, potential to fill small volume cave.
Would likely execute with time filter

CVD still bullish This bull run is going to run out of stream real soon,
Just PA and VP alone.
I still see a lot of aggressive buying on the CVD so I'm going to take my chances at a minor POC above

FDAX UpdateThis selloff appears to be confined to the US indices today. Strange.
I think earnings have more impact than FDAX, not gonna post FDAX again until after AAPL reports next week.
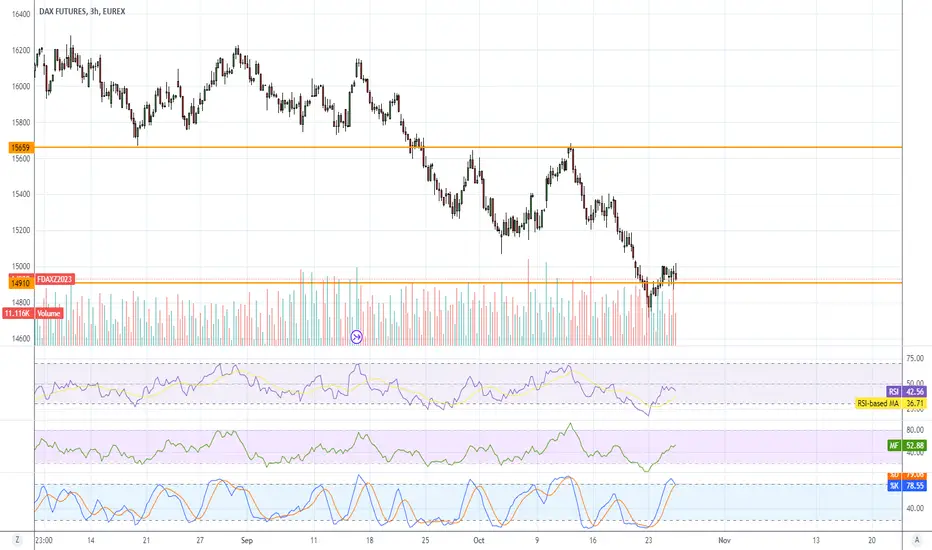
Critical 4 weeks for DAX Following weekly chart.
The last time when I get a short signal to in weekly chart was 4 weeks before COVID crash. (red area in the chart)
Now I got the same signal and unfortunately this is the most trustworthy signal for me.
I think this 4 weeks are really critical and what I expect is we might way to go to gaps below.
Be careful and be careful!
