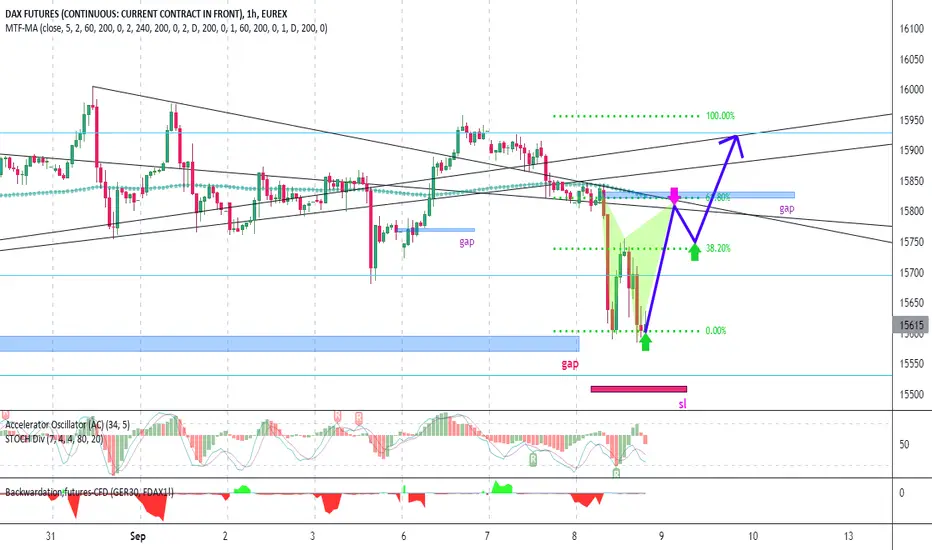
as predict in low ,dax going to fill gap yesterday dax touch fibo 61% and cant fill gap( cash phisical xetra dax) on 15818 , for today it must fill gap and go upper to touch 16000
ALERT=FIBO 161% SHOW DAX TARGET 16300 , BE CAREFUL FROM SELL,100% PUT SL =40
ALERT=AX 4HOUR IS FULL GREEN
FDXS1! trade ideas

still dax gap is open, will fill soon let see cash xetra dax (frankfurt phisical index) it show gap must fill soon or late
AC is red ,when turn green looking for buy in deep
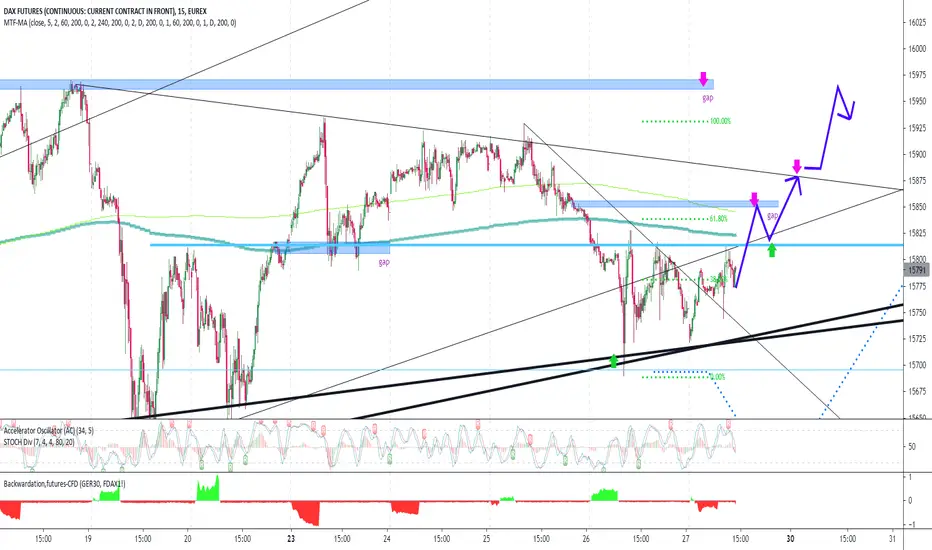
ALERT=if dax break gap in 15800 can fly up to 16100 to 16300, we dont advice pick sell ,specialy dax30 going to add 10 big company will turn to dax 40, it will increase dax price

Supply and Demand patterns scanned automaticallyVery often the main issue for traders is to just on time (quickly?) spot on chart correct patterns that may warn traders about incoming to market Supply or Demand. Everyone tries to catch reversals as this is beginning of potentially long new trend. And asking yourself try to answer honestly to yourself - how often you skipped the move because you didn't notice it at first glance and only it was visible to you AFTER the move happen, when you revisited chart and tried to take lesson learnt from chart and wondering why you didn't enter trade that time..
There could be a lot of reasons of that but one of main that I try to fight is - eliminate subjectiveness. Therefore still I don't automate trading, but try to get potential signals identified by software. After multiple months of research and work, I modified original VSA approach and prepared better version of definitions combining knowledge and tips from multiple VSA Experts. That's how software was created and is learnt to identify Demand and Supply Signals automatically notifying me via alerts/notifications about potential trades. When we add to those signals automatic drawing of Volume Zones, we have complete trading system. Especially during first retest Volume Zones works like a charm when there's perfect opportunities to enter trades in original direction of first breakthrough.
On chart I also marked recent examples of Demand & Supply signals that were identified by Scanner BEFORE the trend move happened. Still judgement of trader (manual) is needed but Scanner gives already big edge on market. Combining this with Volume Analysis known from VSA approach and with knowledge about basic market structures, there's no other option than become profitable trader. Of course if you follow your own trading rules and properly manage money alongside with Risk:Reward ratio.


15800 support break ,dax can see 16255(fibo 161%)
see AC (accelator occilator is stochastic 7.4.4 brother) ,it did it's job well in this week(on dax AC on 30-240 min chart is very important .... on gold :60-1440min chart)
see 4 hour chart, compair AC and stoch(if you are new user of AC dont trade with it,you must monitor it to see its secrets,reactions)
ALERT=DAX30 GOING TO ADD 10 NEW BIG COMPANY(LIKE AIRBUS) IN NEXT DAYS, DAX40 MEAN INCREASE DAX VALUE ,CAN MOVE DAX TO 17000
www.dw.com


fibo 61% is dax next target now dax have powerful buy , it can see 16000 (even 16100) again soon
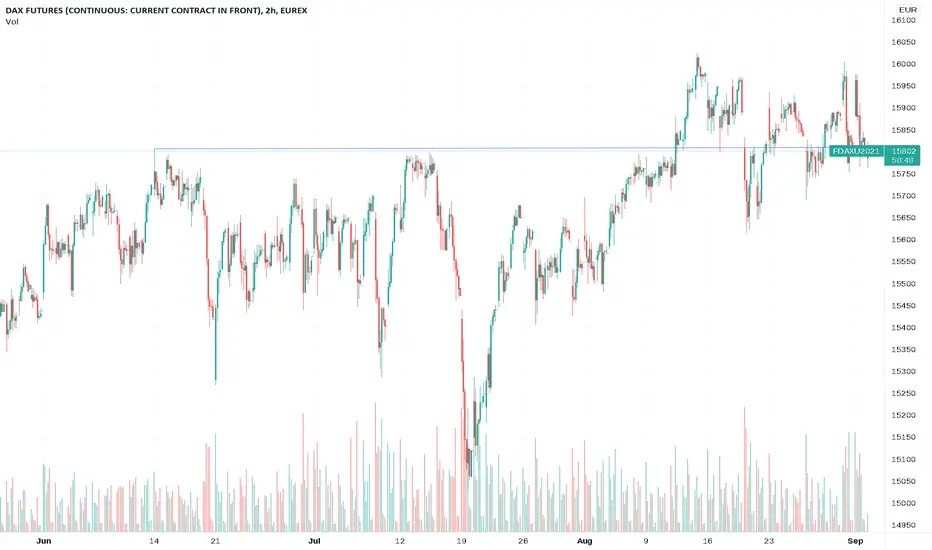
note=on cash xetra dax we have open gap near 15830, soon or late must fill DEU30
Resume ShortShort FDAX 15700. The rebound could end here or a bit higher. Resume the fairy tale trade.


news on tapering delay,move dax,dow up but we have gapbe careful ,stil dax can go down to 15570(gap on cash xetra dax) we still see sell on dax (until uper trend break near 15900 , then dax signal is buy ,can go to 16100)
westpaciq.westpac.com.au

dax will go down to 15570 to fill old gap in coming days ,dax target is fill gap (cash xetra dax gap) then little by little will go up to touch 16100(new high)
arrow=best order place with sl=40 or last high,low
yellow fibo = trend base fi'bo extention (projection)
on daily chart on cash xetra we have high volume=trend change signal
prnt.sc
larg banks(cfd brokers liquid provider) and big fund managers start sell dow futures (dax and dow similar and brother)
prnt.sc
i wish you success ,this is my workplace link
www.tradingview.com
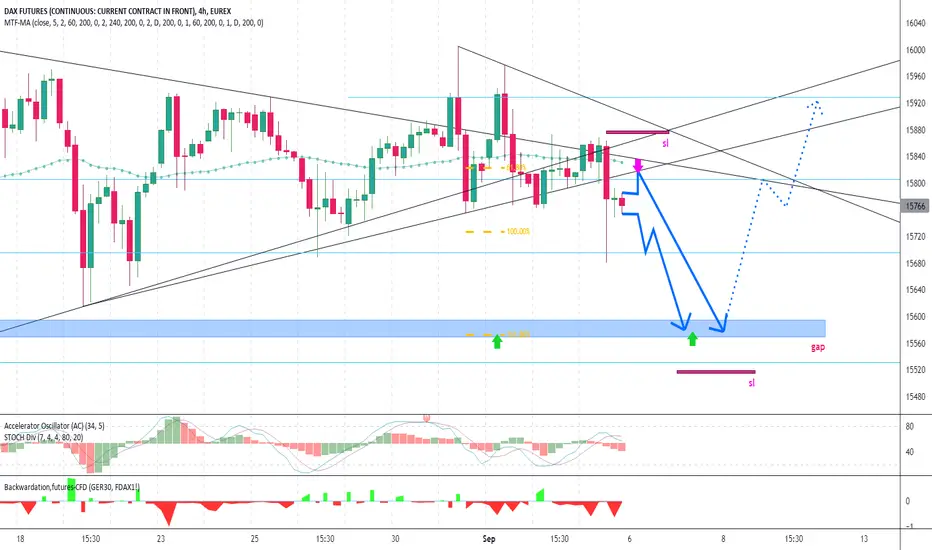
Snooze is overSeptemer has begun, time to wake up! The fairy tale was really drowsy but September usually wakes us up from these sweet dreams. Short FDAX 15930.

Options flow as early call forecast in Intraday TradingOptions flow gives big edge on market, very often predicting moves before they happen on Futures instruments. By applying custom indicators reading Options flow data, it is possible to receive levels that can play important and leading role in Intraday Trading. When we add to this basic understanding of market mechanics, then we can have significant edge in trading. Still this is not Holy Grail, but though accurate strategy. All potential moves are explained and described on charts. Enjoy!

Fairy tale worldWhen I listened to Powells Jackson Hole speech it sounded to me like grandpa reading from a happy ending fairy tale. The market liked it. Will some people wake up from this fairy tale after the weekend? Short 15850

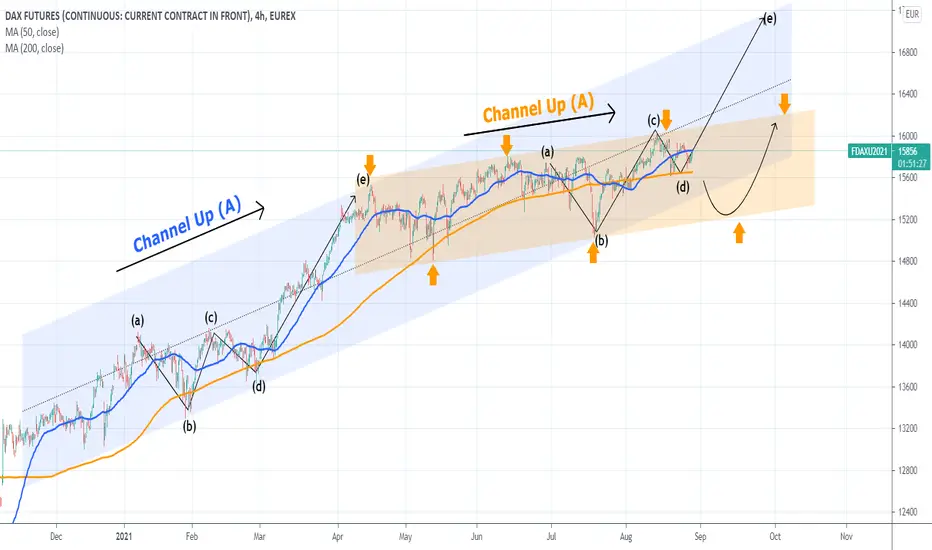
DAX Which Channel will prevail?DAX is ahead of critical crossroads as the long-term Channel Up (blue) that was formed after the November 2020 U.S. elections is on its last leg (d) before the aggressive rally that last time (March-April) led to leg (e).
If this pattern is not repeated, then there is a new Channel Up (orange) that may continue this uptrend but in a more controlled, less aggressive manner. I believe that the signal for this will be a closing below the 4H MA200 (orange trend-line).
Which Channel Up do you think will prevail?
** Please support this idea with your likes and comments, it is the best way to keep it relevant and support me. **
--------------------------------------------------------------------------------------------------------
!! Donations via TradingView coins also help me a great deal at posting more free trading content and signals here !!
🎉 👍 Shout-out to TradingShot's 💰 top TradingView Coin donor 💰 this week ==> nevada999
--------------------------------------------------------------------------------------------------------
27 August friday: we have gap on 15850 as target on cash xetra dax DEU30 we have open gap ,must fill
red arrow on chart = dax targets
AC 4hour is green now= up trend can come
DAX: Here Comes the BOOM! ☄️☄️☄️ The German DAX is set to enter the yellow trading zone. We expect the DAX to fall between 15530 – 15140 points, before starting another bullish rally. However, until then, it needs to stay away from the resistance at 16024 points.
Be prepared!

26 August :2 scenario on germany dax daxbad news in morning push dax down ,we have open gap in 15570
always my sl on dax is last low or 40 point

look at germany index, cash dax , 17000 is next target look at cash xetra dax ,trade phisicaly in frankfort (only gap importnt on cash dax,trends ,supports not important)
ALERT=17000 IS DAX NEXT TARGET ACCORDING WEEKLY CHART FIBO 161% , FOR SELL 100% PUT SL,NEVER REMOVE ,DAX CAN FLY UP EACH SECOND

FDAX intraday 25 VIII 21 - Bearish structure Expecting some bearish momentum, that's why I'm looking for Short setups only today.
The best area which offer excelent R:R are levels around supply zone.

25 August wednesday: on dax , AC and stoch 4hour is red 16000 and 16200 is buyer target
in next hours dax can go down,in green arrow( we must put buylimit with sl=40 point
buystop on yesterday high is possible (dont pick sell under 16000)
enjoy bull market in 2021-2022 =buy in deep ,hold 4-5 day ,close on high
