EURJPY: TGIF setup 3same quoted currency, I used the same strategy to test on this Friday JST time. currently all blue but I will see how London open.
#propfirm #100K
EURJPY trade ideas
EURJPY – Technical Outlook & Strategic Perspective (Apr 29 – May
📊 EURJPY
Over the recent sessions, I’ve identified an interesting structure forming on the **EUR/JPY** pair, pointing to a potential **short-term bullish move** over the next **2 to 3 days** before a possible trend reversal starts to materialize.
My bias is based primarily on the **presence of Fair Value Gaps (FVGs)** that have yet to be filled. These imbalances suggest the market may seek to revisit these zones to balance liquidity. Additionally, there are clear signs of buyer defense in a sensitive price region, reinforcing the thesis of a **technical recovery** before any long-term directional decision.
🧠 :
- Support zone respected after selling pressure eased.
- FVGs identified in alignment with a potential pullback structure.
- Expectation of a bullish move toward upper liquidity zones, with partial TPs set near **162.546** and extended targets around **163.770/163.776**.
🎯 **Plan:**
- Entry already triggered upon confirmation.
- Stop-loss safely placed below recent swing low (161.770).
- Take Profits aligned with FVGs and a risk-to-reward ratio of over 1:2.
🔎 *Strategic Note:* Once these value zones are filled, I’ll be closely monitoring for **Change of Character (CHOCH)** signals that could confirm the start of a new cycle on the pair. For now, my focus is on **gap-filling and market equilibrium** before any long-term directional play.
📍Posted by: Emerson Massawe
Trader | Strategist | COO of Rodaviva | CEO of Xerof Capital

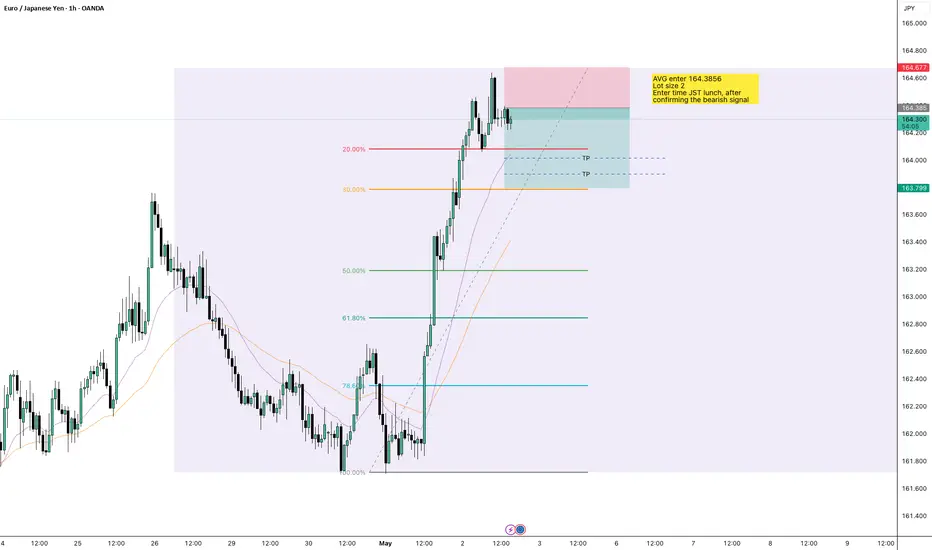
EURJPY 4H Chart: Breakout or Reversal? My Full Plan Inside!
📈 EURJPY 4H Chart - My Trading Plan
In the EURJPY 4-hour chart, I observe that the trend is moving higher, clearly visible when connecting the recent highs and lows with a manual zigzag line.
A critical zone is forming around the Double Top near 164.00 , which also acts as a strong supply area.
This is the major challenge ahead: for the bullish trend to continue, price must break and hold above this 164.00 resistance.
However, based on the current momentum, I believe the bulls have enough strength to push beyond this level.
🛡️ Role of Support Line
I have drawn the support line to highlight a potential reversal zone.
If the price fails to break and sustain above 164.00 and instead drops below the support area, it will signal that the double top resistance has held strong, and a deeper pullback could follow.
📊 RSI - Crucial Momentum Signal
The RSI remains above the 50 line and has not dipped below the 30 oversold level since it last touched the 70 overbought zone on March 5th.
This ongoing bullish momentum in RSI supports the idea of a continued uptrend.
🔢 Fibonacci Levels - Target Zones
I have drawn the Fibonacci extension from the recent swing low to high.
If the bullish continuation unfolds, my next key upside targets are:
- 165.350 (1.618 Fib) — Expect 1
- 166.368 (2.0 Fib) — Expect 2
🧠 Plan B - What If I'm Wrong?
If the price fails to break 164.00 convincingly and then breaks below the support line , I will prepare for a reversal trade.
In that case, I plan to double or even increase my lot size to recover any prior losses.
Although this is a higher-risk approach, I have confidence in my strategy.
Let’s trade with discipline and manage risks properly. Let's begin! 🚀

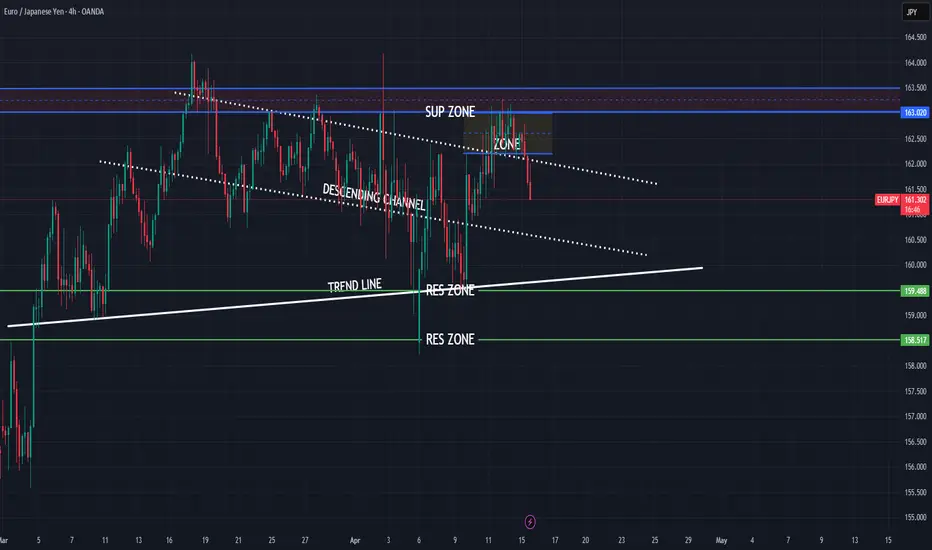
EURJPY strong bearish expectations
OANDA:EURJPY strong bullish expectations i am have, but things will not go like expected..
Currently price in DESCENDING CHANNEL, in moment we are have break of same, but price is make revers in zone and pushing now bearish.
Here now exepcting fall till trend line.
SUP zone: 163.000
RES ozne: 159.500, 158.500
EURJPY hit TP within 16 minutes.Yes! I love the EUR :) The signal I shared just moments ago has reached Take Profit. You can still wait for the other TP levels to be hit. That’s enough for today.
🔔 I post detailed trade ideas and daily market analysis like this every day on my TradingView profile.
👉 Follow me to get notified and read the full breakdowns.

EURJPYEUR/JPY Rate Differential and Fundamental Outlook for May 2025
Interest Rate Differential
ECB Main Refinancing Rate: 2.40% (after a 25 bps cut in April 2025).
BoJ Policy Rate: 0.50% (held steady in May 2025).
Rate Differential: 1.90 percentage points (EUR yield advantage).
This gap supports EUR/JPY upside, but the ECB’s easing bias and BoJ’s cautious stance suggest potential narrowing later in 2025.
Key May 2025 Fundamental Drivers
Eurozone (EUR)
GDP Growth:
Eurozone GDP grew 0.4% QoQ in Q1 2025, with Germany expanding 0.2%.
Resilient growth reduces urgency for aggressive ECB easing but does not halt the dovish trajectory.
ECB Policy Outlook:
Markets price in a 25 bps ECB rate cut in June, with further easing expected in 2025.
ECB remains data-dependent amid trade tensions and moderating inflation (2.1% in Germany, 0.8% in France).
Japan (JPY)
BoJ Policy Stagnation:
BoJ kept rates at 0.50% in May, citing risks from U.S. tariffs and downgrading 2025 GDP growth to 0.5%.
Core CPI forecasts trimmed to 2.2% for 2025 and 1.7% for 2026, delaying hawkish shifts.
Trade War Risks:
U.S.-China trade de-escalation optimism reduces JPY’s safe-haven appeal, but Japan’s export reliance keeps growth vulnerable.
Global Factors
Risk Sentiment: Easing U.S.-China tensions favor risk-on flows, weakening JPY.
Fed Policy: Delayed Fed cuts (4.50% rate) bolster USD, indirectly pressuring EUR/JPY via EUR/USD dynamics
ECB Rate Cuts (Expected) Bearish for EUR (narrows rate gap)
BoJ Dovish Hold Limits JPY strength, supports EUR/JPY upside
Eurozone Growth Resilience Mild EUR support, delays aggressive ECB easing
Trade Optimism Risk-on sentiment weakens JPY, bullish for EUR/JPY
Japan’s Growth Downgrade JPY weakness on economic concerns
Base Case:
EUR/JPY likely trades with a moderate bullish bias in May, supported by
The still-significant rate differential (1.90%).
Risk-on flows amid trade de-escalation.
BoJ’s growth and inflation downgrades limiting JPY strength.
Downside Risks:
Surprise ECB dovish rhetoric or faster-than-expected rate cuts.
Escalation in U.S.-Japan/EU trade tensions reviving JPY safe-haven demand.
Summary
The 1.90% rate differential and improving risk sentiment favor EUR/JPY gains in May, but the ECB’s easing trajectory and Japan’s structural challenges create volatility. Traders should monitor:
ECB June Policy Signals (potential 25 bps cut).
Eurozone Inflation Data (May 30–31).
BoJ Rhetoric on tariffs and growth.
While near-term upside persists, the pair’s longer-term outlook remains bearish as ECB cuts erode the rate advantage.

Trendzilla vs Chop Kong (EUR/JPY)The bias for EUR/JPY - in our view - is higher
On the weekly timeframe:
A) WMA has flattened out and price held above it B) downtrend line broken and held
On daily timeframe:
EUR/JPY just broke resistance for possible breakout trade up to the olf high to 166 - and possibly beyond
Thoughts ?

EURJPY- Possibility of a short
- rejected 3 times from the 4hr Supply zone
- currently in a overall consolidation phase
- will it drop and test the demand zone?
EUR/JPY For Bullishwait for pull-back near by entry point and then go long
general trend is up trend
JPY under pressure
have fun :)

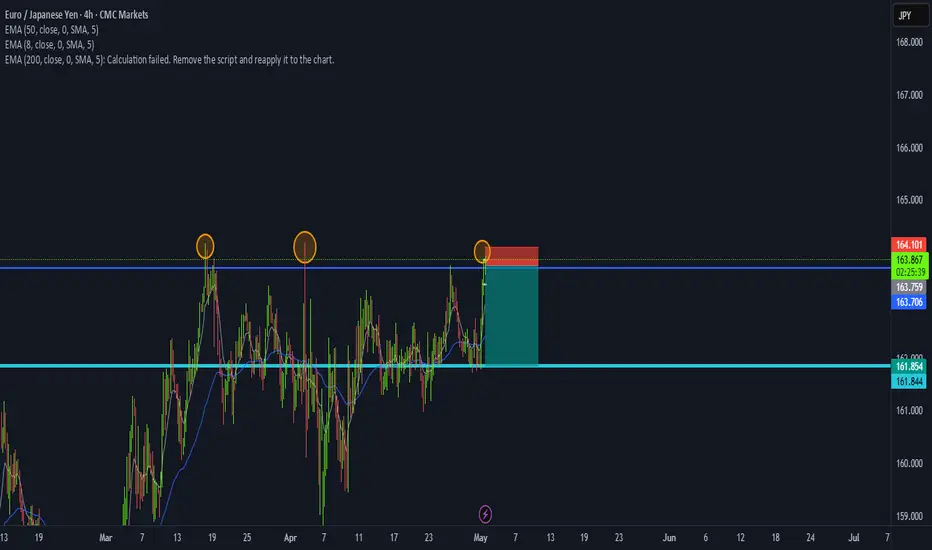
EUR/JPY for JPY Strength into BoJEUR/JPY has held resistance at a familiar spot on the chart, from the 163.00 level up to 163.38. This has been the same resistance that's held in the pair for the past seven weeks and for those looking for JPY-strength around tonight's BoJ rate decision, this can be an attractive venue. USD/JPY would have the complication of the 140.00 level which has been major support but for EUR/JPY, the broader context here remains digestion, with a descending triangle formation holding on the weekly chart. Key support for the formation is at 155.00 and logically the 160.00 level looms large for downside setups as that price held a pensive series of tests earlier in April. - js

EURJPY SellLadies and gentlemen, I’ve activated a sell position on EURJPY. The TP level looks quite promising. As shown on the chart, there are 4 different TP levels — feel free to adjust your trade accordingly. I’ll personally be setting my position with a 1:2.50 Risk-Reward Ratio.
🔔 I post detailed trade ideas and daily market analysis like this every day on my TradingView profile.
👉 Follow me to get notified and read the full breakdowns.

EUR/JPY BEARS ARE STRONG HERE|SHORT
Hello, Friends!
We are going short on the EUR/JPY with the target of 159.106 level, because the pair is overbought and will soon hit the resistance line above. We deduced the overbought condition from the price being near to the upper BB band. However, we should use low risk here because the 1W TF is green and gives us a counter-signal.
Disclosure: I am part of Trade Nation's Influencer program and receive a monthly fee for using their TradingView charts in my analysis.
✅LIKE AND COMMENT MY IDEAS✅

EURJPY Long 4/29/2025EUR/JPY Long – Weekly Bullish Engulfing + Double Bottom Off Demand Zone
Looking to go long EUR/JPY after a clean correction into demand and signs of higher timeframe bullish continuation.
Weekly Chart:
Last week printed a bullish engulfing candle that slightly broke out of the previous supply zone, suggesting early-stage trend continuation.
While we opened this week with a sharp sell-off (around 170 pips from the highs), price action shows it was corrective, not impulsive.
4H Chart:
Price is setting up a Morning Star formation — two hours away from confirmation.
If completed, it would signal a bullish reversal right off a critical structure zone.
1H Chart:
A double bottom is forming off a predetermined 1H demand zone — a key liquidity pocket I’ve been tracking.
Recent hourly candle gapped up, further suggesting buyers are starting to step in after soaking up sell-side pressure.
Trade Thesis:
Expecting a bullish reaction from demand and a retest of the previous highs.
This correction appears technical rather than fundamental — no steamy downside momentum despite the initial slide.
Risk-Reward Profile:
Target: Retest of the highs
R:R: 1:3.5
Stop: Below the double bottom structure
This setup blends clean structure with a higher timeframe bullish bias — looking for a continuation leg if momentum holds.

EURJPY Wave Analysis – 28 April 2025
- EURJPY reversed from resistance area
- Likely to fall to support level 161.25
EURJPY currency pair recently reversed down from the resistance area between the resistance level 164.00 (which has been reversing the price from January), upper daily Bollinger Band and the 50% Fibonacci correction of the downward impulse from July.
The downward reversal from this resistance area stopped the previous short-term correction ii.
Given the clear daily downtrend and the overbought daily Stochastic, EURJPY currency can be expected to fall toward the next support level 161.25.

TRADING RECAPKey Lessons On The Trade I Took And The Management As Well I Have Added Some Forecasting Video In This Recap On What I Am Watching For Tonight And Tomorrow Do Let Me Know How Do You Find This Video.

EURJPY BUY SETTUPI tried breaking this PEPPERSTONE:EURJPY analysis from dailytf till weeklytf and h4, pls take your time out to view the content of this post and see if this analysis is something that you may need. Thank You.

EUR/JPY Key Res TestEUR/JPY has been digesting for the better part of the past nine months. While both Euro and USD strength have been on full display in varying ways over that period of time, each currency has been a bit more balanced against the Japanese Yen.
The range has been wide at more than 800 pips but there's also a descending triangle that's set up along the way, with lower-highs around the 163.38 Fibonacci level and horizontal support around the 155.00 handle.
For those looking for Yen-strength, this may be a more attractive venue than USD/JPY at the moment, with USD/JPY holding below the key 145.00 psychological level. - js

EURJPY will continue rally upwardBased on technical analysis
1. Trendline broken
2. Rally-base-rally was formed.
I'm expecting the re-test of the base before it continue upward again.
i'm monitoring any reversal pattern in lower time frame.
Good luck and manage your own risk & reward.

EURJPY ANALYSISIn this video we see a break down of the pair coming into a new week after seeing last week close as a bullish engulfing and the structure on the 4hr showing HH and HL which is a confirmation of bullishness.

EURJPY TRADE SETUPWait for retest the entry level and bullish momentum candle then take a trade for Buy otherwise skip this setup

EURJPY Buys I am still bullish with EURJPY but I am expecting a bullish Monday to establish the weeks high and start declining from up there. Observe as the market open

Going short on this tradeThis market is going short. Its at a nice daily/ monthly resistance and its been hitting that area for while trying to break but i dont see a strong enough momentum to the upside. i took entry at 163.834 and hoping it drops down to 161.423 to 160.496 or further down . Another thing on the 4hr it did create a head and shoulder pattern which could mean she will have a nice drop so lets see what Ej does if she has a big drop or not .

158.500 or nothing I’m already in the EUR/JPY trade and waiting for price to reach my TP at 158.5. Everything’s lining up with my plan, now it’s just about staying patient and letting the market do its thing.
