EURNZD Bearish Reversal Confirmed: Break and Retest Below Key Su🧠 Market Context & Structure:
Trend Analysis: The pair is currently in a bearish structure. This is evident from lower highs and lower lows forming after a failed bullish breakout attempt.
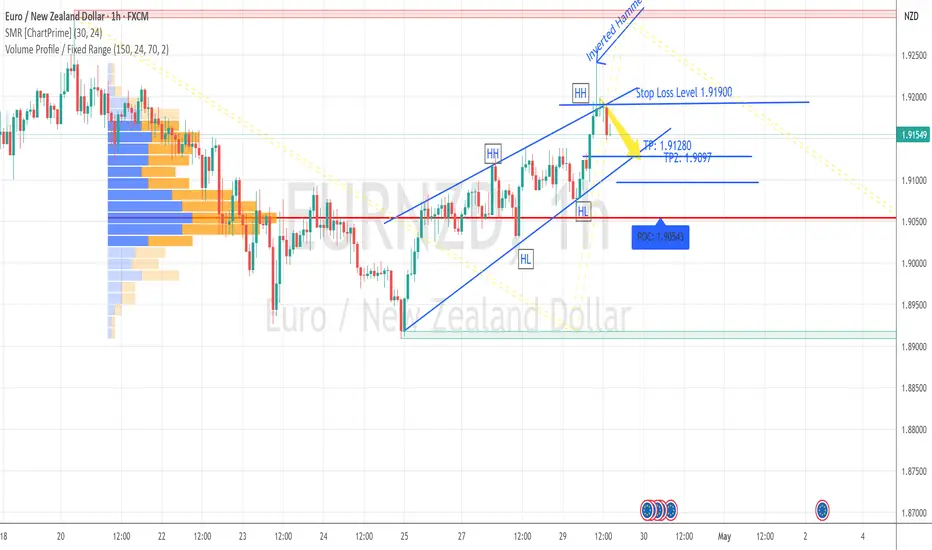
Key Zone: A supply zone (highlighted in red) around 1.90198 – 1.90750 has acted as a strong resistance. Price was rejected here after retesting.
Break of Structure (BoS): A clear bearish breakout below the ascending trendline and the horizontal support confirms a shift in sentiment.
📉 Indicators & Confluences:
EMA Analysis:
EMA 50 (red): 1.90757
EMA 200 (blue): 1.90728
Price is trading below both EMAs, which confirms bearish momentum. Also, a bearish EMA crossover (50 crossing below 200) may be forming or has just occurred — a death cross, which further supports downside bias.
🎯 Trade Setup Breakdown (Bearish Bias):
Entry: Around 1.89760 (current price)
Stop Loss: Above the supply zone (~1.9020 - 1.9070)
Take Profit Target: Around 1.86035 (highlighted in green), aligning with previous demand zone or measured move.
Risk-to-Reward Ratio (RRR): Estimated at ~3:1, making this a favorable setup.
🔽 Technical Patterns:
Bear Flag / Rising Wedge: The broken ascending pattern suggests a bearish continuation.
Retest Confirmation: Price retested the broken structure before continuing down — classic bearish retest behavior.
✅ Conclusion:
This is a textbook bearish setup supported by:
A failed breakout and structure shift
Resistance at a key supply zone
Break and retest of support
Price under both EMAs (bearish confirmation)
📌 Bias: Bearish
📌 Invalidation Level: Close above 1.9075
📌 Next Support Zone: 1.8600–1.8550 range
EURNZD trade ideas

EURNZD - The Bull of the Week!Hello TradingView Family / Fellow Traders. This is Richard, also known as theSignalyst.
📈EURNZD has been overall bearish trading within the falling channel marked in red.
However, it is retesting the lower bound of the channel acting as an over-sold area.
Moreover, the blue zone is a strong demand!
🏹 Thus, the highlighted blue circle is a strong area to look for buy setups as it is the intersection of demand and lower red trendline acting as a non-horizontal support.
📚 As per my trading style:
As #EURNZD approaches the blue circle zone, I will be looking for bullish reversal setups (like a double bottom pattern, trendline break , and so on...)
📚 Always follow your trading plan regarding entry, risk management, and trade management.
Good luck!
All Strategies Are Good; If Managed Properly!
~Rich
Disclosure: I am part of Trade Nation's Influencer program and receive a monthly fee for using their TradingView charts in my analysis.

EURNZD - Strong Intersection!Hello TradingView Family / Fellow Traders. This is Richard, also known as theSignalyst.
📈EURNZD has been in a correction phase trading within the falling red channel and it is currently retesting the lower bound of the bullish channel marked in blue.
Moreover, the green zone is a strong structure and support zone.
🏹 Thus, the highlighted blue circle is a strong area to look for buy setups as it is the intersection of structure and lower blue and red trendlines acting as non-horizontal support.
📚 As per my trading style:
As #EURNZD approaches the blue circle, I will be looking for bullish reversal setups (like a double bottom pattern, trendline break , and so on...)
📚 Always follow your trading plan regarding entry, risk management, and trade management.
Good luck!
All Strategies Are Good; If Managed Properly!
~Rich
Disclosure: I am part of Trade Nation's Influencer program and receive a monthly fee for using their TradingView charts in my analysis.

EURNZD On The Rise! BUY!
My dear followers,
This is my opinion on the EURNZD next move:
The asset is approaching an important pivot point 1.8946
Bias - Bullish
Safe Stop Loss - 1.8880
Technical Indicators: Supper Trend generates a clear long signal while Pivot Point HL is currently determining the overall Bullish trend of the market.
Goal - 1.9061
About Used Indicators:
For more efficient signals, super-trend is used in combination with other indicators like Pivot Points.
Disclosure: I am part of Trade Nation's Influencer program and receive a monthly fee for using their TradingView charts in my analysis.
———————————
WISH YOU ALL LUCK

EURNZD to find buyers at the current market price?EURNZD - 24h expiry
Offers ample risk/reward to buy at the market.
Buying posted close to the previous low of 1.8911.
1.8911 has been pivotal.
A Morning Doji Star formation has been posted at the low.
Price action continued to range between key support & resistance (1.9000 - 1.9250) and we expect this to continue.
Daily signals are mildly bullish.
We look to Buy at 1.8957 (stop at 1.8875)
Our profit targets will be 1.9205 and 1.9265
Resistance: 1.9047 / 1.9147 / 1.9265
Support: 1.8911 / 1.8850 / 1.8800
Risk Disclaimer
The trade ideas beyond this page are for informational purposes only and do not constitute investment advice or a solicitation to trade. This information is provided by Signal Centre, a third-party unaffiliated with OANDA, and is intended for general circulation only. OANDA does not guarantee the accuracy of this information and assumes no responsibilities for the information provided by the third party. The information does not take into account the specific investment objectives, financial situation, or particular needs of any particular person. You should take into account your specific investment objectives, financial situation, and particular needs before making a commitment to trade, including seeking advice from an independent financial adviser regarding the suitability of the investment, under a separate engagement, as you deem fit.
You accept that you assume all risks in independently viewing the contents and selecting a chosen strategy.
Where the research is distributed in Singapore to a person who is not an Accredited Investor, Expert Investor or an Institutional Investor, Oanda Asia Pacific Pte Ltd (“OAP“) accepts legal responsibility for the contents of the report to such persons only to the extent required by law. Singapore customers should contact OAP at 6579 8289 for matters arising from, or in connection with, the information/research distributed.

EURNZD Sellers In Panic! BUY!
My dear friends,
EURNZD looks like it will make a good move, and here are the details:
The market is trading on 1.8991 pivot level.
Bias - Bullish
Technical Indicators: Supper Trend generates a clear long signal while Pivot Point HL is currently determining the overall Bullish trend of the market.
Goal - 1.9076
Recommended Stop Loss - 1.8942
About Used Indicators:
Pivot points are a great way to identify areas of support and resistance, but they work best when combined with other kinds of technical analysis
Disclosure: I am part of Trade Nation's Influencer program and receive a monthly fee for using their TradingView charts in my analysis.
———————————
WISH YOU ALL LUCK

EURNZDPrices broke out of H4 support zone, made a retest and gave an engulfing candle. On the H1 it formed a bearish pennant and also broke out. Alot of bearish movements going on. Looking at 1.88000 as 1st target. Lets see what price does next.

EURNZD FORECASTLooking into EURNZD as the market is looking sharp I only wait to see if the market will give me an entry point in the lower timeframe. Higher timeframe is all looking very nice! Let's how this plays out.

EURNZD Technical & Order Flow Analysis (Swing Trading)Our analysis is based on multi-timeframe top-down analysis & fundamental analysis.
Based on our view, the price will rise to the monthly level.
DISCLAIMER: This analysis can change anytime without notice and is only for assisting traders in making independent investment decisions. Please note that this is a prediction, and I have no reason to act on it, and neither should you.
Please support our analysis with a like or comment!

EURNZD "Euro vs Kiwi" Forex Bank Money Heist Plan (Bearish)🌟Hi! Hola! Ola! Bonjour! Hallo! Marhaba!🌟
Dear Money Makers & Robbers, 🤑💰✈️
Based on 🔥Thief Trading style technical and fundamental analysis🔥, here is our master plan to heist the EURNZD "Euro vs Kiwi" Forex Market. Please adhere to the strategy I've outlined in the chart, which emphasizes short entry. Our aim is the high-risk GREEN Zone. Risky level, oversold market, consolidation, trend reversal, trap at the level where traders and bullish robbers are stronger. 🏆💸"Take profit and treat yourself, traders. You deserve it!💪🏆🎉
Entry 📈 : "The vault is wide open! Swipe the Bearish loot at any price - the heist is on!
however I advise to Place sell limit orders within a 15 or 30 minute timeframe most nearest or swing, low or high level for Pullback Entries.
Stop Loss 🛑:
📌Thief SL placed at the nearest/swing High or Low level Using the 4H timeframe (1.92500) Day trade basis.
📌SL is based on your risk of the trade, lot size and how many multiple orders you have to take.
Target 🎯: 1.88000
💰💵💸EURNZD "Euro vs Kiwi" Forex Market Heist Plan (Scalping/Day Trade) is currently experiencing a Bearish trend.., driven by several key factors.👇👇👇
⚠️Trading Alert : News Releases and Position Management 📰 🗞️ 🚫🚏
As a reminder, news releases can have a significant impact on market prices and volatility. To minimize potential losses and protect your running positions,
we recommend the following:
Avoid taking new trades during news releases
Use trailing stop-loss orders to protect your running positions and lock in profits
💖Supporting our robbery plan 💥Hit the Boost Button💥 will enable us to effortlessly make and steal money 💰💵. Boost the strength of our robbery team. Every day in this market make money with ease by using the Thief Trading Style.🏆💪🤝❤️🎉🚀
I'll see you soon with another heist plan, so stay tuned 🤑🐱👤🤗🤩

EUR/NZD SELLERS WILL DOMINATE THE MARKET|SHORT
Hello, Friends!
EUR/NZD pair is trading in a local downtrend which know by looking at the previous 1W candle which is red. On the 2H timeframe the pair is going up. The pair is overbought because the price is close to the upper band of the BB indicator. So we are looking to sell the pair with the upper BB line acting as resistance. The next target is 1.884 area.
Disclosure: I am part of Trade Nation's Influencer program and receive a monthly fee for using their TradingView charts in my analysis.
✅LIKE AND COMMENT MY IDEAS✅

Institutions Are Loading EUR/NZDIn the current market context, EURNZD is showing a highly compelling technical and fundamental structure for both short- and medium-term opportunities. After a prolonged retracement from the March highs, the price has strongly reacted from a clearly defined weekly demand zone between 1.8712 and 1.8600.
From a technical perspective, this reaction aligns with a moderate RSI divergence and a still intact macro bullish market structure, despite the corrective nature of recent weeks.
However, what truly validates this setup goes beyond price action alone. The latest Commitment of Traders (COT) data strongly supports the long thesis. On the euro side, we observe a significant increase in commercial long positions (+14,659 contracts), signaling institutional hedging activity. At the same time, non-commercials (speculators) have been cutting their short positions, suggesting growing expectations of euro strength.
On the NZD side, the picture is even more decisive: non-commercials maintain a net short position of -40,444 contracts, with a further reduction in long positions. The speculative sentiment toward the NZD is clearly bearish and shows no signs of short-term reversal.
Adding to this, retail sentiment data currently shows that 59% of retail traders are short on EURNZD. From a contrarian perspective, this is particularly bullish — the crowd is selling while smart money is buying.
Seasonality also supports the setup: historically, the months of May and June have been positive for the euro and negative for the NZD, adding an additional statistical layer of confluence to the trade idea.
🎯 Conclusion
We may be witnessing the early stages of a new bullish leg on EURNZD. The 1.89 area represents a potential re-entry zone in the event of a retest. The medium-term target is set between 1.9300 and 1.9500.
Technical structure, institutional positioning, retail sentiment, and seasonality all align in favor of a clear bullish bias in the coming weeks.

Eurnzd - LongHi team ,
For WK19 we have this EURNZD long
Patience is the key guys , nobody will give you 100% a month remember earning just 1% a month beats 99% of retail community
Thank you !

Bullish Look for potential Reversal bullish candlestick formation pattern upon the retest of daily demand zone.

EURNZD strong daily demand level at 1.89. Long biasSupply and demand imbalances are the driving forces behind price movements in the Forex market. By identifying these key zones or imbalances, traders can anticipate high-probability reversal or continuation setups. Today, we’ll analyze the EURNZD cross pair, which has recently formed a strong demand imbalance at $1.89—the most significant impulse in months.
The Power of Supply & Demand Imbalances
Supply and demand trading revolves around identifying areas where price has made a strong, impulsive move (demand or supply zone) and then waiting for a retracement into that zone for a potential reversal or continuation.
Key Characteristics of a Strong Imbalance:
✅ Extended Range Candles (ERC): Strong, wide-bodied candles indicate institutional buying/selling.
✅ Strong Imbalance: A clear shift in market structure after a strong rally or drop.
✅ Fresh Zone: The imbalance has not been tested yet or has only been tested once.

EUR/NZD BEARS ARE GAINING STRENGTH|SHORT
Hello, Friends!
EUR/NZD pair is in the downtrend because previous week’s candle is red, while the price is obviously rising on the 9H timeframe. And after the retest of the resistance line above I believe we will see a move down towards the target below at 1.890 because the pair is overbought due to its proximity to the upper BB band and a bearish correction is likely.
Disclosure: I am part of Trade Nation's Influencer program and receive a monthly fee for using their TradingView charts in my analysis.
✅LIKE AND COMMENT MY IDEAS✅

Heading into overlap resistance?EUR/NZD is rising towards the resistance level which is an overlap resistance level that is slightly above the 38.2% Fibonacci retracement and could drop from this level to our take profit.
Entry: 1.9286
Why we like it:
There is an overlap resistance level that is slightly above the 38.2% Fibonacci retracement.
Stop loss: 1.9500
Why we like it:
There is a pullback resistance level that lines up with the 71% Fibonacci retracement.
Take profit: 1.8813
Why we like it:
There is a pullback support level.
Enjoying your TradingView experience? Review us!
Please be advised that the information presented on TradingView is provided to Vantage (‘Vantage Global Limited’, ‘we’) by a third-party provider (‘Everest Fortune Group’). Please be reminded that you are solely responsible for the trading decisions on your account. There is a very high degree of risk involved in trading. Any information and/or content is intended entirely for research, educational and informational purposes only and does not constitute investment or consultation advice or investment strategy. The information is not tailored to the investment needs of any specific person and therefore does not involve a consideration of any of the investment objectives, financial situation or needs of any viewer that may receive it. Kindly also note that past performance is not a reliable indicator of future results. Actual results may differ materially from those anticipated in forward-looking or past performance statements. We assume no liability as to the accuracy or completeness of any of the information and/or content provided herein and the Company cannot be held responsible for any omission, mistake nor for any loss or damage including without limitation to any loss of profit which may arise from reliance on any information supplied by Everest Fortune Group.

USD/JPY Long and EUR/NZD LongUSD/JPY Long
Minimum entry requirements:
• If structured 1H continuation forms, 1H risk entry within it.
EUR/NZD Long
Minimum entry requirements:
• If structured 1H continuation forms, 1H risk entry within it.

EURNZD 1 HOUR BULLISH TREND, CANDLESTICK PATTERNS SHOOTING STAREURNZD 1 HOUR BULLISH TREND, CANDLESTICK PATTERNS SHOOTING STAR SPOTTED
Bearish Reversal Possible

EURNZD Trading Idea EURNZD Trading Idea Bullish market sign from the zone break above the 1.92755 with strong confirmations
While the most probable zone for bullish market will be 1.8750. Use pending order in the current situations. With 50-60 Pips Stop loss. The current price momentum will not clear the market conditions just wait and open trade as per given zone.

eurnzd buy signal. Don't forget about stop-loss.
Write in the comments all your questions and instruments analysis of which you want to see.
Friends, push the like button, write a comment, and share with your mates - that would be the best THANK YOU.
P.S. I personally will open entry if the price will show it according to my strategy.
Always make your analysis before a trade

EURNZD Wave Analysis – 7 May 2025
- EURNZD reversed from support level 1.8845
- Likely to rise to resistance level 1.9200
EURNZD currency pair recently reversed from the support level 1.8845 intersecting with the lower daily Bollinger Band and the 61.8% Fibonacci correction of the upward impulse from February.
The upward reversal from the support level 1.8845 stopped the C-wave of the active medium-term ABC correction (4) from the start of April.
Given the clear daily uptrend, EURNZD currency pair can be expected to rise to the next resistance level 1.9200.
