EURNZD RELIEF BUY OPPORTUNITYeurnzd has left a massive imbalance that will need to be mitigated. Sell may continue but a pullback would be healthy
EURNZD trade ideas

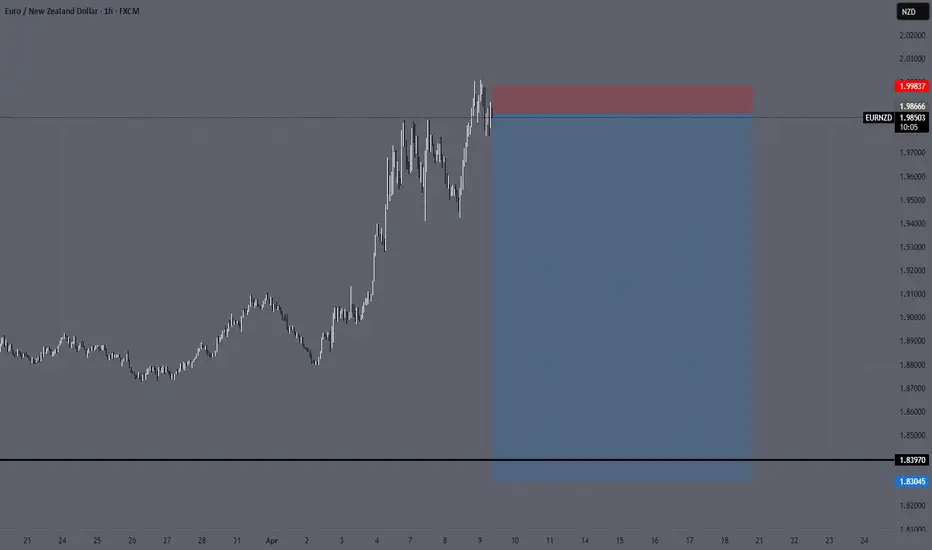
EURNZD REJECTING 2.00Looking for another long term sell opportunity on EURNZD after rejecting from 2.00
EURNZDCurrently, EUR/NZD is in a bullish trend on the 1-hour timeframe, forming higher highs and higher lows. However, there is a bearish divergence on the RSI, indicating a potential trend reversal.
If the price reverses from the current level without breaking the recent high of 2.00451, and gives a breakdown below 1.93840, we will consider entering a short position.
The stop-loss will be placed at 2.00451, with target levels at 1.91247 and 1.87942.

EURNZD seems to continue its bullish trend just zoom out and u will get decent info to make bias. Although I'm bullish and buy stop on the latest HH would be good

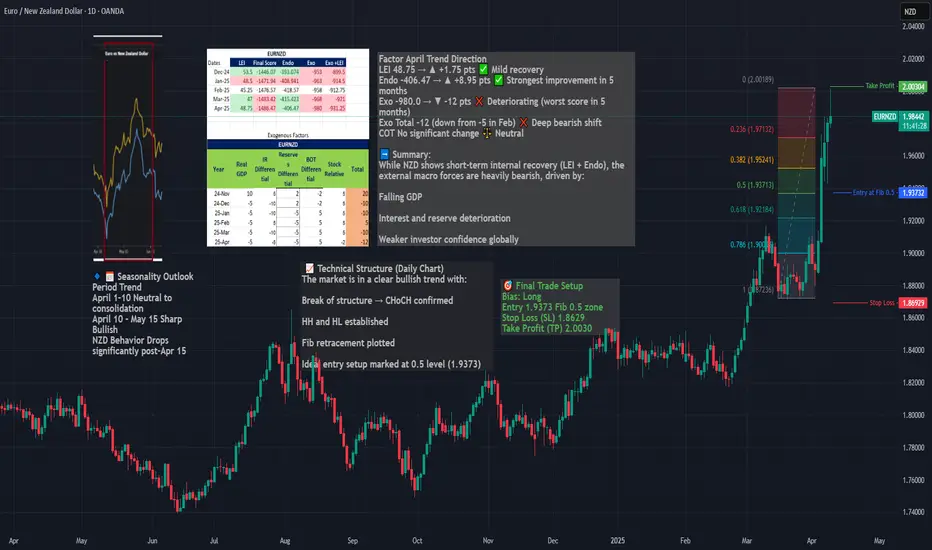
Long EURNZD – Seasonal, Fundamentals & Technical ConfluenceWe are entering a long position on EURNZD, capitalizing on a powerful confluence of:
Seasonal EUR strength + NZD weakness (April 10 – May 15)
A clear bullish market structure (CHoCH, HH/HL)
A clean Fibonacci retracement entry at 0.5
Strong macro divergence, with NZD exogenous conditions deteriorating
Macro & Seasonal Context
EUR enters a strong seasonal uptrend from April 10 to end of month
NZD shows seasonal weakness from April 15 onward
NZD’s exogenous model score worsened to -12 in April
While NZD LEI and endo improved, it remains structurally weak
Timing
Best execution: on pullback to 1.9373 zone, ideally between April 10–15, aligned with seasonal entry window.
EURNZDEURNZD
- Completed " 12345 " Impulsive Waves
- Demand Zone
- RSI - Divergence
- Change of Characteristics
- Point of Interest ( POI )

EURNZD - at major Resistance: Will it drop to 1.9000?OANDA:EURNZD reached a major resistance level that has previously acted as a strong barrier, triggering some strong bearish momentum. This zone can be a potential point of interest for those looking for short opportunities. Given its historical significance, how price reacts here could set the tone for the next move.
If bearish signals emerge, such as rejection wicks, bearish candlestick patterns, or signs of weakening bullish pressure, I anticipate a move toward the 1.9000 level . However, a clear breakout above this resistance could challenge the bearish outlook and mean further upside. It's a pivotal area where price action will likely provide clearer clues on the next direction.
Just my take on support and resistance zones, not financial advice. Always confirm your setups and trade with a proper risk management.

eurnzd sell signal. Don't forget about stop-loss.
Write in the comments all your questions and instruments analysis of which you want to see.
Friends, push the like button, write a comment, and share with your mates - that would be the best THANK YOU.
P.S. I personally will open entry if the price will show it according to my strategy.
Always make your analysis before a trade

EURNZD: Bearish Continuation is Expected! Here is Why:
The price of EURNZD will most likely collapse soon enough, due to the supply beginning to exceed demand which we can see by looking at the chart of the pair.
Disclosure: I am part of Trade Nation's Influencer program and receive a monthly fee for using their TradingView charts in my analysis.
❤️ Please, support our work with like & comment! ❤️

EURNZD INTRADAY BUYLong term i am looking at sells on EURNZD but it is possible we find support at these levels and trade higher to mitigate the imbalances above

Great Risk:Reward Sell Opportunity on EURNZD from the highGreat Risk:Reward Sell Opportunity on EURNZD from the high

eurnzd sell tradeThe Relative Strength Index (RSI) is showing a downward trend, indicating weakening momentum. Additionally, the Moving Average Convergence Divergence (MACD) is showing a bearish crossover, further supporting the potential for a downward move

eurnzd sell signal. Don't forget about stop-loss.
Write in the comments all your questions and instruments analysis of which you want to see.
Friends, push the like button, write a comment, and share with your mates - that would be the best THANK YOU.
P.S. I personally will open entry if the price will show it according to my strategy.
Always make your analysis before a trade

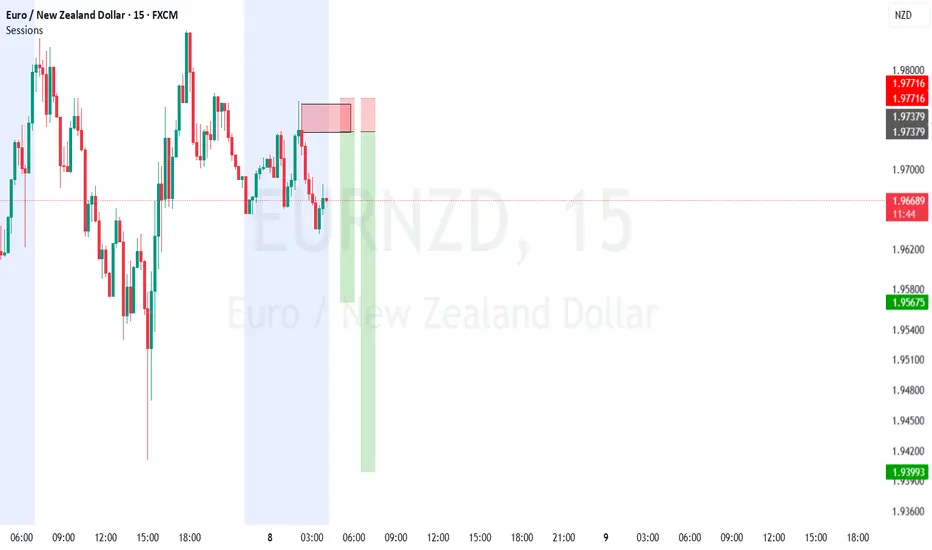
EURNZD SHORT TERMEURNZD SHORT TERM.
Session based trading. Leveraging on volume and opportunity in NZD Currency
EURNZD APRILBig line go down. Active for several days to about a week. Look for my updates. Sell in red, close in green.


EURNZD BUY TRADE PLAN🔥 EUR/NZD TRADE PLAN
📅 Date: April 2, 2025
🔖 Plan Type:
✅ Main Swing Trade Plan
📈 Bias & Trade Type:
Bullish Continuation – Trend Following Buy Setup
⭐ Confidence:
⭐⭐⭐⭐ (80%)
Structure + OB alignment + D1 trend + H4 impulse leg retracement
📌 Status:
🕒 Waiting for entry
Price currently retracing toward valid HTF discount zones; clean structure intact.
📍 ENTRY ZONES:
Primary Buy Zone: 1.8865 – 1.8885
(H4 OB + FVG + 50% of bullish impulse leg)
Secondary Buy Zone (Deeper Tap): 1.8825 – 1.8840
(D1 OB midpoint + LTF sweep + unfilled imbalance)
❗ STOP LOSS:
SL: 1.8785
(Below OB structure + liquidity pocket invalidation)
🎯 TAKE PROFIT TARGETS:
🥉 TP1: 1.8965 (Recent H1 minor structure high)
🥈 TP2: 1.9040 (Clean H4 wick imbalance target)
🏆 TP3: 1.9125 (D1 supply & equal highs liquidity)
📏 RISK:REWARD:
Minimum 1:3 R:R optimized for swing continuation
🧠 MANAGEMENT STRATEGY:
Risk 1–2% only
Move SL to BE after TP1 hit
Secure partials at TP2, trail SL above OB
Let remaining lot run toward TP3
Invalidate if D1 CHoCH or HTF trend flip occurs
⚠️ CONFIRMATION CRITERIA (REQUIRED):
H1 bullish engulfing or pin bar inside OB zone
Volume breakout spike at OB level
Optional: M15–M30 bullish divergence at zone
⏳ VALIDITY:
Valid for 1–3 days (HTF swing setup); expires if unfilled post 72 hours or structure breaks
🌐 FUNDAMENTAL & SENTIMENT FACTORS:
✅ EUR sentiment moderately bullish (COT net long building)
✅ NZD under pressure (RBNZ dovish bias + weak milk auctions)
✅ No high-impact news in next 24h = Clean window
✅ Risk sentiment slightly tilted Risk-On → favors EUR flows
📋 FINAL SUMMARY:
EUR/NZD remains in bullish structure on D1 & H4. Waiting for price to retrace into OB + FVG overlap inside discount range. High confluence trade with confirmation required. Do not enter blindly — wait for H1 signal inside zone.

eurnzd|foxforexeurnzd created a nice pennant formation on its 4-hour chart. The first possibility is that it will break the pennant directly and rise. The second possibility is that it will decline to the lower support of the pennant and react from there.

EURNZD SELL IDEA i love how the zones on eurnzd have been super clear and with the recent bos a pullback has occurred and on the lower time frame we can see that price is starting to close back under support and for me once price did that the probability of at least going back into half of that zone makes this trade idea worth one me taking.

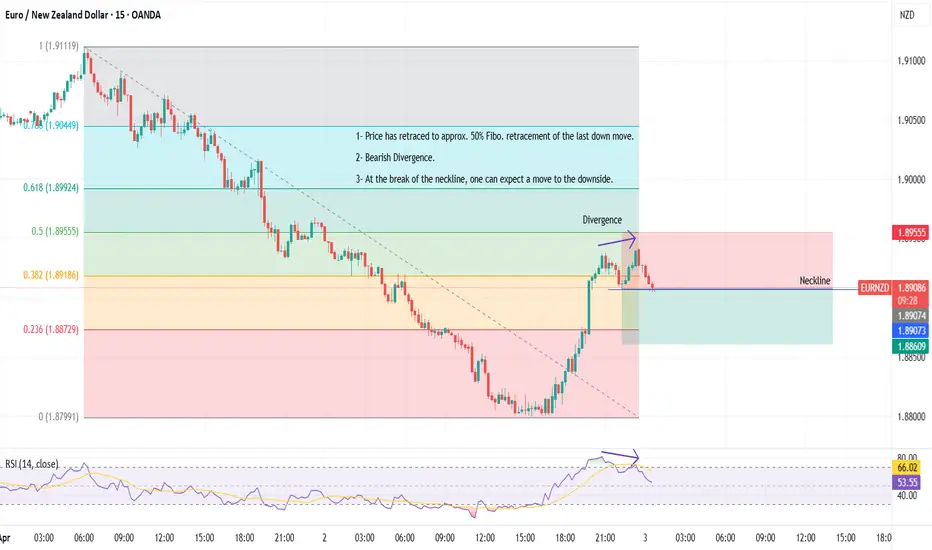
03-04-2025 _ Short Term Bearish Idea _ EURNZD M151- Price has retraced to approx. 50% Fibo. retracement of the last down move.
2- Bearish Divergence.
3- At the break of the neckline, one can expect a move to the downside.
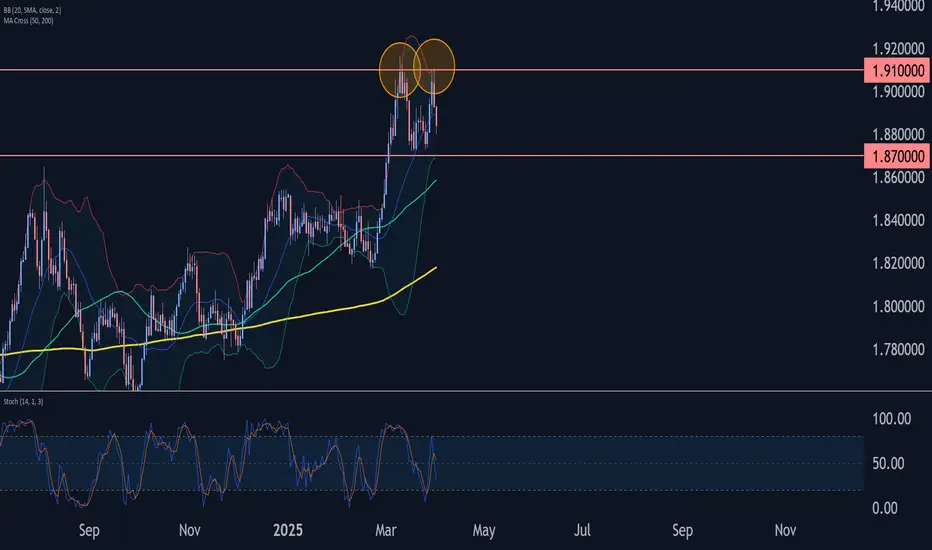
EURNZD Wave Analysis – 2 April 2025
- EURNZD reversed from resistance area
- Likely to fall to support level 1.8700
EURNZD currency pair recently reversed down from the resistance area located between the resistance level 1.9100 (which stopped the earlier sharp upward impulse wave I at the start of March) and the upper daily Bollinger Band.
The downward reversal from this resistance area stopped the earlier short-term impulse wave iii of the upward impulse wave 3 from the end of February.
Given the strength of the resistance level 1.9100, EURNZD currency pair can be expected to fall to the next support level 1.8700.
EURNZD SELLThe market here has previously tested a significant swing level as resistance and has just don’t the same on the daily chart printing a strong body bearish rejection candle.
I have chosen my entry to be a 50% retracement of the bearish signal candle.
My stop loss will be the previous swing level to account for spreads with my profit being 3x my risk.
Best of luck on the charts traders

