FARTCOIN Breakout and Potential RetraceHey Traders, in today's trading session we are monitoring FARTCOIN for a selling opportunity around 1.1650 zone, FARTCOIN was trading in an uptrend and successfully managed to break it out. Currently is in a correction phase in which it is approaching the retrace area at 1.1650 support and resistanc

FARTCOIN! Yet another move to come??HEYYY Fart is back!! I have attached my recent mega fart pattern which would be able to be relocated at the bottom of this page!
Look at this it - it shows a notable slowdown and rotation phase after a strong move.
From the left of the chart, price had a bullish breakout around April 27–28, with

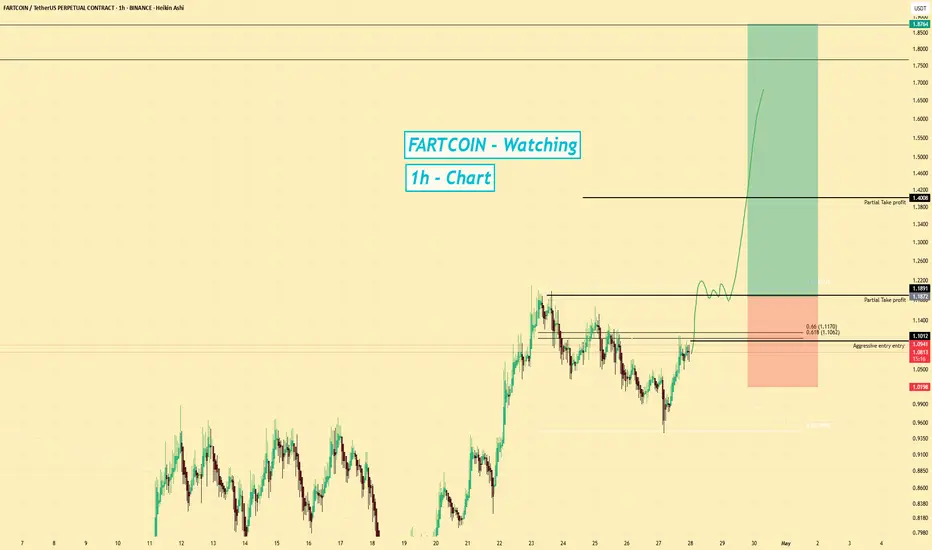
FARTCOIN → Moving into the realisation phase. A rally?BINANCE:FARTCOINUSDT.P has entered the buying zone, or the realization phase, after breaking through the resistance of the ascending triangle. The altcoin is within an upward trend.
Bitcoin continues to consolidate ahead of a possible rise. FARTCOIN has entered the buy zone at this time. The r

Fartcoin: Is the Smell of a Downtrend in the Air? 📉 Fartcoin: Is the Smell of a Downtrend in the Air? 💨
🚨 Alert: The RSI is holding its nose... and so should we.
After a suspiciously bubbly rally, $FARTCOIN is now showing bearish RSI divergence on the 4H chart — and let’s be honest, it’s starting to stink. 🦨
The recent price action looks like so

FART-The 200% Explosion That's About To Correct – PREPARE now
## The Most Deceptive Chart Pattern In Crypto Right Now 💣
The 4-hour FARTCOIN/USDT chart reveals a textbook example of parabolic extension that's setting up for a critical reversal. This explosive move (+13.93% today) has created the perfect storm for smart traders to position ahead of what appear

Fartcoin Corrects Into Macro Support — Decision Point atFartcoin just tapped into a pivotal area after a fast drop that erased over 10% in value. The $0.91 zone now stands as a crucial test—not just because it’s a recent low, but because it aligns perfectly with key technical structures.
We’re talking about the 0.618 Fibonacci retracement drawn from the

FARTCOIN weekly planIn this idea I marked the important levels for this week and considered a few scenarios of price performance
Write a comment with your coins & hit the like button and I will make an analysis for you
The author's opinion may differ from yours,
Consider your risks.
Wish you successful trades ! mur

Fartcoin 24hr potterboxI have drawn a potterbox for the fartcoin 24hr time frame, and you can see it is bouncing off the floor and hopefully going back up. using the laws of three and the powers of three. this has made this same pattern before.as i have circled the 3 places and if you count the three candles it will tell

FARTCOIN |Long | Aggressive Long Watch | (April 2025)FARTCOIN (FART) | Aggressive Long Watch | Meme Coin Spot Buying Surge | (April 27, 2025)
1️⃣ Insight Summary:
FARTCOIN (FART) has seen a massive spike in spot buying over the past few hours. Despite being a meme coin, the volume and activity are signaling a potential aggressive trading opportunity.
FartCoin resistance after completing a potential Elliott Wave 5Fartcoin Tests Major Resistance – ABCD Correction in Play?
FART is trading at a significant resistance level, with signs suggesting the completion of an Elliott Wave 5. This could trigger a larger corrective ABCD pattern.
Price has stalled at the $1.15–$1.30 range with multiple daily rejections.
W

See all ideas
Summarizing what the indicators are suggesting.
Oscillators
Neutral
SellBuy
Strong sellStrong buy
Strong sellSellNeutralBuyStrong buy
Oscillators
Neutral
SellBuy
Strong sellStrong buy
Strong sellSellNeutralBuyStrong buy
Summary
Neutral
SellBuy
Strong sellStrong buy
Strong sellSellNeutralBuyStrong buy
Summary
Neutral
SellBuy
Strong sellStrong buy
Strong sellSellNeutralBuyStrong buy
Summary
Neutral
SellBuy
Strong sellStrong buy
Strong sellSellNeutralBuyStrong buy
Moving Averages
Neutral
SellBuy
Strong sellStrong buy
Strong sellSellNeutralBuyStrong buy
Moving Averages
Neutral
SellBuy
Strong sellStrong buy
Strong sellSellNeutralBuyStrong buy
Displays a symbol's price movements over previous years to identify recurring trends.