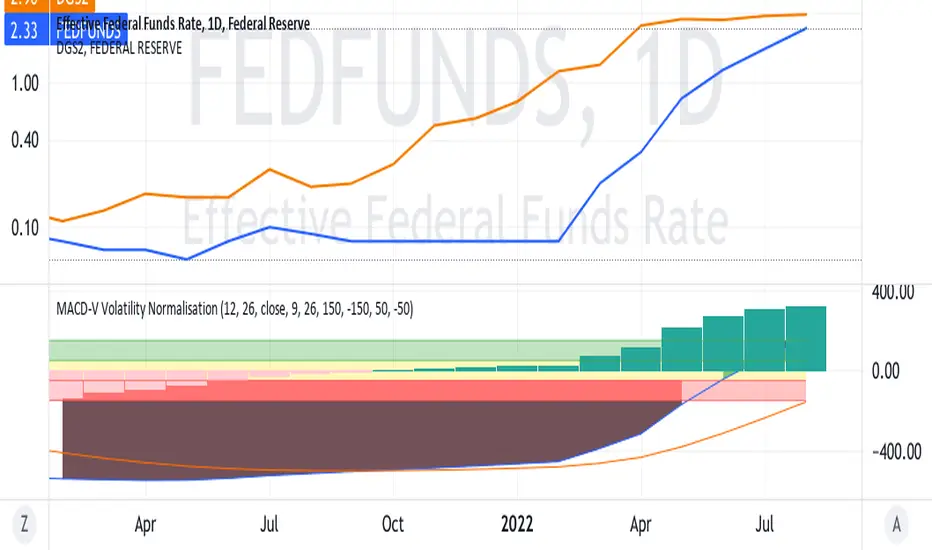
FEDERAL EASING IMPENDING WITH SEPTEMBER MEETING?On the chart, is the Federal Funds rate about to intersect
the yield of the 2 year Treasury Bills ?
If so , will this mark the technical point at which the Federal
Board will loosen things up in the context of the big picture
including jobs, core inflation, et cetera.
Will the fed lighten up and make any hike only 25 / 50 points ?
Has the market already factored all of this in ?
( Maybe too many questions !?!?!?!?)
FEDFUNDS trade ideas
The Only Chart That Matters for The Next DecadeConsumer Price Index Year over Year (CPI YOY) vs 2 Year Yield (2YY) vs Fed Funds. To even begin to arrest inflation, the Fed has to get Fed Funds above the 2YY. To break the back of inflation, the Fed must get Fed Funds above CPI YOY. Does the most recent drop in CPI YOY mean that peak inflation is already in? People forget that when inflation runs hot, so does its volatility. For lasting inflation reduction, the Fed has to get to the real neutral rate. And consider that the CPI formula you are seeing in this chart has been altered numerous times, proponents would say to better reflect productivity gains, critics would say to mask real inflation to benefit the government. Whatever you believe, if we calculated CPI the way we did in 1980 it would be nearing 18% . So it's much, much worse than this.
This is the only chart that matters for the next decade.

FED FUNDS RATE is bullishEvery Time we were around this area, FED went to 5,59 %.
interest rate shock times ! obvious but happy. Not correctly priced in the forward curves! it will go higher than 3,8% for sure!

We're entering uncharted terrritory with debt and interestWe're about to make history y'all! But not for a good reason... We're breaking out of the interest rate bear trend we've been in for over 35 years.
We used to raise interest rates to help control the debt; but after we abandoned the gold standard it didn't work so well. Going forward the economy could handle less and less rate hikes, while debt sky-rocketed. You'll also notice in vertical red, are market peaks before big crashes. For the last 20 years, a crash always follows the hike. Then the government uses it as an excuse to take on more debt.
Something else unique about this hike is that the yield curve inverted from the beginning of the hikes, when in the past it only inverted near the end of several hikes. You can see that in the link below.

Rates hikes don't = bearishLook from 2015-2019 fed was raising rates, yet NASDAQ remained bullish the entire time. Don't buy the hype - people have no fking clue what they're talking about.

FED Fund Rate, US Bonds and Inflation PredictionThe blue line area shows the historic and current FED's Fund Rate.
Looking back in the past it appears the US10Y (yellow line) is predictive of FED's fund rate upper target (orange arrows).
The US3M (turquoise line) seems to be a good indicator to get a feeling for the FED's fund rate short-term up or downward trend.
In the FOMC Summary of Economic Projections Jun 15 '2022 the FOMC had the midpoint of target range or target level for the federal funds rate at around below 4%
2022: 3,39% midpoint, 2023: 3.78%, 2024: 3.01% and >2024: 2,24% (ghost feed in the red box on the right).
So all that noted it would appear the FED Funds rate is to be expected at just below 4% at around 3.8%.
The next FOMC meeting will give as an update on that from the perspective of the FED.
And as a general indicator you need to know the FED uses the 10 Year- 3 Month Treasury Yield Spread (white line) as follows:
The 10 Year- 3 Month Treasury Yield Spread is the difference between the 10 year treasury rate and the 3 month treasury rate.
This spread is widely used as a gauge to study the yield curve. A 10 year-3 month treasury spread that approaches 0 signifies a
"flattening" yield curve. Furthermore, a negative 10 year-3 month spread has historically been viewed as a precursor or
predictor of a recessionary period. The New York Fed uses the rate in a model to predict recessions 2 to 6 quarters ahead (white arrows).
--------------------------------------------------------------------------------------------------------
** Please support this idea with your likes and comments, it is the best way to keep it relevant and support me. **
--------------------------------------------------------------------------------------------------------
!! Donations via TradingView coins also help me a great deal at posting more free trading content and signals here !!
--------------------------------------------------------------------------------------------------------

Expectations for September's FOMCWhat do the markets care about this week? We have another CPI print on Wednesday, which is highly anticipated. We are in a period of nasty stagflation and the Fed is caught in a difficult position. They want to raise rates further, but the issue is that our cause of inflation seems to be on the supply chain side. Interest rates will do little to combat this. The NFP numbers Friday were pretty strong, so their case is strengthened to raise by at least 50bps in September, at the next FOMC. It will be almost a certainty if CPI comes in hot.
Note that GDP came in contractionary for two quarters in a row, which is the definition most use for a recession. This stands somewhat at odds with the strong NFP numbers, which could be a seasonal fluke. If the data continues to indicate that we are in a recession, the Fed will eventually be forced to lower rates again. The markets seem to be weighing this reality before rallying with conviction.

Fed Fund RateNever seen before, 1336% year over year change in the Fed Fund Rate. I'm now seriously worried about what they broke this time... #fomc #inflation #gold #stagflation

Fed Funds RateThe chart above shows the Rate of Change (over a rolling 5-period) in the Fed Funds Rate.
The parabolic Rate of Change is unprecedented, yet the Federal Reserve is just getting underway with quantitative tightening as it pledges to do whatever it takes to squash high inflation. It's hard to imagine the Fed can pull off a soft landing.
Ironically, this looks like a chart of the amount of CO2 in the atmosphere over the past 800,000 years.
We don't see any climate scientists saying not to worry because we can engineer a soft landing.

Strong Dollar Milkshake It appears that the Dollar has officially sucked up the stock and crypto markets, paid off some past loans loans, inflated the economy with new loans, and now will Weak Dollar it's way down to pump the economy.

That's why the Fed needs to stop hiking before a system collapseThis is a quite interesting chart showing a ratio (black trend-line) of the Interest Rate, 5Y Yield and Federal Debt trading within a Megaphone pattern since the 1990s. Its (Higher) Highs have naturally coincided with peaks in Rate Hikes (red trend-line). The last peak was on October 2018 and currently the ratio just broke within that range again (red area).
This shows that the Fed is on a timer and has only limited time to act and stop hiking before they jeopardize collapsing a system that is in place for three decades now and brings balance to the market. The S&P500 (blue trend-line) has seen great periods of growth and stability systemically with this in place as long as the Fed doesn't go off limits with hiking.
Do you also think its time they act now and stop or at least ease this round of hiking before total collapse?
--------------------------------------------------------------------------------------------------------
Please like, subscribe and share your ideas and charts with the community!
--------------------------------------------------------------------------------------------------------

FED pivot to printing money?the fed pivot indicator
We are at the point where the fed would usually halt rate hikes and begin easing again
As they gear up for 75bp in a couple weeks, they would be knowingly blowing up the system
This chart is essentially proxy for the acceleration rate of interest expense for the US government, and has been a reliable indicator of fed pivot for 30+ years as the fed has ensured the US doesn't enter a debt death spiral
what is a debt death spiral? It's an increasingly large debt load, with ongoing deficit, that only gets exponentially larger as interest expense increases
The treasury has to issue more bills/notes/bonds to fund interest which drives up supply and can overwhelm demand
thus increasing interest expense even more as yields increase and this spirals out of control, with the only way to make payments being issuing even more treasuries
For the past 33 years the fed has used monetary policy to ensure this spiral doesn't occur
To avoid this, the fed will need to pivot soon otherwise they risk having to do even more easing and monetizing of debt down the road
To keep this line 'inbounds' they need the middle of the curve to fall ~75bp between now and the 24th
Or maybe they'll allow a brief spike above, and given the length of that chart, maybe 'brief' can be a number of months
But as far as what would be normal fed behavior, we're at the tightening limit for interest rates
not my post or idea, but i want to keep a record of it. follow the OG poster @thehappyhawiian

Downtrend in Fed Funds RateIt will be interesting to see if the Fed can buck this trend or if they will back off the rate hikes before a breakout occurs.
Don't mind the chart on the right, I did not intend to publish it, but it's not hurting anything so I left it there.

Effective Funds Rate Federal 6.25.22 Tracking this one. One reason I am pretty confident the swing is coming. I do not see a deflationary crash. I see the hyperinflation first. The crack up boom once the govts "pivot and start the brrrr full blast. Full "economic impact payments" aka UBI universal basic income. It is coming i am very confident as its already being experimented with in fully radical left run states. New Mexico , California are some examples. I know the narrative everyone is buying is a QT like no other. Problem is the repercussions are already being felt around the world. They are causing a global depression that will be unlike anything in human history if they follow their agenda , it will happen either way deflation /inflation. I.
No , instead the Fed balance sheet continues to grow. Check it for yourself. Verify
I expect all assets to continue to rip parabolically in the coming years . Look at the chart of gold/silver in Weimar. Huge rips. Huge crash. Huge rip higher. on and on. However it is simply a reflection of a loss of confidence and purchasing power of the once mighty dollar. THe game is soon over. CBDC roll out. It is ready. Crypto melt up coming. Stocks melt up. Gold/silver melt up. Basically anything that isnt a paper dollar. Soon they will stop creating physical fiat bc it will cost more to create it thn it is worth.
Laugh. I've been talking about all this for years. Anyone who's followed knows me and you can track it all in my posts. Get ready if you arent . Get prepped. You cant eat crypto, gold , silver, or stocks. I wont lecture or ramble on but get your household ready. Hungry people are going to want what you have.

DXY could get as high as 122The correlation between the Federal Fund rate and the DXY. In fancy mathematical terms, let's assume to start with the function F(x)= USD, thereby we can assume that the DXY it's the first derivative of f(x)=USD, considering that the DXY has been built as the average index of all the other currencies exchange rate in proportion to the USD. So the first Derivative for f(X)= USD has been made with the DXY. In this instance, we could argue that the Federal Fund Rate becomes then the Second Derivative of F(X)=USD, with respect to DXY.
Studying the second derivative behaviour, we could argue that in mathematical terms the 0% Federal Fund rate derives the Local Minimum for the d''f/dX^2 , in fact hiking interest rates starts to make the Federal Fund rate curve convex, otherwise Concave to the upside, thereby in graphic terms we can see that the 0% Federal Fund Rate= Local Minimum thereby the D''f/dX^2 starts to become positive from there. This can be reflected in the First derivative DXY, which shaped a Convex curve going to the upside that will tend to the Local Maximum, which could be DXY=122. So the function f(X)=USD would be increasing, which means a stronger U$Dollar.

FEDS FUND RATE VS. SPXInteresting historical market bullish price action following these similar increases in the federal funds rate....


Market behaviour & correlations since 1971 (FIAT)Long term, equities are more closely correlated with the Fed's balance sheet than they are with T-Yields, Fed Funds, or Commodities .

Market behaviour & correlations since 1971 (FIAT)Long term, equities are more closely correlated with the Fed's balance sheet than they are with T-Yields, Fed Funds, or Commodities.

Yields / Fed Funds / Rates / Inflation / 007s / TLT / ZN / ZBYou can't fix silly.
You can't fix stupid.
The Bond Market isn't going to fix anything, it assures ruin.
____________________________________________________
Buy the Dip hasn't quite worked out.
TLT will head to Sub 52.
You were warned long ago exactly what is happening would.
And explained in no uncertain terms exactly why.
DX back to 125?
Yeah... it's how you end up in ruin. Europe first.
TNX Yield times 2.81 - follow along or lose.

FED FUNDS AND ECONOMIC INDICATORSThis chart shows the federal funds rate along with other economic indicators, with recessions highlighted in red and significant events written alongside them.

Why there is deep trouble brewingWhy the market crash has not even started yet. How fast can the interest rates be raised. The storm is coming

The Fed is TrappedFRED:FEDFUNDS
Every 100 basis points, is another $300 Billion in ANNUAL debt service payments.
The Fed is trapped.
Countdown to Perma-ZIRP begins at the next rate top. (Between 150 - 175 bps)
