EMN | Long Setup | Weak Fundamentals | (May 2025)EMN | Long Setup | Technical Breakout Watch Despite Weak Fundamentals | (May 2025)
1️⃣ Short Insight Summary:
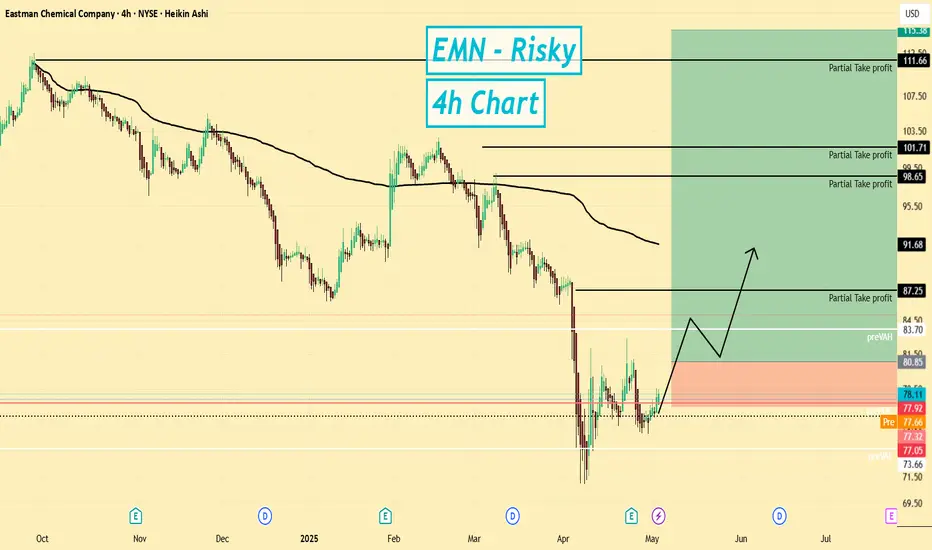
Eastman Chemical (EMN) has been in a downtrend for a while, and while the fundamentals look weak, the chart is showing a potential breakout setup. This idea is more technical than fundament
Next report date
—
Report period
—
EPS estimate
—
Revenue estimate
—
7.34 EUR
874.21 M EUR
9.06 B EUR
114.61 M
About Eastman Chemical Company
Sector
Industry
CEO
Mark J. Costa
Website
Headquarters
Kingsport
Founded
1920
FIGI
BBG000BQJZT0
Eastman Chemical Co. engages in the provision of specialty chemicals. It operates through the following segments: Advanced Material (AM), Additives and Functional Products (AFP), Chemical Intermediates (CI), and Fibers. The AM segment produces and markets its polymers, films, and plastics with differentiated performance properties for value-added end uses in transportation, consumables, building and construction, durable goods, and health and wellness markets. The AFP segment includes chemicals for products in the transportation, consumables, building and construction, animal nutrition, crop protection, energy, personal and home care, and other markets. The CI segment consists of large scale and vertical integration from the cellulose and acetyl, olefins, and alkylamines streams to support operating segments with advantaged cost positions. The Fibers segment offers cellulose acetate tow for use in filtration media, primarily cigarette filters. The company was founded by George Eastman in 1920 and is headquartered in Kingsport, TN.
📈BULLISH EMNHey guys,
As we can clearly see there is many reasons why there is a high probability of NYSE:EMN continuing the bullish move to the up side. We have the following indicators:
1. Nice clear larger degree impulse
2. Deep corrective ABC to 61.8% retracement
3. Lower degree impulse breaking out of

$EMN ($XLB) Long Setup via #theStrat $EMN ($XLB) Not a name I've traded, but it has triggered 212U Month 🟢, 212U 2Week 🟢 . Room to 85$, and then 90$ if it breaks through those levels

$EMN with a Bullish outlook following its earnings #Stocks The PEAD projected a Bullish outlook for $EMN after a Negative over reaction following its earnings release placing the stock in drift C with an expected accuracy of 87.5%.

$EMN with a Bearish outlook following its earnings #Stocks The PEAD projected a Bearish outlook for $EMN after a Negative Under reaction following its earnings release placing the stock in drift D with an expected accuracy of 40%.

$EMN Setting up for a long tradeMassive c&h forming
waiting to pierce through consolidation to play for all time highs


$EMN Eastman Chemical. Nice breakout retest78 Breakout and retest is a bullish signal. Targets of 84 & 95 looming.

See all ideas
Summarizing what the indicators are suggesting.
Neutral
SellBuy
Strong sellStrong buy
Strong sellSellNeutralBuyStrong buy
Neutral
SellBuy
Strong sellStrong buy
Strong sellSellNeutralBuyStrong buy
Neutral
SellBuy
Strong sellStrong buy
Strong sellSellNeutralBuyStrong buy
An aggregate view of professional's ratings.
Neutral
SellBuy
Strong sellStrong buy
Strong sellSellNeutralBuyStrong buy
Neutral
SellBuy
Strong sellStrong buy
Strong sellSellNeutralBuyStrong buy
Neutral
SellBuy
Strong sellStrong buy
Strong sellSellNeutralBuyStrong buy
Displays a symbol's price movements over previous years to identify recurring trends.
EACB
EASTMAN CHEM. CO. 14/44Yield to maturity
6.94%
Maturity date
Oct 15, 2044
EMN3861880
Eastman Chemical Company 4.8% 01-SEP-2042Yield to maturity
6.60%
Maturity date
Sep 1, 2042
EMN5755548
Eastman Chemical Company 5.625% 20-FEB-2034Yield to maturity
5.77%
Maturity date
Feb 20, 2034
EMN5545591
Eastman Chemical Company 5.75% 08-MAR-2033Yield to maturity
5.43%
Maturity date
Mar 8, 2033
EMN4762698
Eastman Chemical Company 4.5% 01-DEC-2028Yield to maturity
4.76%
Maturity date
Dec 1, 2028
EMN.GD
Eastman Chemical Company 7.6% 01-FEB-2027Yield to maturity
4.75%
Maturity date
Feb 1, 2027
EMN5861174
Eastman Chemical Company 5.0% 01-AUG-2029Yield to maturity
4.65%
Maturity date
Aug 1, 2029
XS152325029
EASTMAN CHEM. CO. 16/26Yield to maturity
2.65%
Maturity date
Nov 23, 2026
EMN4189129
Eastman Chemical Company 4.65% 15-OCT-2044Yield to maturity
—
Maturity date
Oct 15, 2044
See all EAC bonds
Related stocks
Frequently Asked Questions
The current price of EAC is 69.04 EUR — it has increased by 2.43% in the past 24 hours. Watch EASTMAN CHEM. CO. DL-,01 stock price performance more closely on the chart.
Depending on the exchange, the stock ticker may vary. For instance, on FWB exchange EASTMAN CHEM. CO. DL-,01 stocks are traded under the ticker EAC.
EAC stock has risen by 3.17% compared to the previous week, the month change is a −3.82% fall, over the last year EASTMAN CHEM. CO. DL-,01 has showed a −22.83% decrease.
We've gathered analysts' opinions on EASTMAN CHEM. CO. DL-,01 future price: according to them, EAC price has a max estimate of 109.46 EUR and a min estimate of 66.55 EUR. Watch EAC chart and read a more detailed EASTMAN CHEM. CO. DL-,01 stock forecast: see what analysts think of EASTMAN CHEM. CO. DL-,01 and suggest that you do with its stocks.
EAC stock is 2.38% volatile and has beta coefficient of 0.96. Track EASTMAN CHEM. CO. DL-,01 stock price on the chart and check out the list of the most volatile stocks — is EASTMAN CHEM. CO. DL-,01 there?
Today EASTMAN CHEM. CO. DL-,01 has the market capitalization of 7.95 B, it has increased by 4.05% over the last week.
Yes, you can track EASTMAN CHEM. CO. DL-,01 financials in yearly and quarterly reports right on TradingView.
EASTMAN CHEM. CO. DL-,01 is going to release the next earnings report on Jul 24, 2025. Keep track of upcoming events with our Earnings Calendar.
EAC earnings for the last quarter are 1.77 EUR per share, whereas the estimation was 1.75 EUR resulting in a 0.94% surprise. The estimated earnings for the next quarter are 1.59 EUR per share. See more details about EASTMAN CHEM. CO. DL-,01 earnings.
EASTMAN CHEM. CO. DL-,01 revenue for the last quarter amounts to 2.12 B EUR, despite the estimated figure of 2.15 B EUR. In the next quarter, revenue is expected to reach 2.04 B EUR.
EAC net income for the last quarter is 168.23 M EUR, while the quarter before that showed 318.77 M EUR of net income which accounts for −47.23% change. Track more EASTMAN CHEM. CO. DL-,01 financial stats to get the full picture.
Yes, EAC dividends are paid quarterly. The last dividend per share was 0.76 EUR. As of today, Dividend Yield (TTM)% is 4.21%. Tracking EASTMAN CHEM. CO. DL-,01 dividends might help you take more informed decisions.
EASTMAN CHEM. CO. DL-,01 dividend yield was 3.57% in 2024, and payout ratio reached 42.47%. The year before the numbers were 3.54% and 42.47% correspondingly. See high-dividend stocks and find more opportunities for your portfolio.
As of May 6, 2025, the company has 14 K employees. See our rating of the largest employees — is EASTMAN CHEM. CO. DL-,01 on this list?
EBITDA measures a company's operating performance, its growth signifies an improvement in the efficiency of a company. EASTMAN CHEM. CO. DL-,01 EBITDA is 1.74 B EUR, and current EBITDA margin is 19.77%. See more stats in EASTMAN CHEM. CO. DL-,01 financial statements.
Like other stocks, EAC shares are traded on stock exchanges, e.g. Nasdaq, Nyse, Euronext, and the easiest way to buy them is through an online stock broker. To do this, you need to open an account and follow a broker's procedures, then start trading. You can trade EASTMAN CHEM. CO. DL-,01 stock right from TradingView charts — choose your broker and connect to your account.
Investing in stocks requires a comprehensive research: you should carefully study all the available data, e.g. company's financials, related news, and its technical analysis. So EASTMAN CHEM. CO. DL-,01 technincal analysis shows the sell today, and its 1 week rating is sell. Since market conditions are prone to changes, it's worth looking a bit further into the future — according to the 1 month rating EASTMAN CHEM. CO. DL-,01 stock shows the sell signal. See more of EASTMAN CHEM. CO. DL-,01 technicals for a more comprehensive analysis.
If you're still not sure, try looking for inspiration in our curated watchlists.
If you're still not sure, try looking for inspiration in our curated watchlists.