FWOGUSDT: The Sleeping Giant Awakens!
📊 Chart Breakdown:
- Current Price: 0.072
- Volume: 1.44M (Liquidity building!)
- Key Levels:
- Support: 0.022 (Massive demand zone!)
- Resistance: 0.0850(Break = Moon mission!)
🔥 Creative Analysis:
FWOGUSDT is coiled like a spring! After a wild dip to 0.022, buyers stepped in HARD, pu

$FWOG 3-months Consolidation Breakout $FWOG just broke out of its 3-month consolidation zone, and I longed it before the breakout!
After ranging tightly since February, it finally pushed above resistance with solid momentum.
Up nearly 20% today let’s see how far this breakout runs!
Chart looks nice

$FWOG 3-Months Consolidation Breakout $FWOG just broke out of its 3-month consolidation zone, and I longed it before the breakout!
After ranging tightly since February, it finally pushed above resistance with solid momentum.
Up nearly 20% today let’s see how far this breakout runs!
Chart looks nice

FWOG LONG ALL trading ideas have entry point + stop loss + take profit + Risk level.
hello Traders, here is the full analysis for this pair, let me know in the comment section below if you have any questions, the entry will be taken only if all rules of the strategies will be satisfied. I suggest you keep thi
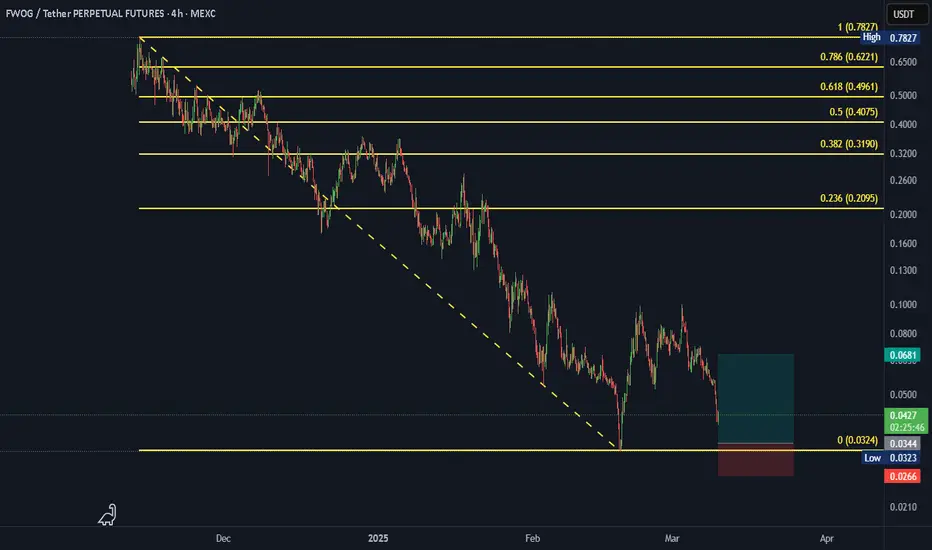
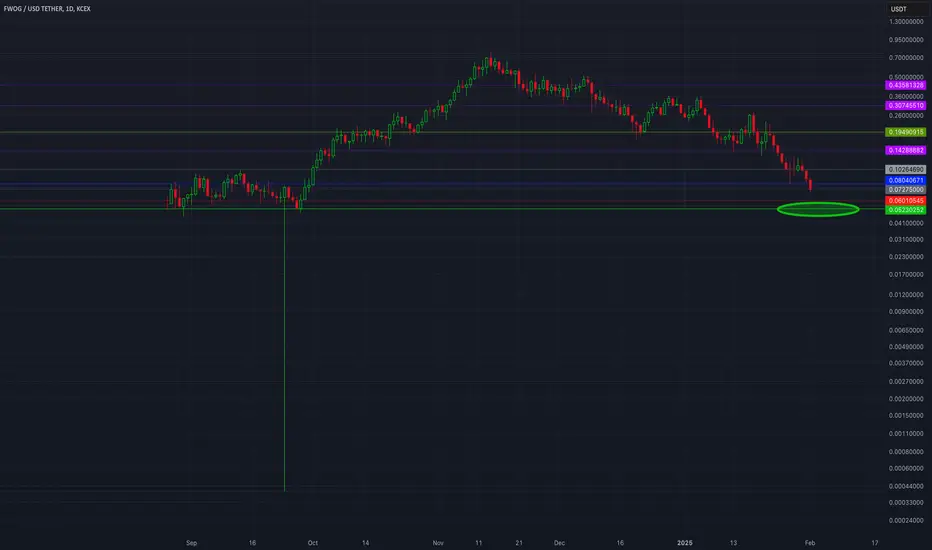
$FWOG ANALYSIS! If price reaches the green support zone 🟩, there is a potential long entry 📈 as buyers could step in and push the price up again.
⚠️ Waiting for confirmation before entering a long position from this zone.


BUY BUY OR BYE BYE FROGGY This thing came full H&S circle__ ones, again proving the most predictable bear pattern.
IF it bounces__ PT .22 .30
FWOG/USDT AnalysisThe price is approaching the resistance zone in red.
🎯 Targets if breakout occurs:
1️⃣ First Target: Green line level
2️⃣ Second Target: Blue line level

FWOGUSDT: Approaching the Turning Point – What’s Next?FWOGUSDT is trading at $0.12006, hovering just above its absolute low of $0.11783, established only hours ago. This marks a staggering -84.6% retreat from its absolute high of $0.78189, reached just 72 days prior. With RSI14 dipping to 29.42, the asset is entering oversold territory, raising the st

FWOG Showing Some StrengthFWOF Bouncing of that Weekly FVG and show relative streng here. Look like goog RR for the long set up.

See all ideas
Summarizing what the indicators are suggesting.
Oscillators
Neutral
SellBuy
Strong sellStrong buy
Strong sellSellNeutralBuyStrong buy
Oscillators
Neutral
SellBuy
Strong sellStrong buy
Strong sellSellNeutralBuyStrong buy
Summary
Neutral
SellBuy
Strong sellStrong buy
Strong sellSellNeutralBuyStrong buy
Summary
Neutral
SellBuy
Strong sellStrong buy
Strong sellSellNeutralBuyStrong buy
Summary
Neutral
SellBuy
Strong sellStrong buy
Strong sellSellNeutralBuyStrong buy
Moving Averages
Neutral
SellBuy
Strong sellStrong buy
Strong sellSellNeutralBuyStrong buy
Moving Averages
Neutral
SellBuy
Strong sellStrong buy
Strong sellSellNeutralBuyStrong buy
Displays a symbol's price movements over previous years to identify recurring trends.