IS US 30 TRENDING UP CREATING A BULLISH ORDER FLOW?I see us30 respecting bullish order blocks and creating liquidity pools on the downside will it even come back on the discounted levels
WS30M trade ideas

Before Unemployment Claim Day trade - Potential scenarios US30 🛠️ Trade Execution Plan
✅ Step 1: Key Levels to Watch
📊 Resistance:
🔴 45,070 – 45,100 → Major breakout level
🟢 Target if bullish: 45,250+
📊 Support:
🟡 44,550 → First downside target
🟢 44,266 → Stronger support level
🔴 43,753 → Deep pullback level (if sell-off happens)
📈 Bullish Scenario (Stronger-than-expected labor market)
🔹 What to look for:
Unemployment claims come in lower than expected (good for economy).
US30 breaks and holds above 45,100 (watch for a retest confirmation).
Momentum increases on MACD & RSI stays above 50.
🔹 Trade Setup:
✅ Buy above 45,100 if price closes above this level on the 5m or 15m chart.
🎯 Targets:
🎯 First TP: 45,250
🎯 Second TP: 45,400
🛑 Stop-Loss (SL): Below 44,950
📉 Bearish Scenario (Weaker labor market, higher claims)
🔹 What to look for:
Higher unemployment claims = weak labor market = market drops.
US30 rejects 45,070 and fails to break 45,000.
RSI turns downward, MACD shows red bars increasing.
🔹 Trade Setup:
✅ Sell below 44,900 if price fails to break above 45,000 and starts dropping.
🎯 Targets:
🎯 First TP: 44,550
🎯 Second TP: 44,266
🛑 Stop-Loss (SL): Above 45,050
⏳ Best Trading Approach (Timing)
1️⃣ Right at 8:30 AM ET (Initial Spike)
Price whipsaws up & down due to fast orders.
❌ Avoid immediate entry! Wait 5-10 minutes for direction.
2️⃣ 8:35 - 8:45 AM ET (Retest Confirmation)
If price breaks a key level & retests, enter on confirmation.
3️⃣ 9:30 AM ET (Stock Market Open Reaction)
Second big move might come at NYSE open.
🎯 Final Tips
Don’t rush the trade. Let the market show direction before entering.
Stick to stop-loss & take-profit levels.
Use smaller lot size if volatility is extreme.
If unsure, stay out! There will always be another trade.
Do not risk more than 1% of your account.
Follow for more cool ideas.
-Nozuk

US30 SELL AT SUPPLY ZONE SMART MONEY CONCEPTHere on Us30 price has form a supply around zone of 44801.11 and is likely to continue falling so trader should go for short with expect profit target of 43616.84 and 42379.15 . Use money management

US30 Bearish Breakout!
HI,Traders !
US30 broke the rising
Support line and the breakout
Is confirmed so we are
Bearish biased and we
Will be expecting a
Further move down !
Comment and subscribe to help us grow !

US30 Stuck at all time high providing an intraday shortUS30 is having difficulties passing the 44800 resistance level and provided an intraday short opportunity.

US30hello everyone, the price reversed from previous support level, the price is still trading in straight pattern, today after ism news price stayed strong.. price may continue bullish and reach or break the main resistance level and make all time high price

US30USD - ANALYSIS👀 Observation:
Hello, everyone! I hope you're all doing well. Let me share my personal view on Dow Jones (U.S. Jersey) with you.
🔍 The Setup:
We are currently observing a psychological level at $45,000 on the Dow Jones chart. This level has been tested multiple times in the past, leading to rejections and price declines. However, this time, the price has closed very close to this level, hinting at a potential breakout.
📉 Expectation:
Bullish Scenario:
If the price closes above $45,000 in the daily timeframe, I expect an upward movement toward the next psychological level at $50,000.
Bearish Scenario:
If the price gets rejected at $45,000, I anticipate further price declines, targeting the $40,000 psychological level.
💡 Key Levels to Watch:
Resistance: $45,000, $50,000
Support: $40,000
💬 What’s your take on Dow Jones this week? Share your thoughts in the comments below!
Trade safe

US30 SELL NOW!!!!!!!!!!US30 revisited the supply zone with a strong price rejections printed a candlesticks trend reversal indicating a sell entry opportunity am looking forward to see price takes outs all the liquidity below for retest at 43k levels
Lets know your take on this............

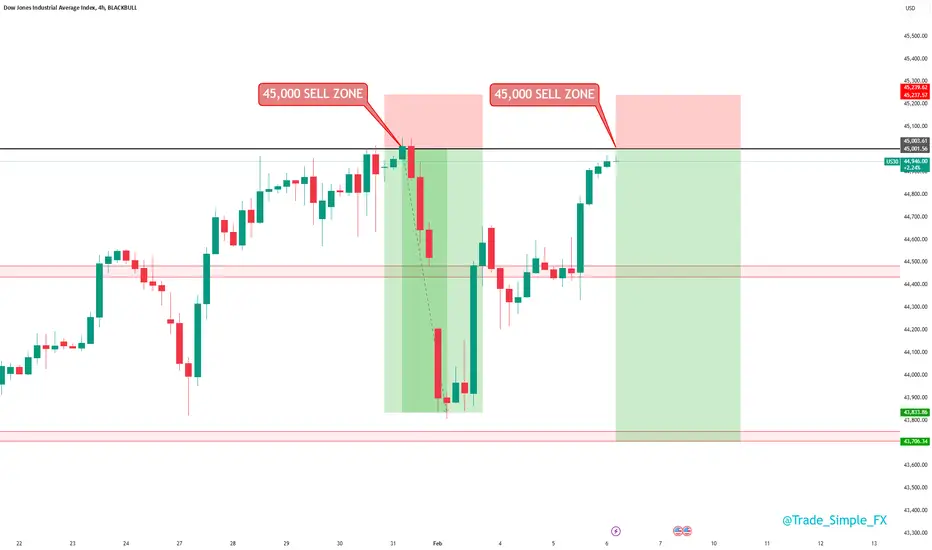
US30 H8 - Short SignalUS30 H8
We are yet again approaching that key psychological price level, 45,000 coming into play. We are very close currently, but alerts have been set. Last time this setup came into this 45,000 territory, we sold off an attractive 5R.
Looking to see if this setup can offer something similar again, we would love to see price trade closer to 44,000 this time round.
DOUBLE TOP IS STILL INTACT.. GOOD R:R FOR SELLING NOW!As labeled as "X" on the chart, it showed a double top pattern has been formed and right now tested as a price retrace.
I do believe the top will remain effective and it is a good opportunity to short it with very limited risk and huge potential reward.
Plus.. Uncertainty on the market, tends to push the price lower than higher.
So.. Let's ride the bear!
CHEEERRRSSSS...!!!

Dow Jones Trending Higher: Potential Move to 45,494CAPITALCOM:US30 is trading within a well-defined uptrend, supported by a rising trendline that signals strong bullish momentum. The price has consistently formed higher highs and higher lows, reinforcing the trend continuation narrative.
I anticipate that if the index maintains its upward momentum, it could move toward the 45,494 level. This setup aligns with the broader bullish trend, supported by the sustained strength above the trendline and recent price action.
Let me know your thoughts or if you see the setup differently!

Potential sell Daily - US30 As you can see, the pattern, this is a potential sell.
The RSI is at 65 and it may go above 70, this will allow price to hit 45000, it is good. Weekly FIb represents at high.
It may go down after this week on an easy, it all ads up with the trading war with China and it may help that Mexico and Canada are on puase of 30 days.
only risk 0.5% or 1% of account.
If it plays well, then this will be a good put for the end of this week and mids next week.
Keep in mind scalping and day trading will be a good call as well if the daily and lower Time frames play the part.
Follow for more ideas.
Nozuk

us30will have a big drop today or tomorrow due to reversal and it becoming a downtrend i see us30 falling to a point where trump starts crying and begging for biden back

DJI reached resistance.The price has reached the center of the wide ascending channel and a trendline that served as a bottom of an old channel that was broken during December dump - now it's a resistance.
I also see 2h divergences on 2h RSI on US30, but not on DJI yet. I think it will grind the resistance for some time, create more divergence and go for a pullback.

ANALYSIS OF THE CURRENT 5-YEAR BULL CYCLEWe would look at the 20 year cycle in the stock market, there are two individual 20-year cycles running together at a time. One cycle defines tops and the other identifies the major market lows. We would also look at the 20- year periodicity of repeating market fractals and the 5-year bull cycle that commences at the beginning of each 20-year cycle.
In subsequent updates we will identify the 8 - 13 subdivision of the 20-year cycle. To make the chart clean we have only indicated the cycle that defines bottoms. Top cycles will be identified in the description and both cycles combined on one linear scale to see how they relate to the 5-year bull cycle.
Our pivot point is taken at the 22nd August 1921 low.
First Cycle duration:
22/08/1921 - 27/04/1942 = (7553 days /1079 weeks /248.2 months)
= 20 years, 08 months, 05 days.
Cycle 2:
27/04/1942 - 25/06/1962 = (7364 days / 1052 weeks / 242 months)
= 20 years, 01 month, 29 days.
Cycle 3:
25/06/1962 - 16/08/1982 = (7357 days / 1051 weeks / 241.7 months)
= 20 years, 01 months, 22 days
Cycle 4:
16/08/1982 - 07/10/2002 = (7352 days / 1051 weeks / 241.7 months)
= 20 years, 01 month, 21 days
Cycle 5:
07/10/2002 - 10/10/2022 = (7308 days / 1044 weeks / 240.1 months)
= 20 years, 0 month, 03 days
By observation, cycle 3 and 4 have the same duration 7357 days while cycle 2 is (+7 days) off 7357 days, i.e 1 candle on the weekly timeframe. Now, looking at the beginning points of each cycle, within the identified ellipses we see a striking fractal that has been consistent in all 5 cycles.
Cycle 1 and 2
Cycle 3 and 4
Cycle 5 and 6
The 20-year cycle that defines tops are on :
27th May 1946
7th February 1966
24th August 1987
8th October 2007
XX - XX - 2027
Cycle 1 origin point is on 22/08/1921 but has a split focus at two points, one on the 1921 pivot and the other on the much popular May 1924 low.
Representing both cycles (Bottoms and tops)
This shows that between the two origin points is approximately a 5-year cycle
This cycle is actually an astrocycle and varies according to the changing speed.
By observation, Fractal 1 is very much identical to fractal 4 and fracal 2 very much identical to 5. A time span of 60 years averagely separate fractals 1 and 4 as well as 2 and 5. This leaves the 1962 - 1966 cycle, 60 years from 1962 puts the origin for the new identical fractal at the October 2022 low.
The above justifies that if the cycle is not inverted then a point on the current price action should not be broken. Also it negates the numerous calls for a crash that has been chanted since the 2020 low and never materialized.
HOWEVER, there is the 101-year cycle which alternate tops for bottoms and vice versa after its completion, and considering the pivot from 22/08/1921 the 101 years ended at the October 2022 low.
Interesting... check back as we would go through the numerical expansions that shed more light on what to expect forward, price levels, and time resistances.
Thanks for your time, all opinions are much appreciated, questions would be answered too.
Good luck.

Head and Shoulders pattern, price might go downAs we can see the price reached our Major key level and formed a H&S pattern, meaning we might experience sellers, but that's not enough confirmation to sell
If price breaks below the Major low then we can take that as a confirmation that sellers are taking over the market and we can expect selling pressure and we can place our entries
If it breaks above the MKL then we can expect buying pressure as this showed that the H&S pattern failed so buyers are taking over
