GALAUSDT...not a surprise for sureBINANCE:GALAUSDT
it's simple
it's clear
it's easy
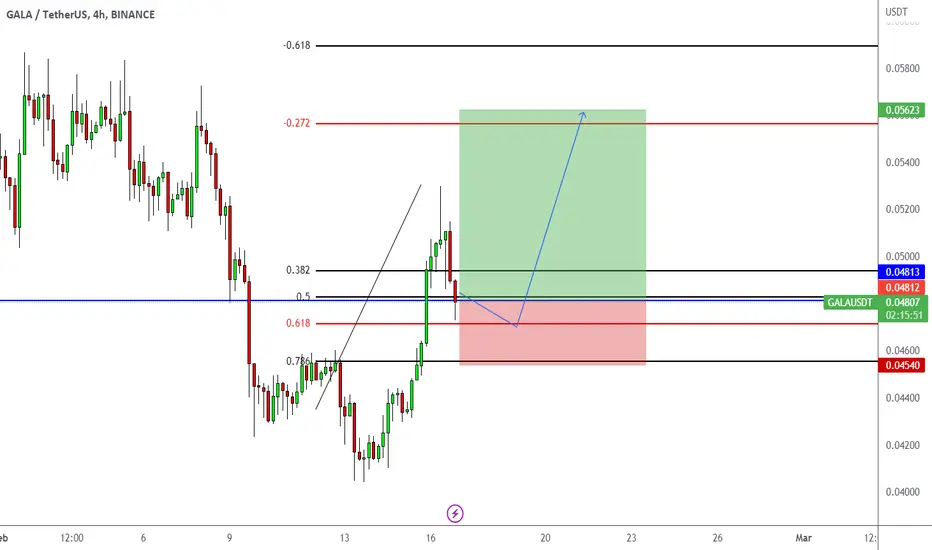
it's...a buy trade if we have confirmation bar above the 0% FIb chan. line
don't be a pussy...BE A MAN!
#STOP_BEING_POOR
GALAUSDT.5L trade ideas

GALA / USDT Price Prediction As You Can See In Pic inverse head and shoulders Are Showing In The 4 Hour Chart.
As You Can See The 0.618 Fibonacci Retracement Is A Special Level Gala price Level 0.05091 If The Price Breaks This Level
Then Good For Long.

GALA / USDT Price Prediction As You Can See In Pic inverse head and shoulders Are Showing In The 4 Hour Chart.
As You Can See The 0.618 Fibonacci Retracement Is A Special Level Gala price Level 0.05091 If The Price Breaks This Level
Then Good For Long.

GALAUSDT is ready for the breakout?The current price of GALAUSDT is testing a dynamic resistance level in the $0.05 area where the market also has a static daily resistance level. Additionally, the price is creating an inverse head and shoulders pattern, which is a technical chart pattern that may indicate a potential trend reversal from a downtrend to an uptrend.
An inverse head and shoulders pattern consists of three distinct troughs or valleys with the middle trough being the lowest, forming the "head," and the two outer troughs forming the "shoulders." The middle trough or the "head" is typically lower than the shoulders, and the pattern is completed when the price breaks above the "neckline," which is a trend line drawn connecting the high points between the shoulders.
If the price of GALAUSDT is able to break out from the neckline of the inverse head and shoulders pattern and the market satisfies Plancton’s rules, it may be a signal for a long position. To satisfy Plancton’s rules, a trader may have a predetermined entry price, set stop loss and take profit levels to manage risk and maximize profits, and monitor the price action for any signs of a trend reversal or invalidation of the initial analysis.
–––––
Keep in mind.
🟣 Purple structure -> Monthly structure.
🔴 Red structure -> Weekly structure.
🔵 Blue structure -> Daily structure.
🟡 Yellow structure -> 4h structure.
⚫️ black structure -> <= 1h structure.
–––––
Follow the Shrimp 🦐

GALAUSDT future for 2.5%/25% Absolute X3My recommended trades are based only on the uptrend of the market. It will be opened in the time frame of 1 hour and at the end of the day, profit trading will be closed with any amount of profit. And only losing trades will remain open until they are liquidated. This trading strategy is backtested and works only in an uptrend.

How Much Juice Left for GALA?You can clearly see a Bullish Ascending Triangle formed on the Daily chart
Price is perfectly rejecting 200 Daily EMA , and if it breaks above, ~$0.07 is a good target
If BTC consolidates/moves up, &/ there happens to be a good fundamental news for GALA , you can expect those red lines above to be hit
If BTC does a major correction/pullback, then expect this technical analysis to be invalidated
Happy Trading!
Not a Financial Advice.


Gala On verge Of Breakout Seems Like Gala Getting ready for Further Continuation
Forming Bulish flag In h4 timeframe Incase Of breakout Expecting another 45 To 50% bulish Move

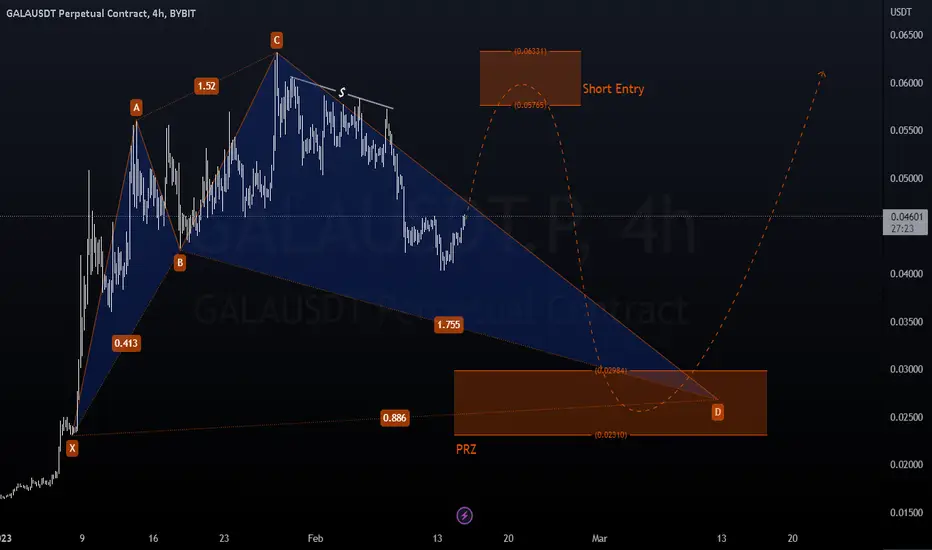
Gala Direction Overview (4H)Shark pattern on Gala 4H chart will be utilized to enter liquidity sweep OB short to the order block below then long to higher highs
galaThe resistance area ahead is very important. And we have an intact level below. I am waiting for the reaction to the lower levels. If the resistance ahead is broken, the above numbers can be seen.

GALA triangle pattern and more range 📖💡🚀Hello 🐋
Based on the chart, the price is in the parallel channel and close to the channel support area, and triangle pattern ✔️
if
the price doesn't break the support zone to the downside, we will see more gain 💣🚀
otherwise
we can see more correction to lower support level ❌🧨
if
breakout of the upper resistance zone be completed, we can see more pump to the upside ✔️🚀
👌 Notice: pay attention to the price on shortcut chart (located below the main chart with black colour) 📖💡
Please, feel free to share your point of view, write it in the comments below, thanks 🐋

GALA/USDT Poss 3x incomingThis fell hard and fast, looks like its waking up again, Got a nice cup and handle setup, which probably continues up . For a wave count , something like this maybe, where there price gets held up by resistance from left on the chart

Flag Pattern of GALAUSDTThe Gala chart is a flagged pattern It is likely that the chart will continue to decline after completing the flag.

GALAUSDT future for 5%25% Absolute X5My recommended trades are based only on the uptrend of the market. It will be opened in the time frame of 1 hour and at the end of the day, profit trading will be closed with any amount of profit. And only losing trades will remain open until they are liquidated. This trading strategy is backtested and works only in an uptrend.

🔥 GALA Bounce Trade: High Probability SetupGALA has seen massive gains earlier this year. However, since GALA stopped going parabolic it has been trading largely within a well-defined range.
As of now, GALA has successfully bounced from the 0.42 - 0.44 support area. This, combined with the 4H RSI being oversold gives us a high probability setup for a reversal.
I'm looking at the blue lines for potential profit targets.GALA has seen massive gains earlier this year. However, since GALA stopped going parabolic it has been trading largely within a well-defined range.
As of now, GALA has successfully bounced from the 0.42 - 0.44 support area. This, combined with the 4H RSI being oversold gives us a high probability setup for a reversal.
I'm looking at the blue lines for potential profit targets.

GALAUSDTIt seems to have reached the demand zone. If this demand zone is opened, the next demand zone will be reached.

GALA HOLD THE LINEgala is at a very important support it does need to hold here or it could face much further downside but in the case of a bounce i think we are forever safe above the current level short of a market plumet with btc below 18k

GALAUSDT might moon very soonSo far so good. We can see some bullish consolidation at 0.0427 — 0.0428 and now keep going straight up.
Breaking a large fractal of 0.0558 will affect up movement to lead us in the area of 0.0728
Anyway, the market decides. But after we reach 0.0728 there is a very powerful resistance and we should be very patient at this point.
If we break 0.0728 next station is 0.09

Gala Wait for Buy Gala need down to completed wave 5 but befor that should correction to wave 4 in R area and down to green support zone in there we buy it to tp1 50% fibo ret all move

GALA: Next game token to have a pump?**I bought GALA token**
The GALA game token has been making bottoms and rising tops for days now, tonight the SAND game token had a 20% pump and GALA could be next.
Entry: 0.05670
Target: 0.07245 (27.78%)
Stop: 0.05104 (10%)
Volume: 4.5%

Gala Buy In 4hGala has completed its 2orB wave and is now starting to complete its 3orC , we buy it with stop-loss blew green fibo and support zone and tp1 to tp3 manage & trail profit

GALA shortGALA bounced down off the resistance level. Asset broke trough the ascending trendline. Bearish movement to support level at 0.0442 is expected to happen.
