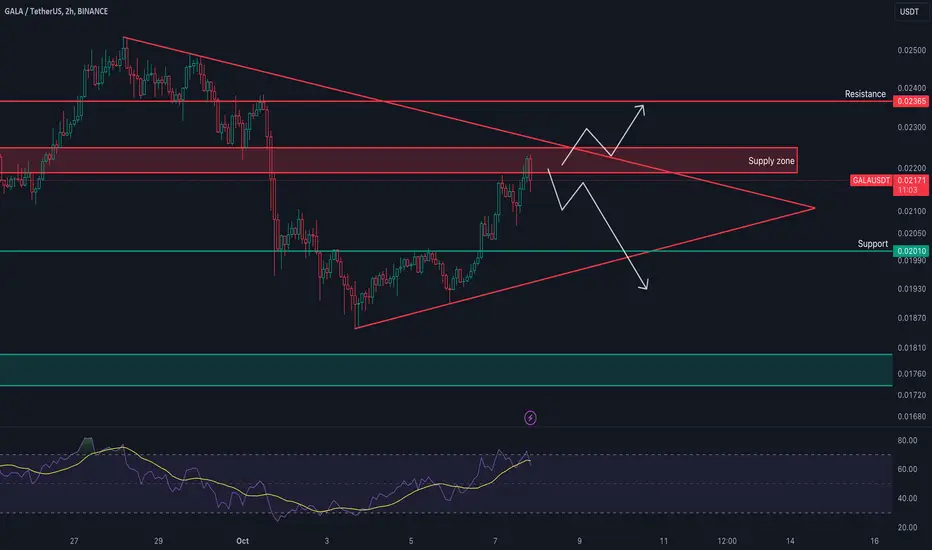
GALA USDT- CLICK HERE TO CHECK FULL ANALYSISThe breakout of the triangle will decide the direction, RSI is also in the overbought region.
GALAUSDT.PS trade ideas
GALAUSDT LONG IDEAA very clear and beautiful accumulation structure.
The coin found support at the level of 0.016-0.013 cents. If the price falls below the “red circle” the scenario requires revision. All targets are indicated on the chart.

#galausdt LON🚀🚀🚀 Better put your sealtbelt on!! We have a completed correction of more than 80%. with that Wave 2.... It may take a few weeks, but we're going there... Currently oversold on multiple timeframes! NFA!!

GALA short term outlookGALA pushing up in this ascending wedge.
Looks to be reaching a point where it should lose momentum and retrace a bit.
Potential to take some profits if in a long trade here and add on should price retrace a bit.
Key areas will be when price returns to key support areas around midchannel and at the lower bounds of the channel.
Potential long entry around 0.01844 area with invalidation at previous low (0.01358).
Bullish scenario could be if price were to get above the current resistance and flip to support.
GALA SHORT IDEAGALA has reached to 4h supply and shown engulfig.I can see a FO from a CP so i open Short position on galausdt.
enty:0.02160
tp1:0.02044
tp2:0.01810
sl:0.02252
r/r:3.8

GALA/USDT Analysis.GALA/USDT has formed my A+ setup here. Did MSS and we have to find a order block with fvg to open long. And its on the chart. lets go then. Easy setup if price come at this zone. Dont open blindly long just wait for CHoCH on LTF.

Watching for the second breakout $GALA #GALAUSDT #GALAUSD #GALA Watching for the second breakout INDEX:GALA #GALAUSDT #GALAUSD #GALA

38% and 777% rise? let us see! Zoom in and Zoom Out.AI angd Gaming token is set for a hogh stakes rise.
we can seee that Gala is set for a rise minimum 38% retracement from here.
enjoy.

#GALA/USDT#GALA
The price is moving in a descending channel on the 4-hour frame and is sticking to it very well and is expected to break it upwards
We have a bounce from a major support area at the lower line of the channel at 0.01660
We have a downtrend on the RSI indicator which supports the rise
We have a trend to stabilize above the moving average 100
Entry price 0.01700
First target 0.01833
Second target 0.01964
Third target 0.02080

Breakout Alert: #GALA Ready for a Major Move After Breakout Yello, Paradisers! Is #GALA breakout from a descending channel a game-changer or just a trap? Let's dive into the latest analysis of #GALAUSDT:
💎#GaLa has just broken above the Descending Channel after months of consolidation between $0.0154-$0.0166. This breakout could be huge, as INDEX:GALA has been stuck in this range for 4-5 months, but now, we’re seeing a potential shift toward bullish momentum.
💎For the bullish rally to take off, #GALAUSDT needs to break above the internal resistance at $0.0244. If it clears that level, the next target will be the major resistance zone, which could spark a much stronger rally.
💎However, don’t celebrate just yet. If GALA loses steam, we might see a pullback to retest the breakout around the demand zone. Failure to hold here could send the price down toward the lower demand zone at $0.0131.
💎A breakdown below this lower support would flip the script entirely, and the bears would regain control, potentially driving #GALA even lower.
Stay focused, patient, and disciplined, Paradisers🥂
MyCryptoParadise
iFeel the success🌴


GALA SHORTI'm short on Gala as it has rejected a major zone twice on the 15-minute timeframe, and I expect the price to decline.

GALA USD LONG IDEAGALA price has been forming a triangle pattern for a long time now and the price breaks the upper boundary of the triangle the impulsive upward growth has started although the retest is yet to happen.
The main zone where the price can reach is the range of $0.0250 - $0.0265.
PEACE.

GALA price is lurking to surprise us?)Those who hold #GALA can only wait for the "heavier" coins to start growing as well.
Those who want to buy OKX:GALAUSDT should wait for a breakout and consolidation above the trend line.
✔️ It should have grown to at least $0.34
😱 But holders' dreams are at least $1-1.10 (a nostalgic memory, because it was from this range that the x10 price pumps of #GALAUSD began in 2021 ;)
_____________________
Did you like our analysis? Leave a comment, like, and follow to get more

GALA-LALALALALAResistance is getting sledgehammered repeatedly on the daily, and will break eventually.
Diagonal trendline on the daily puts this in a downtrend for a while.
Break both and this rips.
GLHF.
I've longed.


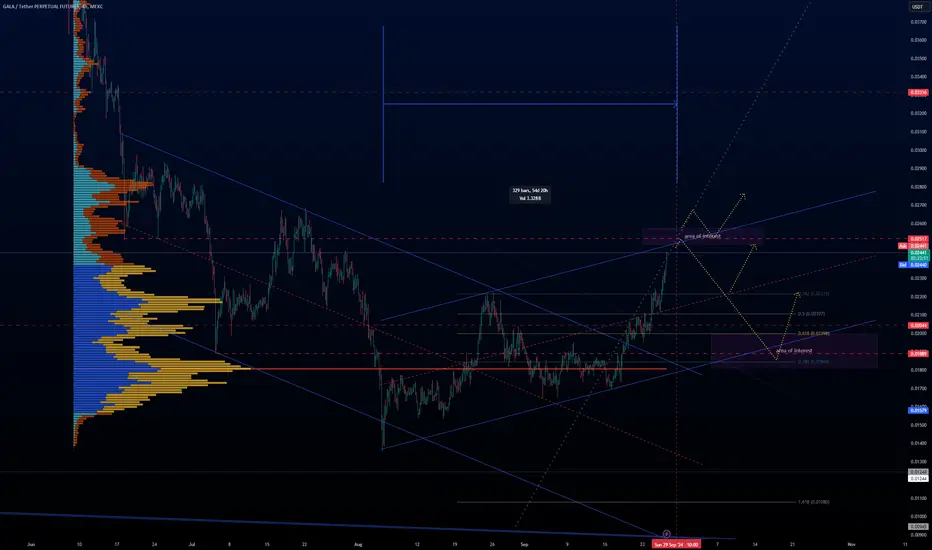
Is This the Start of a Major Rally for GALA/USDT?
Technical Analysis:
1. Double Bottom Formation and Reversal Signal:
GALA/USDT has formed a double bottom pattern around the $0.01540 level, indicating a strong support zone and a potential reversal from the previous downtrend. This pattern is a classic bullish reversal signal, showing that buyers have stepped in at this level twice to stop the decline.
2. Key Levels and Confirmation Points:
To add further confirmation to the bullish reversal, the price needs to break and hold above the $0.02225 level. This breakout would indicate a stronger shift in market structure, increasing the likelihood of a sustained bullish trend.
The next key resistance level to watch after $0.02225 is $0.03440 . A break above this level would further solidify the bullish reversal, potentially leading to a more significant rally.
A crucial level beyond this is $0.06000 . If the price can overcome this resistance, it could trigger a more extended rally, aligning with the long-term reversal scenario.
3. Potential Upside Targets:
The initial upside target following a confirmed breakout is around $0.03440 . Successfully breaking through this level would suggest that the bullish trend is gaining strength.
A projected extension target based on the double bottom formation is set at $0.0750 , representing an impressive 280% potential upside from the current price levels.
4. Change of Character (ChoCH) and Market Structure:
The Change of Character (ChoCH) marker on the chart indicates a shift in the market structure, providing an early signal that the downtrend may be ending. This aligns with the potential bullish breakout and double bottom formation, adding further weight to the bullish outlook.
The price needs to continue holding above key support levels and break through resistance, particularly the $0.02225 level, to maintain this change in character and sustain the upward momentum.
5. Risk Management and Entry Strategy:
Given the current setup, it’s crucial to manage risk by setting a stop-loss below the support at $0.01356 . This would protect against a potential false breakout and a return to the downtrend.
Traders may consider entering on a confirmed breakout above the $0.02225 level or on pullbacks towards this level for additional confirmation of the bullish trend.
6. Conclusion:
GALA/USDT is showing strong signs of a bullish reversal with a confirmed double bottom pattern, a breakout above descending trendline, and a marked Change of Character (ChoCH) . The key confirmation point to watch is the $0.02225 level, followed by potential upside targets at $0.03440 and $0.0600 . Traders should look for continued confirmation and manage risk appropriately around key support levels.
What's your take on GALA/USDT's double bottom breakout? Do you see this as a strong reversal opportunity, or are you waiting for further confirmation at key levels? Share your insights and strategies for navigating this setup.
_________________________________________________________________
The information and publications within the 3Commas TradingView account are not meant to be and do not constitute financial, investment, trading, or other types of advice or recommendations supplied or endorsed by 3Commas and any of the parties acting on behalf of 3Commas, including its employees, contractors, ambassadors, etc.

GALA failure again to go back to value!AS always! Back to an old range's value for a rotation
Short this!!

Long trade entry ? ICT ? Breaker Block ?Here is a possible trade entry, if I have well understood this ICT concept (I could have not understood well !).

Gala potential 157% gainGala has broken out of a falling wedge dating all the way back to March, retested and trying to run!

GALAUSDT.1DReviewing the daily chart for GALA/USDT, the cryptocurrency currently trades at $0.01799, marking a decrease of 3.49% for the day. The chart shows a downward trend that has been prevalent over the recent months, with a series of lower highs and lower lows.
The Moving Average Convergence Divergence (MACD) indicator is situated slightly below the signal line and close to the zero line, which indicates a weak bearish momentum. The proximity of the MACD to the zero line suggests that while the bearish momentum is present, it's not particularly strong, and the market could be nearing a consolidation phase.
The Relative Strength Index (RSI) at 47.12 is near the neutral 50 threshold, which neither confirms overbought nor oversold conditions. This neutral stance on the RSI points to a potential stabilization in price, though the market sentiment remains cautiously bearish.
On the chart, the key support (S1) and resistance (R1) levels are identified at $0.01327 and $0.01327, respectively. The price is currently approaching the support level, and its ability to hold above this mark could be critical for short-term price action. If GALA fails to sustain above the S1 level, it may face further downward pressure towards the next support (S2) which isn't explicitly marked on the current chart but would likely be below the current trading price.
In conclusion, GALA shows signs of continued bearish momentum with a potential for further declines if it breaks below the support level of $0.01327. Traders should monitor this level closely, as a break below could trigger additional sell-offs, whereas holding above it might provide the basis for some stabilization or minor recovery in the price. This analysis suggests a cautious approach, paying close attention to the S1 support level for indications of the market's next move.

GALA PriceGALA price exchanged hands at $0.01895, with an intraday surge of over 8.90% at press time. It boasts a market cap of $142.53 Million and has a circulating supply of 7.54 Billion.

GALAUSDTGALA ~ 1W
#GALA Are you interested in this Coin? If yes, this is an important support block that you might need to pay attention to. previously the price bounced quite high from this support block. we hope this will happen again.
