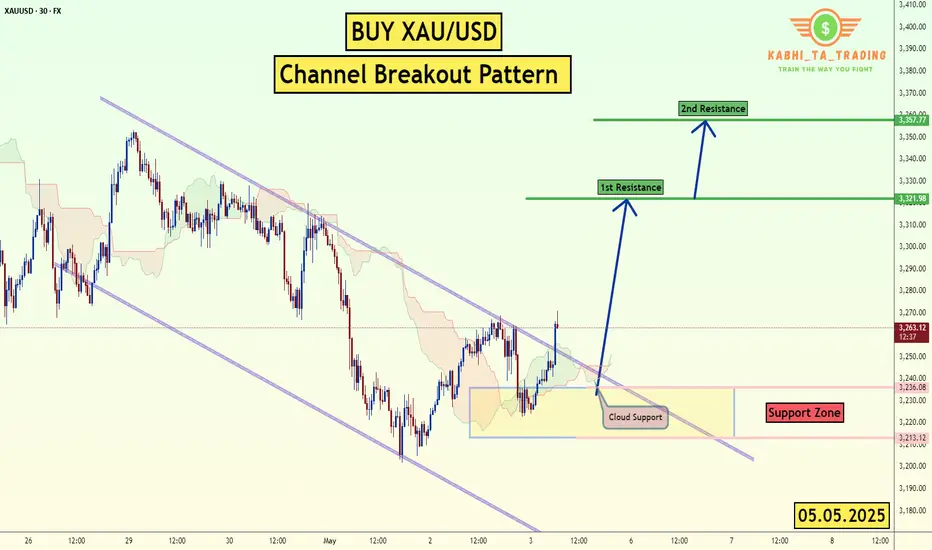
XAU/USD - Channel Breakout (05.05.2025)The XAU/USD pair on the M30 timeframe presents a Potential Buying Opportunity due to a recent Formation of a Channel Breakout Pattern. This suggests a shift in momentum towards the upside and a higher likelihood of further advances in the coming hours.
Possible Long Trade:
Entry: Consider Entering A Long Position around Trendline Of The Pattern.
Target Levels:
1st Resistance – 3321
2nd Resistance – 3357
🎁 Please hit the like button and
🎁 Leave a comment to support for My Post !
Your likes and comments are incredibly motivating and will encourage me to share more analysis with you.
Best Regards, KABHI_TA_TRADING
Thank you.
GOLD.PRO.OTMS trade ideas
GOLD 4H CHART ROUTE MAP UPDATEHey Everyone,
Once again following on from yesterdays update, this 4 chart is also playing out perfectly. After completing both our Bullish 3343 and bearish 3282 targets; we stated price will play tennis between both levels. We also stated that we will look for ema5 cross and lock on either level to determine the next move.
- Ema5 crossed and locked below 3282 opening 3224. This was hit perfectly today on the drop completing the full retracement range. We will now look for a break below this level to open the swing range or failure to lock below will see a retest on the next Goldturn above. Each weighted level is still also providing the 30 to 40 pip bounces, just like we always state.
We will keep the above in mind when taking buys from dips. Our updated levels and weighted levels will allow us to track the movement down and then catch bounces up.
We will continue to buy dips using our support levels taking 30 to 40 pips. As stated before each of our level structures give 20 to 40 pip bounces, which is enough for a nice entry and exit. If you back test the levels we shared every week for the past 24 months, you can see how effectively they were used to trade with or against short/mid term swings and trends.
BULLISH TARGET
3343 - DONE
EMA5 CROSS AND LOCK ABOVE 3343 WILL OPEN THE FOLLOWING BULLISH TARGET
3404
EMA5 CROSS AND LOCK ABOVE 3404 WILL OPEN THE FOLLOWING BULLISH TARGET
3439
EMA5 CROSS AND LOCK ABOVE 3439 WILL OPEN THE FOLLOWING BULLISH TARGET
3503
BEARISH TARGETS
3282 - DONE
EMA5 CROSS AND LOCK BELOW 3282 WILL OPEN THE FOLLOWING BEARISH TARGET
3224 - DONE
EMA5 CROSS AND LOCK BELOW 3224 WILL OPEN THE SWING RANGE
SWING RANGE
3190 - 3138
EMA5 CROSS AND LOCK BELOW 3138 WILL OPEN THE SECONDARY SWING RANGE
SECONDARY SWING RANGE
3088 - 3046
As always, we will keep you all updated with regular updates throughout the week and how we manage the active ideas and setups. Thank you all for your likes, comments and follows, we really appreciate it!
Mr Gold
GoldViewFX

XAU/USD: Gold Eyes $3400+ After Explosive Surge! (READ CAPTION)By analyzing the gold chart on the 1-hour timeframe, we can see that price once again hit our targets! As expected, gold had a strong bullish rally yesterday and today, reaching both $3328 and $3345, and even extending to $3387.
This surge was fueled by escalating tensions in the Middle East, particularly between Israel and Yemen. Since the conflict shows no signs of easing and further threats remain on the table, I believe gold is not done yet — we may soon see it push above $3400.
These are sensitive days, so please be extra cautious with your trades. Don’t let fear or greed take over — consistency and emotional stability are key to long-term success in this market.
I’ll continue posting more frequent updates to help you stay informed — but that depends on your strong support! Let’s keep growing together!
Please support me with your likes and comments to motivate me to share more analysis with you and share your opinion about the possible trend of this chart with me !
Best Regards , Arman Shaban

GOLD Technical Analysis - Deeper Pullback in PlayOANDA:XAUUSD remains within a broader ascending channel, but recent price action suggests that the market is undergoing a deeper corrective phase. Following a prolonged bullish rally, price appears overextended and is now pulling back more decisively.
This correction aligns with expectations for a healthy retracement after such strong upward momentum. I anticipate that the pullback will extend further toward the $3,160 level, a key technical level defined by the confluence of horizontal support, ascending trendline support, and the 0.618 Fibonacci retracement of the latest bullish impulse.
This zone will be critical for determining whether the broader bullish structure remains intact. If price holds at this level and shows signs of reversal, it may present a strong re-entry opportunity for buyers. However, a decisive break below this zone would invalidate the current bullish structure and open the door to a deeper correction.
Always confirm your setups and trade with a proper risk management.
Best of luck!

GOLD ( XAUUSD ) : H4 / D1 : Big Long !!!Hello Traders! 👋
What are your thoughts on Gold?
After a strong upward move, gold entered a corrective phase upon reaching the $3500 resistance zone.
This correction could offer a buy-the-dip opportunity, with potential for a move back toward the recent highs.
XAUUSD
Market price : 3240
Buy limit : 3140 - 3120
Tp1 : 3240
Tp2 : 3340
Tp3 : 3500
Tp4 : 3750
Sl : 3030 ( 100 pip )
Don’t forget to like and share your thoughts in the comments! ❤️

GOLD Analysis - Can buyers push toward 3,410$?OANDA:XAUUSD is trading within a clear ascending channel, with price action consistently respecting both the upper and lower boundaries. The recent bullish momentum indicates that buyers are in control, suggesting there's chances for potential continuation on the upside.
The price has recently broken above a key resistance zone and now came back for a retest. If this level holds as support, it would reinforce the bullish structure and increase the likelihood of a move toward the 3,410 target, which aligns with the channel’s upper boundary.
As long as the price remains above this support zone, the bullish outlook stays intact. However, a failure to hold above this level could invalidate the bullish scenario and increase the likelihood of a deeper pullback.
Remember, always confirm your setups and use proper risk management.

GOLD → Trend reversal, downward distribution, and new targetsFX:XAUUSD breaks through 3270 and enters a distribution phase amid a rising dollar. We are most likely at the beginning of a trend reversal...
On Thursday, gold remains under pressure, trading at a two-week low, as the market reacts to Trump's statements about potential trade agreements with a number of countries, including China. Optimism surrounding the negotiations is boosting risk appetite, reducing interest in gold as a safe-haven asset. Even weak US GDP and inflation data failed to halt the rise in gold prices, as traders' attention is focused on the trade agenda and upcoming labour market statistics.
Gold is changing its trend due to the rise of the dollar and a shift in the fundamental background. A breakout of the local low could reinforce the decline. The first target is 3190. There is a possibility of a retest of the previously broken consolidation support at 3268 before the decline continues.
Resistance levels: 3245, 3270
Support levels: 3190, 3186, 3167
A breakout of the local low of 3221 could trigger a further decline. The first stop could be around 3190. From this level, a small correction or consolidation may follow before the decline continues.
I do not rule out the possibility of a retest of 3245-3270 before the decline continues.
Best regards, R. Linda!

Gold - This week drop to 3167! (best level to buy)Gold recently dropped from 3500 to 3201, which is a pretty significant correction, but I think we are going to go lower. There is a lot of liquidity below the previous triangle and untested major swing high from 2nd April. In general, triangles act like a magnet for whales. When you see a triangle on the chart, you can be almost sure that the price will go back and take liquidity below it. Or at least retest the POC level of a triangle if the trend is very strong.
The 0.618 FIB is the strongest FIB. Then we have the 0.382 and 0.5. If the price is near the 0.618 FIB, there is a very high chance that we are going to hit this level sooner or later. Gold is near this strong fib level + we have to retest the previous swing high.
Right now I am pretty bearish on gold, and I think this week we are going to lower and test 3167. But I am very curious - what do you think about gold, and what is your ultimate bottom to buy it? Tell me in the comment section. Trading is not hard if you have a good coach! It is not a trade setup, as there is no stop-loss or profit target. I share my trades privately. Thank you, and I wish you successful trades!

Gold (XAU/USD) Intraday Buy Setup with High Reward-to-Risk Ratio1. Entry Point Zone: Around 3,271.79 USD
This is identified as a potential buy entry area, marked in purple.
2. Stop Loss: Below the entry point at 3,257.71 USD
Risk management level in case the trade moves against the setup.
3. Target Point One: Between 3,313.75 and 3,317.07 USD
A short-term take-profit level, likely based on previous resistance.
4. Final Target (EA Target Point): Around 3,373.04 USD
A more ambitious take-profit, possibly based on a major resistance level or Fibonacci extension.
5. Trade Range:
Risk: 3,271.79 - 3,257.71 = 14.08 USD
Reward to First Target: ~42 USD

XAU/USD) Bullish reversal analysis Read The ChaptianSMC Trading point update
technical analysis of Gold Spot (XAU/USD) on the 4-hour timeframe, projecting a bullish outlook. Here's a breakdown of the main ideas conveyed:
1. Support Level & Double Bottom
A strong support level is marked around the 3,177 area, with the price bouncing from it twice (highlighted by two black dots), indicating a potential double bottom pattern, which is typically a bullish reversal signal.
2. EMA 200 Support
The 200 EMA (Exponential Moving Average) lies just below the current price (~3,177), acting as dynamic support. The fact that price is holding above it adds strength to the bullish argument.
3. Bullish Divergence on RSI
The RSI (Relative Strength Index) shows a bullish divergence, where the price made lower lows but RSI made higher lows—another potential reversal indicator.
4. Price Projection
If the bullish move plays out, the chart outlines two upward targets:
Target Point: ~3,501.67
Next Target Point: ~3,729.23
These are based on measured moves from previous impulse legs (shown by vertical blue projections).
5. Entry Setup
The chart suggests a break above the short-term consolidation could trigger the bullish run toward the first target, aligning with bullish price structure and support confirmation.
Mr SMC Trading point
---
Overall Idea: The chart expects a bullish reversal from support, confirmed by double bottom, EMA 200 support, and RSI divergence, targeting higher resistance zones.
Pales support boost 🚀 analysis follow)

Hellena | GOLD (4H): LONG to resistance area of 3400.Colleagues, I've redrawn the waves a bit, because it looks like the correction should be over.
I believe that the upward movement will resume soon.
I expect two variants of events:
1) the price will reach the support area 3162, form wave “4” and after that we will see an upward movement - this is a variant of entering a position with pending limit orders.
2) Price has already formed wave “4” and then we will see only upward movement. This is a variant of market entry.
In both cases I expect the price to come to the target in the resistance area of 3400. This is a pretty strong level from which there could be a strong correction.
Manage your capital correctly and competently! Only enter trades based on reliable patterns!

Lingrid | GOLD trendline BREAKOUT: Short-Term BEARISH MoveOANDA:XAUUSD made a strong bullish run, but after reaching the top near 3500, the price entered a sideways range and recently broke below the upward trend-line. Now it’s retesting the 3,283–3,300 zone, which may act as resistance. If price fails here, we could see a drop back to the 3,150 support area. Bulls will need a solid recovery above 3,300 to regain control.
📈 Key Levels
Sell zone: 3,283 – 3,300
Sell trigger: rejection from retest area
Target: 3,150
Buy trigger: strong breakout and hold above 3,300
💡 Risks
Gold is sensitive to US macro data this week (FOMC, NFP, PCE).
Retest of the trend-line might trigger volatility and fakeouts.
Break above 3,300 could invalidate the bearish scenario.
Traders, if you liked this idea or if you have your own opinion about it, write in the comments. I will be glad 👩💻

Gold can correct to support level and then continue to move upHello traders, I want share with you my opinion about Gold. After studying this chart, we can track the progression of Gold's price action from strong bullish momentum to its current consolidation. Initially, the market trended confidently inside an upward channel, with steady growth supported by the lower boundary of the channel and occasional corrections after touching the resistance line. Each pullback respected previous support zones, a strong signal of buyer control at the time. The most impulsive move came after the price exited the buyer zone, followed by a clean breakout above the resistance line of the channel. However, once the price entered the seller zone, we saw the momentum start to fade. A strong rejection occurred near the resistance level at 3370, which eventually triggered a series of lower highs and shifted the market into a more neutral, range-bound phase. Currently, Gold is trading inside a defined range between 3205 and 3370. The bottom of this range aligns perfectly with the buyer zone, which already acted as a strong support during the last decline. We can also observe the market beginning to show signs of reversal after tapping the zone again. Given the reaction from the support area and the structure of the range, I expect the price can bounce back and make another attempt to reach the 3370 resistance level, which is my TP1 for this scenario. Please share this idea with your friends and click Boost 🚀

GOLD - Bullish Structure with Potential Continuation PlayThe current 1-hour chart of Gold (XAU/USD) demonstrates a clean bullish structure supported by an ascending channel and multiple unmitigated Fair Value Gaps (FVGs) acting as potential demand zones. This setup highlights the strength of the ongoing uptrend and offers insights into a high-probability continuation entry should price retrace.
Market Context and Trend Structure:
Following a prolonged downtrend visible in the earlier part of the chart, Gold reversed decisively with a bullish break of structure. Since then, price has been consistently printing higher highs and higher lows while respecting an ascending parallel channel. This channel, marked by two trendlines, encapsulates the short-term bullish momentum.
The current move is strong and impulsive, suggesting that institutional order flow is behind this leg. Candles are elongated with minimal wicks on the upside, reinforcing the idea of aggressive buying pressure.
Key Demand Zones and FVG Analysis:
Three major Fair Value Gaps (FVGs) have formed along the recent bullish leg, each potentially acting as a zone of reaccumulation. These FVGs are marked in green and correspond to areas where price left inefficiency after strong upward moves without immediate retracements.
* The most recent FVG, located just beneath current price, aligns with a minor structure support zone and overlaps partially with the lower boundary of the ascending channel. This area stands out as a prime candidate for a bullish continuation entry, particularly if price retraces and shows signs of holding.
* The middle FVG, slightly lower in the structure, represents a deeper mitigation level and could serve as a secondary entry in case the initial zone fails to hold.
* The lowest FVG is a broader inefficiency zone that formed near the base of the bullish reversal. If price returns this far, it would likely signify a temporary shift in momentum or deeper liquidity hunt before another leg upward.
Channel Structure and Momentum:
The ascending channel has been respected throughout the rally, offering visual confirmation of trend strength and the rhythm of pullbacks. The current price is near the upper boundary of the channel, and a short-term retracement is a logical expectation before continuation.
A pullback into the FVG + lower channel region would represent a convergence of structure, imbalance, and trendline support. These overlapping technical elements enhance the probability of a bounce from this zone.
Projected Path:
The chart also suggests a conservative bullish continuation projection, aiming toward the zone marked around 3449.12. This level appears to be a measured move extension and a safer target in relation to the overall structure. However, the note on the chart implies that the all-time high (ATH) could also be in play if momentum continues and market conditions remain supportive.
The key here is the behavior around the nearest FVG. If price retraces and holds this area—potentially forming a bullish engulfing or confirmation on lower timeframes—it may offer an ideal continuation entry with minimal drawdown.
Conclusion:
This Gold 1-hour chart reflects a strong bullish structure with clear institutional footprints left in the form of unmitigated FVGs. The alignment of ascending channel support and bullish imbalances creates a favorable setup for continuation traders. Watching the immediate FVG zone will be critical, as it may define the next impulsive leg toward higher targets. If that zone fails, deeper FVGs below offer secondary opportunities while maintaining the bullish bias as long as structural higher lows remain intact.

GOLD - Price can grow to $3370 resistance levelHi guys, this is my overview for XAUUSD, feel free to check it and write your feedback in comments👊
Recently, price entered to pennant, where it at once bounced from support line and started to grow, but soon corrected.
After this movement, Gold made upward impulse, and broke $3205 level, after which it made retest and continued to move up mext.
Soon, it reached $3370 level, broke it and then rose to resistance line of pennant, after which started to fall.
In a short time, price declined below $3370 level, breaking it again, and then some time traded below.
Later, Gold continued to fall and declined to support level, which coincided with support line of pennant.
Now, I think that price can bounce up from support level to $3370 level, exiting from pennant pattern.
If this post is useful to you, you can support me with like/boost and advice in comments❤️

Lingrid | GOLD Weekly OUTLOOK: Poised for BULLISH ReversalOANDA:XAUUSD market has retraced approximately 50% of the previous month's range and is approaching the critical golden zone at the 61.8% Fibonacci retracement level. After experiencing such strong bullish momentum, we've now witnessed two consecutive red weeks, suggesting a potential reversal point.
Price is currently testing the previous resistance zone, which has now established itself as support—a classic market structure confirmation. The formation of equal weekly lows beneath current price levels represents significant liquidity that could fuel an upward move.
Furthermore, the price action appears to be completing an ABC pullback pattern, which typically precedes trend continuation. This bullish outlook is further reinforced by the emergence of a falling wedge pattern, a technical formation that frequently resolves to the upside.
Overall, I expect prices to move higher in the coming week, potentially catalyzed by the upcoming Federal Funds Rate decision, which could provide the fundamental backdrop for the next leg up in gold's price trajectory.
Traders, if you liked this idea or if you have your own opinion about it, write in the comments. I will be glad 👩💻

GOLD 1H CHART ROUTE MAP & TRADING PLAN FOR THE WEEKHey Everyone,
Please see our updated 1h chart levels and targets for the coming week.
We are seeing price play between two weighted levels with a gap above at 3260 and a gap below at 3217. We will need to see ema5 cross and lock on either weighted level to determine the next range. EMA5 is lagging below 3306 so will need a close above and then below to confirm.
We will see levels tested side by side until one of the weighted levels break and lock to confirm direction for the next range.
We will keep the above in mind when taking buys from dips. Our updated levels and weighted levels will allow us to track the movement down and then catch bounces up.
We will continue to buy dips using our support levels taking 30 to 40 pips. As stated before each of our level structures give 20 to 40 pip bounces, which is enough for a nice entry and exit. If you back test the levels we shared every week for the past 24 months, you can see how effectively they were used to trade with or against short/mid term swings and trends.
The swing range give bigger bounces then our weighted levels that's the difference between weighted levels and swing ranges.
BULLISH TARGET
3260
EMA5 CROSS AND LOCK ABOVE 3260 WILL OPEN THE FOLLOWING BULLISH TARGETS
3308
EMA5 CROSS AND LOCK ABOVE 3308 WILL OPEN THE FOLLOWING BULLISH TARGET
3340
EMA5 CROSS AND LOCK ABOVE 3340 WILL OPEN THE FOLLOWING BULLISH TARGET
3382
EMA5 CROSS AND LOCK ABOVE 3382 WILL OPEN THE FOLLOWING BULLISH TARGETS
3428
EMA5 CROSS AND LOCK ABOVE 3428 WILL OPEN THE FOLLOWING BULLISH TARGETS
3478
BEARISH TARGETS
3217
EMA5 CROSS AND LOCK BELOW 3217 WILL OPEN THE BEARISH TARGETS
3174
EMA5 CROSS AND LOCK BELOW 3174 WILL OPEN THE SWING RNGE
3126
3078
EMA5 CROSS AND LOCK BELOW 3078 WILL OPEN THE SECONDARY SWING RANGE
SECONDARY SWING RANGE
3034 - 2979
As always, we will keep you all updated with regular updates throughout the week and how we manage the active ideas and setups. Thank you all for your likes, comments and follows, we really appreciate it!
Mr Gold
GoldViewFX

GOLD → Gold not ready to fall? What's going on?FX:XAUUSD is forming a local bottom and is not ready to continue falling. The price is breaking through the downward resistance amid a weakening dollar and a complicated fundamental backdrop.
At the beginning of the week, the price of gold stabilized above $3,250 as investors returned to defensive assets due to ongoing uncertainty surrounding US trade agreements with China and Japan, as well as growing geopolitical tensions in the Middle East and Ukraine.
The weakness of the dollar ahead of the Fed meeting and declining expectations of a rate cut are also supporting demand for gold. The focus remains on US trade news and the possible hawkish tone of the Fed this week.
Technically, the price is testing the bottom of the range as resistance. If there is no reaction to the false breakout and the price continues to storm 3268, then a breakout and consolidation above the level will allow it to strengthen to 3292-3314.
Resistance levels: 3269, 3294, 3314
Support levels: 3243, 3222, 3204
The price is forming a second retest of 3269 since the session opened. Buyers are testing resistance for a breakout. If the bulls break 3269 and consolidate above 3270, the chances for growth will be good. I do not rule out the possibility of a retest of the liquidity zone at 3243 before growth.
Best regards, R. Linda!

XAUUSDHello Traders! 👋
What are your thoughts on Gold?
After a strong upward move, gold entered a corrective phase upon reaching the $3500 resistance zone.
The current pullback is expected to extend toward the identified support area and the ascending trendline, where buying interest may reappear.
As long as gold holds above the support and trendline, the long-term trend remains bullish.
This correction could offer a buy-the-dip opportunity, with potential for a move back toward the recent highs.
Will gold find support and resume its rally? Share your thoughts below!
Don’t forget to like and share your thoughts in the comments! ❤️

How to Trade Gold with AI-Powered Algos in 2025📊 How to Trade Gold with AI-Powered Algos in 2025
A practical action plan for serious gold traders
🔍 1. Know Why Gold Requires Custom Algo Tactics
Gold is volatile, news-sensitive, and driven by macro events like Fed policy, geopolitics, and inflation. Generic stock or crypto bots fail here — gold needs precise, event-aware automation.
🧠 2. Use AI-Powered Bots Trained for Gold Volatility
Deploy bots that adapt to real-time data like CPI releases, bond yields, and geopolitical headlines. Use machine learning models that detect gold breakouts, consolidations, and safe-haven flows.
Top AI algos for gold traders: Multiple systems based on MT4/MT5
Fully-automated, AI-based gold bot with breakout detection, precision entries, and built-in risk control.
⚙️ 3. Build or Choose the Right Algo Strategy for Gold
Trend-Following: Use 21/50 EMA crosses on H1 and H4
Mean Reversion: Bollinger Band fades in range-bound sessions
Breakout Algos: Trigger trades on CPI or FOMC event volatility
Volume-Based AI: Analyze volume spikes vs. historical patterns
🧪 4. Backtest Gold-Specific Models
Always test your bot using historical gold data, especially during NFP weeks, Fed meetings, and geopolitical escalations. Use data from 2018 to 2024 for high-volatility periods.
Tools: TradingView for Pine Script testing, MetaTrader 5 for EA deployment
🛡️ 5. Control Risk with Gold-Specific Parameters
Max drawdown: Keep under 15 percent
Stop-loss: Always use hard stops (not just trailing)
Position sizing: 0.5 to 1 percent of capital per trade
Use volatility filters: Avoid entries during thin liquidity hours
🔄 6. Automate Monitoring and Adaptation
Run multiple bots for breakout, momentum, and reversal setups
Use dashboards to track gold-specific metrics like VIX, USDX, DXY, and 10Y Treasury yields Integrate AI that adjusts parameters after major data releases
🚀 7. Prepare for 2025 Market Structure
Gold is increasingly driven by
Central bank digital currency rollouts
USD de-dollarization risks
Global stagflation or recession themes
DeFi and tokenized gold products
Your algo must factor in these macro narratives using real-time data feeds
📌 Gold Algo Trading Success Plan 2025
Use AI bots built for gold volatility
Trade high-probability breakouts post-news
Backtest with gold-specific macro filters
Maintain strict risk limits with max 15 percent drawdown
Monitor global news and macro data with bot triggers
Continuously optimize and adapt
Gold is not just a commodity — it’s a signal of global risk. Automate smartly, manage risk tightly, and use AI to stay one move ahead.

Gold - Bearish continuation towards a strong support!Gold has been in a strong and consistent uptrend, supported by macroeconomic uncertainty and a favorable risk environment. However, on the lower timeframes, price action is showing signs of temporary weakness following a sharp sell-off a few days ago.
Currently, on the 4h chart, Gold appears to be forming a bearish continuation pattern, specifically a pennant. This type of consolidation after a fast drop often suggests potential for further downside. If the pennant breaks to the downside, the projected target aligns with the golden pocket of the latest bullish move, between $3,165 and $3,147. Notably, this level also coincides with a strong support zone, making it a high-interest area for potential long setups.
Despite the bearish pennant, the broader trend remains bullish, which means a break to the upside is still possible. However, given the current 4h structure, I'm leaning cautiously bearish in the short term and will be watching closely for signs of strength at the key support.
My plan is to look for long opportunities near the golden pocket, but only if certain criteria are met, primarily, signs of downside exhaustion such as a bullish candlestick formation on the lower timeframes. It's critical not to "catch a falling knife"; confirmation is essential before entering any long trade.
Thanks for your support.
- Make sure to follow me so you don't miss out on the next analysis!
- Drop a like and leave a comment!

GOLD ROUTE MAP UPDATEHey Everyone,
Another PIPTASTIC day on the charts with our chart idea playing out as analysed.
After completing 3260 and 3308 yesterday, we stated that we now had ema5 lock above 3308 opening 3340.
- This was done perfectly completing this target with plenty of time to get in for the action. We are now seeing ema5 lock above 3340 leaving 3428 open. Any rejections on this zone will see price testing the lower Goldturns for suport and bonce inline with our plans to buy dips within the overall structure.
We will keep the above in mind when taking buys from dips. Our updated levels and weighted levels will allow us to track the movement down and then catch bounces up.
We will continue to buy dips using our support levels taking 20 to 40 pips. As stated before each of our level structures give 20 to 40 pip bounces, which is enough for a nice entry and exit. If you back test the levels we shared every week for the past 24 months, you can see how effectively they were used to trade with or against short/mid term swings and trends.
The swing range give bigger bounces then our weighted levels that's the difference between weighted levels and swing ranges.
BULLISH TARGET
3260 - DONE
EMA5 CROSS AND LOCK ABOVE 3260 WILL OPEN THE FOLLOWING BULLISH TARGETS
3308 - DONE
EMA5 CROSS AND LOCK ABOVE 3308 WILL OPEN THE FOLLOWING BULLISH TARGET
3340 -DONE
EMA5 CROSS AND LOCK ABOVE 3340 WILL OPEN THE FOLLOWING BULLISH TARGET
3382
EMA5 CROSS AND LOCK ABOVE 3382 WILL OPEN THE FOLLOWING BULLISH TARGETS
3428
EMA5 CROSS AND LOCK ABOVE 3428 WILL OPEN THE FOLLOWING BULLISH TARGETS
3478
BEARISH TARGETS
3217
EMA5 CROSS AND LOCK BELOW 3217 WILL OPEN THE BEARISH TARGETS
3174
EMA5 CROSS AND LOCK BELOW 3174 WILL OPEN THE SWING RNGE
3126
3078
EMA5 CROSS AND LOCK BELOW 3078 WILL OPEN THE SECONDARY SWING RANGE
SECONDARY SWING RANGE
3034 - 2979
As always, we will keep you all updated with regular updates throughout the week and how we manage the active ideas and setups. Thank you all for your likes, comments and follows, we really appreciate it!
Mr Gold
GoldViewFX

XAUUSD COT and Liquidity AnalysisCOT Report Analysis:
If wee look deeper in to the COT data we can see that market makers been
actually selling this rally. Since they had 356K net longs they been taking profits
on the way. Now we can see that shorts are also slightly increasing.
I would be only bearish for now until 3000. May is also one of the strongest months for USD:
Dollar Seasonal Tendencies
Hey what up traders welcome to the COT data and Liquidity report. This is a big part of my FX Trading. Im always trying to trade with the Big players so knowing their positions is good thing.
Please be aware that institutions report data to the SEC on Tuesdays and data are reported on Fridays - so again we as retail traders have disadvantage, but there is possibility to read between the lines. Remember in the report is what they want you to see, that's why mostly price reverse on Wednesday after the report so their cards are hidden as long as possible. However if the trend is running you can read it and use for your advantage.
I created this simple free indicator which you can find in the my scripts. It's highlighting the day of the real report - Tuesday.
Here is the tip if the level has confluence with the high volume on COT it can be strong support / Resistance.
Analysis done on the Tradenation Charts
Disclosure: I am part of Trade Nation's Influencer program and receive a monthly fee for using their TradingView charts in my analysis.
"Adapt what is useful, reject what is useless, and add what is specifically your own."
— David Perk aka Dave FX Hunter ⚔️
