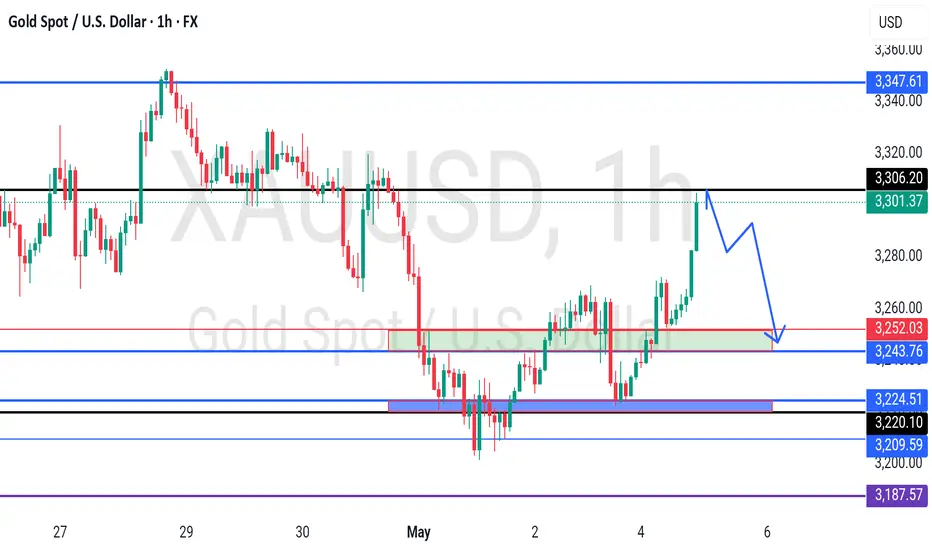
XAUUSD 6/5/25We remain bearish on gold, as we called in the middle of last week. However, until we see a clear reaction that confirms a move lower, we believe price could still push higher.
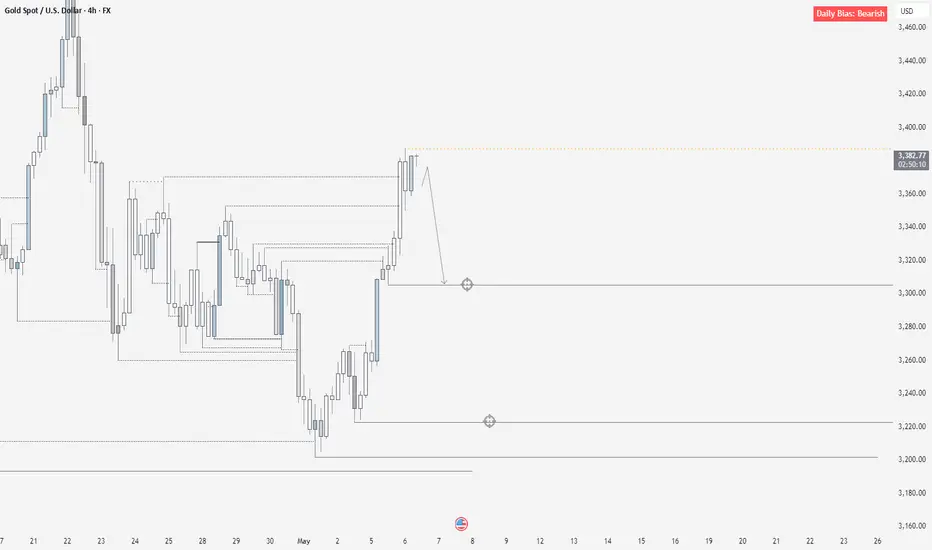
Fundamentally, we are bullish on gold, but our current bias is bearish. Of course, our bias can be wrong. When price pulls back within our bias—essentially moving against what we expect—it doesn’t mean we blindly jump in just because we believe in a certain direction. Instead, we wait for a clear reaction in line with our bias before entering, so we can follow the trend with confirmation.
Remember the principles we always emphasize: our bias is the direction we believe price is heading. But if we’re welcomed into the market during a pullback—even if it’s against our bias—we will trade it accordingly. Right now, we are not being welcomed. Price is rallying against our bias, so we remain on the sidelines until a suitable entry is provided.
As mentioned before, Orion has indicated that price action could be bearish. However, gold is heavily driven by fundamentals, which means we may not get an entry here at all. If the market shifts and our bias needs to change, we’ll adapt as always. But we stick to our rules, manage our risk, and let price show us where it wants to go.
At the current point, if we don’t see a bearish move from here, we could be on track to see a new all-time high. For now, we’re not seeing an entry setup, which means our bias is not being fulfilled for a trade. As far as I'm concerned, this is the last potential reversal zone for gold.
Keep this in mind if price continues to push higher as today's session begins. Trade safe, stick to your plan, and let Orion lead the way.
GOLD.PRO.OTMS trade ideas
Gold on expected upswingTechnical analysis: Nothing irregular at the moment on the Short-term as Gold (Xau-Usd Spot) continues to Trade on Buying extension taken from local Low's Bullish accumulation within #3,370’s zone with clear Resistance point, and Support levels / ready to deliver the breakout I was after. I highlighted many times recently that every / more serious decline may represent Buying accumulation towards new ATH's. The underlying Medium-term trend is still Bullish, so if the Intra-day Low breaks throughout today’s session, then I expect another run towards the #3,400.80 benchmark / Higher High's Upper zone and possible benchmark extension. One important difference though: the Hourly Moving Average broke and for the first time in #3 sessions Gold was testing it from below as a Resistance (this was needed to break again to comfort Buyers). However, if (November #4 - #9) / (January #1 - #6) (January #20 - #25) variance is yet to be repeated, Gold finished the same pattern (Trading on such configuration) and now should engage the aggressive decline once local High's are met.
My position: My practical suggestion is to Buy every dip on Gold.

GOLD - WAVE 4 CORRECTION TO $2,800 (UPDATE)We've seen a nice melt off on Gold this week. We're seeing a little push higher today as its the end of the week. But don't forget Gold is still in a downside correction in the mid term. SELL THE PUMPS.
Still looking for some form of 'Simple 3 Sub-Wave (A,B,C)' or 'Complex 5 Sub-Wave (A,B,C,D,E)' correction towards our longer term buying target at $2,800📈

Fed interest rate suspense and tariff shockGiven the current heightened uncertainty, the implementation of tariff policies, rising inflation expectations, and declining household and business confidence, the market generally expects the Federal Reserve to keep its policy interest rate unchanged this week. Fed Chairman Powell may hint that he is not in a hurry to cut interest rates, and mentioned that tariffs will push up inflation and drag down economic growth. With the implementation of tariffs, inflation will rise significantly in the coming months, and the US economy may fall into a mild recession in the second half of the year, with economic activity and employment likely to shrink in the third and fourth quarters.
In terms of gold, yesterday the lowest fell to 3305 and began to stabilize and rise. It closed at 3334. The daily line closed with a big positive column. Gold opened slightly with a slight correction of 3323 and began to stabilize and rise. Asian gold once again made a strong effort to rise to the highest position of 3386. The current lowest is 3353. It is currently at noon. It is hovering at 3365, and the overall trend is strong, but the excessive rise seems to reserve rhythm space for the next European and American trading. Be careful with short covering. The current upper resistance is at 3372-3377, and the lower support is at 3324-3317. In terms of operation, it is recommended to rebound and short.
Operation strategy 1: It is recommended to short on the rebound at 3372-3377, stop loss at 3382, and the target is 3350-3325.

Will gold fall after encountering resistance at its high point?Planning your trading is the prerequisite for making profits. The essence of the market is the cycle of highs and lows, alternating ups and downs, and the essence of trading is to grasp the relative highs and lows in the market and snipe valuable trading opportunities. This value has only two points: first, probability, and second, space.
After the gold price rose, we will analyze the trend of it correcting from the high to 3200. The key position of this rebound, that is, the 618 position, is near 3386. The gold price encountered resistance here in the morning. So technically this suppression can be used as a key reference for the future market. Today in the Asian session, we will first observe the support situation of 3350. If it breaks down, then before the interest rate decision in the early hours of Thursday, we will pay attention to whether the gold price can stand firmly above 3272. If this position is not stable, then the second half of the week will still be a downtrend. This wave of rise can only be regarded as a rebound repair, not a bull return (the premise is that 3386 above must not be broken).
Today's gold short-term operation ideas suggest that rebounding is the main focus, and callbacks are supplemented by longs. The upper short-term focus is on the 3386-3390 first-line resistance, and the lower short-term focus is on the 3320-3300 first-line support. All friends must keep up with the rhythm.
Short position strategy:
Strategy 1: Short 20% of the gold position in batches when it rebounds to around 3380-3385, stop loss 6 points, target around 3350-3330, and look at 3320 if it breaks;
Long position strategy:
Strategy 2: Long 20% of the gold position in batches when it pulls back to around 3315-3320, stop loss 6 points, target around 3340-3360, and look at 3380 if it breaks;

Analysis of gold operation strategy next week
The latest April non-farm payrolls report released by the U.S. Bureau of Labor Statistics (BLS) has attracted much attention from the market. The report shows that the U.S. economy added 177,000 jobs that month, higher than the market expectation of 130,000, indicating that the U.S. labor market still shows strong resilience. At the same time, the unemployment rate remained at 4.2%, in line with market expectations, while the previously released March data was revised down from 228,000 to 185,000. This data adjustment is an official routine operation. In terms of wages, the average hourly wage increased slightly lower than the market expectation of 0.2% month-on-month, and fell short of the expected 0.3%; however, the year-on-year growth rate remained at 3.8%, higher than the current inflation level, suggesting that real income is still showing an upward trend.
After the release of the non-farm data, the market reacted quickly but the trend was divided. Spot gold fell about $9 to $3,250/ounce within a minute after the data was released, but then quickly rebounded to $3,255/ounce, with an intraday increase of 0.56%. In the short term, the two price levels of 3,260 and 3,265 have become the resistance levels of market attention. Overall, the unexpected performance of the non-farm payrolls in April has boosted the market's short-term confidence. However, the downward revision of historical data and external uncertainties still keep investors cautious. Risk assets may still have some room for growth in the short term, but in the medium and long term, downside risks are gradually accumulating.
After the release of the non-farm payrolls, the price of gold fell as expected, but then quickly bottomed out and rebounded, continuing to fluctuate. The impact of recent non-farm payrolls on the gold market seems to be gradually weakening, and its volatility is even less than usual. The gold 1-hour moving average crosses the downward short position arrangement, and eventually continues to diverge downward. Gold is now under pressure to fall back at the 3270 line, so next week, around 3270 will still be the key turning point for gold bulls and bears. Although gold has rebounded, the decline is not large. If gold is under pressure at 3270 next week and does not break, it will be a shock at most. Gold bulls will not reverse easily for the time being.
Operation strategy:
1. It is recommended to short gold near 3260 next week, with a stop loss at 3270 and a target of 3240
Hello traders, if you have better ideas and suggestions, welcome to leave a message below, I will be very happy

xauusd4k target as high as 4200 have to see. 5th wave again likely extending. Possible ending diag. 50% is been tapped but it can go lower, 2956 is ivalidation watch for red line at 3150 aea if this c goes further down.

XAUUSD DAILY PLAN & MARKET UPDATE — APRIL 30, 2025Not predictions. Structure. Logic. Execution.
📍 What Happened:
🔻 3315–3325 SELL → Perfect rejection → Drop of 200+ pips
🔁 Retest at 3314 → Confirmed OB rejection zone
❌ 3284–3288 BUY → Invalidated, BOS clean
✅ 3260–3270 BUY → Real reaction zone. OB + FVG + full discount → Delivered bounce
👁🗨 Eyes On (Into NY Session & May 1):
3315–3325 = Decision zone
→ Break = bullish reversal
→ Rejection = new short trigger
3260–3270 = Key support. If holds = bounce continuation
3252–3244 = Next strong buy zone if 3260 fails
3350 / 3385 = Targets only if bullish breakout occurs post-news
🧠 Current Bias:
🔸 HTF Trend: Consolidation under ATH → bearish-leaning
🔹 LTF Flow: Bearish structure unless 3315 flips
🎯 Bias: Neutral-bearish → shifting bullish only above 3325
📊 KEY LEVELS TO WATCH:
Zone Type Level(s) Commentary
🔻 Resistance 3385 HTF FVG zone / reversal risk
🔻 Resistance 3350 Clean target above breakout
🔻 Resistance 3325 Final barrier before shift
🔻 Flip Zone 3315–3320 Must flip to validate bulls
🔁 Retest 3308–3312 Last OB rejection
⚖️ Mid Zone 3286–3292 Retest structure, weak
✅ Support 3260–3270 Confirmed bounce zone
🟩 Demand 3252–3244 Next high-conviction buy zone
🟢 Discount 3220–3235 Long-term OB zone
🟢 Discount 3192–3205 Extreme discount + FVG
🗓️ MACRO FOR MAY 1:
🗣️ 15:30 Trump Speech
📉 15:30 Unemployment Claims (forecast: 224K)
🏭 15:45 Final Manufacturing PMI
🏭 17:00 ISM Manufacturing PMI + Prices
⚠️ Expect high volatility. Prepare for breakout setups only after structure confirms — not before.
🎯 Final Note:
If 3315–3325 breaks cleanly → we’re heading to 3350 / 3385.
If it holds → we hunt reentry shorts with sniper precision.
This is not a place to guess. It’s where real traders wait.
—
📌 Like plans built on logic, not luck?
Drop a 🧠 if this structure helped you.
🔥 Follow if you're done with signal-chasing and ready to trade like a sniper.

Will the price of gold rise or fall?From the perspective of the 4-hour cycle, a big negative line closed, covering the previous positive lines, and breaking the support of the 5-day and 10-day moving averages. This wave may continue to fall to the Bollinger middle rail near 3300, but if it is a high-level shock, the Bollinger middle rail is not broken, and it may rise again to the high point of 3430. Therefore, gold has experienced a big rise and fall in this cycle, and it is possible to rise or fall now. In the short cycle, first pay attention to the support effect of 3360-3350 under the weakness of the early trading. If it is not broken, you can continue to be bullish, with the upper target at 3400, and then look at 3430 if the strength is strong.

XAUUSD 1st week May 2025After this week continuing its correction to 3202, at the end of the week gold found its support. This has the opportunity as a reversal area to continue its bullish trend.
If Monday could break 3270, it has a strong posibility to reverse.
Goodluck !

THE KOG REPORT THE KOG REPORT:
In last week’s KOG Report we said we would be looking for the price to continue upside into the region given which gave us a fantastic capture for the start of the week. We then had to adapt as the bias level and targets on the red box indi changed suggesting more upside. We continued to complete all our bias above targets as well as Excalibur and LiTE giving us 100% again for the week!
It wasn’t easy as it sounds, it took a lot of work and constant monitoring but the pip capture on gold was out of this world and well worth it!
So, what can we expect from the week ahead?
For this week we seem to be creating a DB on the 4hr chart which entails caution. We have resistance just above at the 3330-35 with extension 3240-45 region which if attacked and rejected in the early session could give the potential short trade into the support level 3295-8 which is the key level that needs to break for us to go lower.
There is a lot of liquidity above, especially those who like us shorted and held trades from the 3450 levels so the bias this week changes to the 3350-55 level, break above and we will confirm the move higher, otherwise, our thoughts are a test is likely on the high but we would like to get that long from lower to again create a new ATH.
Let’s see how we open, these markets need to be adapted to every day so making long terms plans as intra-day traders isn’t on our agenda at the moment. The market is giving short term, so why not take advantage of the conditions while they last.
Potential for gaps on open so please be careful, we’re on red boxes and extreme levels only.
RED BOXES INDI LEVELS:
Break above 3320 for 3327, 3330, 3335, 3345, 3347 and above that 3362 in extension of the move
Break below 3310, for 3306, 3297, 3295, 3280, 3266 and 3255 in extension of the move
Even the scalping levels are HUGE!
Please do support us by hitting the like button, leaving a comment, and giving us a follow. We’ve been doing this for a long time now providing traders with in-depth free analysis on Gold, so your likes and comments are very much appreciated.
As always, trade safe.
KOG

The latest trend of the gold market and operation suggestionsAt present, on the daily chart, gold closed with a medium-sized bearish candle. In the early trading session, it directly broke below the crucial defensive level of 3,370, thoroughly opening up the adjustment range. Meanwhile, it triggered the MACD indicator to form a death cross. Now that the gold price has reached a new low, the dominant strategy for the early trading session is still to sell on rallies.
On the 4-hour chart, in today's early trading session, the price directly broke down and smoothly pierced through the support area ranging from 3,270 to 3,260, realizing the transformation between the top and the bottom. At the 1-hour level, not only has it broken below the previous low of 3,260, but the moving averages have also formed a death cross, indicating strong bearish momentum. It is advisable to sell decisively when the gold price rebounds to around 3,270, which is the densely traded area at the lower part of the recent box consolidation. If the rebound fails to even reach the vicinity of 3,260, in an extremely bearish market situation, the downward space for the gold price will be further expanded.
Overall, for short-term trading of gold, the operation strategy should mainly focus on selling on rallies, supplemented by taking light long positions on pullbacks. Pay close attention to the resistance range from 3,235 to 3,245 on the upside, and closely monitor the support levels from 3,200 to 3,190 on the downside.
XAUUSD
sell@3225-3230
tp:3210-3200
Investment itself is not risky; it is only when investment is out of control that risks occur. When trading, always remember not to act on impulse. I will share trading signals every day. All the signals have been accurate without any mistakes for a whole month. No matter what gains or losses you've had in the past, with my help, you have the hope of achieving a breakthrough in your investment.

Gold price continues to rise wildly after the holiday!Technical analysis of gold: Gold soared all the way after opening on Monday yesterday. Although it retreated slightly during the period, it continued to maintain its strong pace. So far, it has reached a high of around 3386, with an increase of about 150 US dollars. The daily line is also supported by the middle track, directly breaking through the suppression of the moving average system, and allowing the market to become strong again after two weeks of baptism. The strong and rapid rise in the morning of the day also formed two possibilities. Either the bulls will continue to exert their strength, but this requires support in the later period, especially in the European and American sessions of the day. The highest reached around 3386 in the morning and then retreated, and the lowest reached around 3350. If it continues to fluctuate in this range before the European session, it may still have room for upward movement in the later period. On the contrary, if the European session directly breaks through in the opposite direction, it is very likely to be converted into a decline in the shorts, not a retracement correction of the bulls;

Gold Market Update - XAUUSD May 5th after PMI news🧠💣 “This Chart Might Offend Your Favorite Indicator – We Trade Pure Structure Only.” 💥⚡
⏳ Market Context:
Gold exploded from 3210 to 3328 after PMI release, trapping late sellers and punishing anyone short below 3260. After a sharp rejection at the 3327–3333 premium zone, price dropped fast to 3306 before recovering — confirming both a valid sell reaction and strong demand.
Now price is climbing again, sweeping equal highs and pressing into a weak high zone. But guess what? No valid H1–H4 supply break yet = no strong bearish confirmation. Smart Money is lurking — we’re watching the next trap unfold.
🧠 Structural Key Zones (What Price Is "Eyeing"):
Above:
• 🔥 3360 = weak high reaction level
• 🔥 3380–3395 = unmitigated FVG zone and final high supply pre-sell-off
Below:
• 🧊 3305–3310 = recent liquidity grab zone
• 🧊 3272–3284 = daily FVG + EMA confluence
• 🧊 3220–3235 = HTF unmitigated bullish OB + H4/D1 EMA200 = possible swing reentry
🔥 “Gold’s Not Done — The Liquidity War Isn’t Over Yet”
Smart traders aren’t guessing. They’re stalking zones. Let’s lock in the plan.
🧭 Bias & Flow
Macro: No more high-impact USD news today. Market digesting ISM PMI.
HTF (H4–D1): Bullish continuation unless 3272 breaks
LTF (M15–H1): Bullish pressure — currently front-running premium sell zones
👁🗨 Real-Time Price Context
📍 Price now at 3332
🔸 Approaching Sell Zone #1: 3360–3368
➡ Wait for reaction or internal CHoCH to validate
➡ No aggressive short here unless 3344 starts rejecting hard
📌 Key Level Zones
Type Price Zone Confluence
🔺 Resistance 3360–3368 Weak High + OB + FVG + Liquidity
🔺 Resistance 3380–3395 Final premium trap zone (HTF sell block)
🟩 Support 3272–3284 H1 Demand + FVG + EMA stack
🟩 Support 3220–3235 HTF OB + EMA200 D1 + Deep liquidity
🎯 Sniper Entry Plan
🔻 Sell Zone #1: 3360–3368
• SL: 3376
• TP1: 3344
• TP2: 3310
• TP3: 3285
Price is close — wait for confirmation wick / M15 structure shift
🔻 Sell Zone #2: 3380–3395
• SL: 3405
• TP1: 3360
• TP2: 3325
• TP3: 3275
High-risk sell if bulls overextend; final stop before reversal
🟢 Buy Zone #1:3300–3306 → Previous reaction zone
‣ SL: 3290
‣ TP1: 3320
‣ TP2: 3340
‣ TP3: 3360
Clean demand left unmitigated, supported by fair value gap on M15.
🟢 Buy Zone #2: 3272–3284
• SL: 3262
• TP1: 3305
• TP2: 3333
• TP3: 3360
Still valid if we see clean sweep and reentry from FVG
🟢 Buy Zone #2: 3220–3235
• SL: 3200
• TP1: 3260
• TP2: 3300
• TP3: 3340
Only if market nukes deep — last solid demand floor
🔍 Eyes On Zones
🔹 3344: micro resistance = potential front-run fade
🔸 3360: must-watch — premium trap candidate
⚠ Below 3272 = bearish sweep risk into 3220
💬 Final Word — GoldMindsFX Style
Don’t be fooled by the speed. Gold’s strength is real — but so is its manipulation. Snipers don’t chase, they prepare. Stay cold, stay calculated.
🔥 Drop a ⚔ if you’re stalking 3360 with surgical intent.
🙏 Like this breakdown? Boost and follow us for sniper setups all week.
📌 Important Notice!!!
The above analysis is for educational purposes only and does not constitute financial advice. Always compare with your plan and wait for confirmation before taking action.

xauusd:sell@3315-3320After the opening of the gold market today, it started to rise. After breaking through 3270, the market has been in an upward trend. Currently, it has reached the resistance area of 3310-3320. You can start short selling when it reaches this area.
All the signals I sent have been profitable, and I will continue to send accurate signals.
Today's trading strategy for gold:
xauusd sell@3315-3320
tp:3280-3270

GOLD - WAVE 4 CORRECTION TO $2,800 (UPDATE)Gold starting the week with some bullish momentum. We've seen a 'BOS' to the downside, which is now being followed by a retest of a supply zone. This zone can either be around $3,317 (0.618% Fib) or higher around $3,400 zone (0.365% Fib).
Don't forget we're in a 'Wave 4 Correction' of the Elliott Wave Theory strategy. Wave 4 always has choppy price action to trap in late buyers & early sellers.

GOLD - reached at resistance zone ? What's next??#GOLD.. market perfectly bounced back from our supporting area as we discussed in our last idea.
Now market just reached at his r distance region.
From 3262 to 3269-70
Keep close the area and if market holds that in that case we can expect a drop from here.
Good luck
Trade wisely

Gold: Early Entry, Target 3200Gold is being actively bought up.
Ideally, we’d first see a reaction from sellers, a pullback, and then enter the position.
But I’ll try entering from here with a tight stop. First target: 3200.

Gold Price Analysis May 1The D1 candle has broken out in a bearish direction. It is not surprising that the price broke Dow and decreased according to yesterday's Plan.
Gold confirmed the selling side won, so today's strategy is to watch for SELL. The SELL point pays attention to the 2 break zones of 3270 and 3302. The BUY point with the Scalping element pays attention to 3216 and today's main support is 3195.
The current trading strategy is that gold is approaching the 3237 resistance. If it confirms closing above this zone, it will give a BUY signal to 3251 and consider the price reaction of the US session. If it breaks 3241, it will hold until 3270. On the contrary, if it does not break 3237, it can SELL to 3216 and trade according to the noted port zones.

Gold fluctuates and tests new high again!Gold surged and then fell back, and the pattern needs to be sorted out; the stochastic indicator crosses at a high level, and runs downward, the indicator and the pattern resonate and adjust; the top and bottom conversion below, the support point of the sideways rise is in the range of 3380-3370; if it falls back and keeps going down, then the main trend is to pierce the trend and fall back to the range of 3390-3200; the range span is relatively large! In terms of short-term operation ideas, according to the suppression near 3440, the short-term correction is expected; the support position below is near 3290 and 3205; there are many short-term cards; deal with it according to the range;

XAUUSD Analysis todayHello traders, this is a complete multiple timeframe analysis of this pair. We see could find significant trading opportunities as per analysis upon price action confirmation we may take this trade. Smash the like button if you find value in this analysis and drop a comment if you have any questions or let me know which pair to cover in my next analysis.

Gold Price Analysis May 2D1 frame confirms closing below the disputed zone showing the downtrend continues to extend in the following days
The recovery in the Asian and European sessions can be a stepping stone for a decrease in the US session. Sellers are waiting for high price zones and old breakout zones to sell their goods. The 3271-3273 zone plays an important role in the bearish structure as long as this zone is held by the sellers, the possibility of a price increase is relatively low.
The barrier in the Asian session around 3257 will be where we consider the trading strategy. If the European session breaks this zone, we can buy at the target of 3271-3273. If the US session does not break this zone, SELL breaks it, the downtrend structure is broken and holds the BUY order until 3299. The daily resistance zone will be 3312. When 3371 is not broken, SELL and this is a good Swing signal to 3200. The possibility of a strong sell-off after Nonfarm is also understandable.
Strategy: If it does not break 3257 but falls, wait for the reaction at the border of 3243. When this zone is broken, the trend is broken, then we only SELL. If it increases from 3243, then maintain the above strategy with a better entry.

GOLD - reached at today resistance? What's next??#GOLD - perfect bounce above our area as we discussed in our video analysis.
Now market just reached at his today resistance area that is around 3302-05
Keep close it and if market holda then drop expected
Good luck
Trade wisely