Gold continued to rise at the opening and broke upward!The current 4-hour chart of gold has formed an upward breakout trend, and it will continue to strengthen next! In the intraday, we focus on the 3200-line long-short watershed. Before gold falls further, gold will maintain a bullish trend. If gold wants to move out of a steady upward trend, it will not fall below the 3222 line during the day. In the short term, we refer to the points above 3222 to arrange long positions! In terms of operation, it is recommended to adjust the thinking, go long on the decline to 3240-3245 or directly chase the rise after breaking through 3270. At present, it is already long at 3243, and there is no more decline to continue long! Identify the long position during the day! On the whole, today's short-term operation of gold is recommended to focus on callbacks and short on rebounds. The short-term focus on the upper side is 3300-3310 resistance, and the short-term focus on the lower side is 3222-3245 support.
GOLD.PRO.OTMS trade ideas

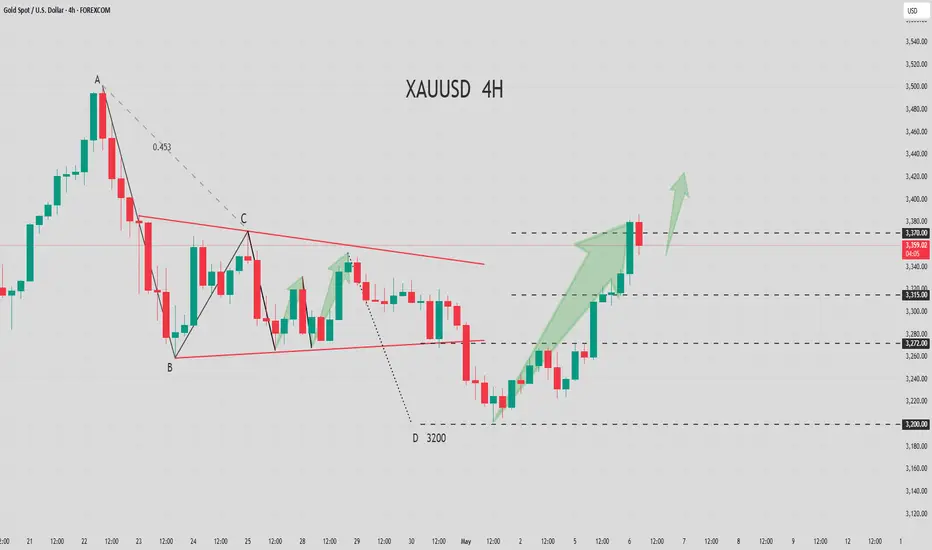
Gold is about to experience a pullback!XAU/USD is rising towards the resistance level which is a pullback resistance that lines up with the 23.6% and the 50% Fibonacci retracement and could reverse from this level to our take profit.
Entry: 3,275.29
Why we like it:
There is a pullback resistance level that line sup with the 23.6% and the 50% Fibonacci retracement.
Stop loss: 3,350.60
Why we like it:
There is a pullback resistance level that lines up with the 50% Fibonacci retracement.
Take profit: 3,168.44
Why we like it:
There is a pullback support level that aligns with the 61.8% Fibonacci retracement.

Gold new Update 🧠 Chart Analysis Summary:
Current Price: Around 3,240.610.
Resistance Zone: 3,256 – 3,264 (highlighted in orange).
Support Zone: Around 3,220 (highlighted with a green target).
Chart Pattern: Looks like a possible liquidity grab above before a potential sell-off (indicated by the hand-drawn zig-zag upward move and large downward arrow).
🎯 Trade Setup Suggestion (Short Position):
Entry: Around 3,256 – 3,264 (wait for price to enter this supply/resistance zone).
Stop Loss (SL): Just above 3,270, ideally at 3,273 (above the marked resistance).
Take Profit (TP): Around 3,220, as marked on the chart (support area).
⛳ Summary:
Risk: ~10–15 points.
Reward: ~35–40 points.
Risk-to-Reward: Roughly 1:3, which is favorable.

XAUUSD UPDATE : NFP hi everyone
I hope you were able to ride the market based on the previous trade idea.
Gold has broken below the daily support level, and the current upward movement is likely just a retracement. Therefore, both my Plan A and Plan B focus on short positions. For a stronger bullish move, the price needs to form a lower low—at least on the H1 timeframe.
good luck all
**My trading strategy is not intended to be a signal. It's a process of learning about market structure and sharpening my trading my skills also for my trade journal**
Thanks a lot for your support

Try going long gold in small batchesFundamentals:
Focus on US economic data and Fed dynamics;
Technical aspects:
Gold continues to fall and is currently testing the 3200 mark. It is undeniable that gold is currently in a clear bearish trend, and the foreseeable area below is the 3185-3175 area, which is a strong support in the short term. However, the long and short sides are currently wrestling at the 3200 mark, and I think there will still be repetitions in the short term. So gold should rebound before falling to the 3185-3175 area.
Trading strategy:
Consider trying to go long on gold in small batches in the 3210-3200 area, TP: 3220-3230.
Please note: In order to protect the security of the account, as gold rebounds, you can consider gradually moving up the SL to ensure profits.

GOLD DAILY CHART ROUTE MAP UPDATEHey Everyone,
Here’s the latest update on our daily chart idea, it’s been playing out perfectly!
After we got the close above 3297, the gap up to 3433 completed exactly as we had analysed. However, without a further close or lock above 3433, the rejection was confirmed with a wick, and price then found support above the channel top, just as we always highlight.
With EMA5 still holding above the channel top, we’re likely to continue seeing support and price action playing above the channel. This opens the door for another retest of 3433. However, if price breaks back inside the channel along with EMA5, the levels inside the channel will reactivate for level-to-level plays.
This is the beauty of our Goldturn channels, drawn using weighted averages instead of pure price action. This unique approach helps us clearly identify fake-outs and real breakouts, cutting out much of the noise that usually confuses traders.
Moving forward, we’ll focus on smaller timeframes (1H and 4H) to buy dips off the weighted Goldturns, aiming for clean 30–40 pip moves. Ranging markets are perfect for this style, allowing us to capitalize on quick moves without getting caught in the chop of larger swings.
Thank you all again for your continued likes, comments, and follows, we truly appreciate your support!
Mr Gold
GoldViewFX

XAUUSD- Signal to go down - 24/04/2025- With any macro economy problem, Gold & BTC are always the key asset to to shelter cash flow.
- From Gold H1 chart, It showed strong selling pressure recently. A short plan is reasonable with Gold. Of course, any plan can be wrong, but as a trader & value investor, we have to have the plans to deal with it and prepare to buy more good stocks, assets
- Explain the chart as - NCI system:
1. Strong momentum comes to down key level of H1
2. Big money comes in, Key level has not broken yet. But high probability Gold will go down.
3. Zone & Trend are shown on chart. Please refer on it for more detail
This analyzation is my personal view as a trader - investor, it's not a recommended deal.

Gold is trading at bearish market cycleGold is trading at bearish side of market cycle. Trying to attain its average value by mean reversion. Fundamentally heat of tariff war appears to be settling.

GOLD 1H CHART ROUTE MAP & TRADING PLAN FOR THE WEEKHey Everyone,
Please see our updated 1h chart levels and targets for the coming week.
We are seeing price play between two weighted levels with a gap above at 3344 and a gap below at 3306. We will need to see ema5 cross and lock on either weighted level to determine the next range. EMA5 is lagging below 3306 so will need a close above and then below to confirm.
We will see levels tested side by side until one of the weighted levels break and lock to confirm direction for the next range.
We will keep the above in mind when taking buys from dips. Our updated levels and weighted levels will allow us to track the movement down and then catch bounces up.
We will continue to buy dips using our support levels taking 30 to 40 pips. As stated before each of our level structures give 20 to 40 pip bounces, which is enough for a nice entry and exit. If you back test the levels we shared every week for the past 24 months, you can see how effectively they were used to trade with or against short/mid term swings and trends.
The swing range give bigger bounces then our weighted levels that's the difference between weighted levels and swing ranges.
BULLISH TARGET
3344
EMA5 CROSS AND LOCK ABOVE 3344 WILL OPEN THE FOLLOWING BULLISH TARGETS
3367
POTENTIALLY 3390
EMA5 CROSS AND LOCK ABOVE 3390 WILL OPEN THE FOLLOWING BULLISH TARGET
3428
EMA5 CROSS AND LOCK ABOVE 3428 WILL OPEN THE FOLLOWING BULLISH TARGET
3458
EMA5 CROSS AND LOCK ABOVE 3458 WILL OPEN THE FOLLOWING BULLISH TARGETS
3478
POTENTIALLY
3503
BEARISH TARGETS
3306
EMA5 CROSS AND LOCK BELOW 3306 WILL OPEN THE RETRACEMENT RANGE
3285
3259
EMA5 CROSS AND LOCK BELOW 3259 WILL OPEN THE SWING RNGE
3233
3201
EMA5 CROSS AND LOCK BELOW 3201 WILL OPEN THE SECONDARY SWING RANGE
SECONDARY SWING RANGE
3159 - 3112
As always, we will keep you all updated with regular updates throughout the week and how we manage the active ideas and setups. Thank you all for your likes, comments and follows, we really appreciate it!
Mr Gold
GoldViewFX

GOLD The Target Is DOWN! SELL!
My dear friends,
My technical analysis for GOLD is below:
The market is trading on 3377.8 pivot level.
Bias - Bearish
Technical Indicators: Both Super Trend & Pivot HL indicate a highly probable Bearish continuation.
Target - 3357.7
Recommended Stop Loss - 3387.7
About Used Indicators:
A pivot point is a technical analysis indicator, or calculations, used to determine the overall trend of the market over different time frames.
Disclosure: I am part of Trade Nation's Influencer program and receive a monthly fee for using their TradingView charts in my analysis.
———————————
WISH YOU ALL LUCK

XAUUSD:The bullish forces make a strong comeback.Yesterday, the gold market soared with an impressive rally. It started rising during the Asian trading session, continued the upward trend in the European session, and witnessed a further surge in the American session. Eventually, it closed at a high level, fully demonstrating the strong comeback of the bullish forces, which is by no means a short-term rebound. In the early trading session of today, we precisely seized the opportunity and placed two long positions near $3,325. Currently, we have successfully locked in the profits after the price reached a peak.
In the following period, we will focus on the price correction and pullback. Once the price stabilizes after the pullback, we will maintain a bullish outlook. If the price moves steadily during the European trading session, we can temporarily adopt a wait-and-see attitude. If the upward trend continues, the pullback before the American trading session will be an excellent opportunity to follow up. Overall, based on the judgment that the Asian, European, and American trading sessions will maintain a continuous upward trend in tandem, we will keep seizing opportunities to go long.
In the future, we will continue to monitor the market changes and update the trading strategies in real time.
I am committed to sharing trading signals every day. Among them, real-time signals will be flexibly pushed according to market dynamics. All the signals sent out last week accurately matched the market trends, helping numerous traders achieve substantial profits. Regardless of your previous investment performance, I believe that with the support of my professional strategies and timely signals, I will surely be able to assist you in breaking through investment bottlenecks and achieving new breakthroughs in the trading field.
Start shorting gold and seize the opportunity to make a profit!!Fundamentals:
Focus on Trump and the Fed
Technical aspects:
Gold fell back to around 3253 and then rebounded, and continued to rise to around 3318. The upward momentum in the short term looks particularly strong. According to the current structure, as gold gradually rebounds, off-market buying funds gradually enter the market, pushing gold further up. However, when facing the previous turning point position area of 3325-3335, the market is cautious and it is difficult to break through this area in a short period of time. Therefore, when gold gradually approaches the 3325-3335 area, gold may usher in a wave of retracement in the short term; obviously, the retracement area we can foresee is the 3295-3285 area first.
Trading strategy:
Consider shorting gold in the 3315-3325 area, TP: 3295-3285

Gold latest strategy signals- Point of Interest
- Symmetrical Triangle as corrective pattern in Short Time Frame
- Order Block
- Completed " 12345 " Impulsive Waves and " AB " Corrective Waves
- Fibonacci Level - 38.20% / 50.00%

Gold Hits Key Resistance – Will It Break Out or Pull Back? Gold has been moving in a downtrend, and there's a clear descending trendline marked in red. The price has just reached that trendline right around the 3316 level, which also aligns with a horizontal resistance at 3329 — making this a very strong resistance zone.
The price surged from the support area near 3224, breaking through minor resistances until it reached the current level. But what we need to keep an eye on is that momentum indicators like MACD and Stochastic below the chart are starting to show overbought signals, which could mean the price might pull back or at least slow down.
🎯 Expected scenario now:
If the price fails to break above 3329 and can't push through the trendline, we might see a corrective drop toward 3269, and possibly down to 3224 again.
However, if the price breaks above this zone with strong volume and holds above it, we could see a continued bullish move toward 3352 — which looks like an ideal selling zone.

4-hour chart for XAUUSD (Gold Spot vs US Dollar)This is a 4-hour chart for XAUUSD (Gold Spot vs US Dollar) showing a technical analysis setup:
1. Current Price:
Sell: 3,238.70
Buy: 3,239.00
2. Marked Levels:
There's a red shaded area labeled "ENTRY ZONE" between 3,272.81 and 3,273.79.
This zone likely acts as a resistance or pullback area where a sell entry is being considered.
3. Market Structure:
Price previously moved up strongly (bullish), but now it’s forming lower highs and lower lows, indicating a bearish trend.
A projected path is drawn showing that price might go back up into the entry zone and then drop further — with a potential target near 3,009.75.
4. Bias:
The overall bias shown in the chart is bearish.
It suggests a sell opportunity in the entry zone, expecting price to fall after a short-term pullback.
If you want, I can help you build a full trade plan (entry, stop loss, and take profit) based on this chart too. Just let me know!

GOLD DAILY UPDATE MAY 1ST 2025Chart Is very clear in numbers ,
Expected to continue correcting to the level of 3160 3170, from there must jump to a very high levels, but except real breaking 3160 with confirmation candles on 4 hours timeframe, will take us to more correction down to 3040 max. not really expected but nothing impossible in market.
good luck for all traders.

Analysis of the latest gold trend on May 7:
The spot gold price continued to rise on Tuesday, breaking through the psychological barrier of $3,400/ounce. The resonance between technical and fundamental factors shows that bulls have re-dominated the price operation rhythm. At present, global geopolitical risks continue to ferment, and the market's risk aversion sentiment has accelerated the inflow of funds into safe assets such as gold. At the same time, the Federal Reserve's interest rate meeting this week has become the core game point in the market. The policy statement and Powell's press conference will directly affect the market's expectations of the interest rate path. The US core PCE price index for March released last week fell to 2.6% year-on-year (in line with expectations), while the April non-farm employment data remained resilient, showing that the supply and demand relationship in the labor market remained in a tight balance. The above data combination alleviated the market's excessive concerns about the risk of "re-inflation" and provided breathing space for gold bulls.
From the perspective of intraday price behavior, gold shows the typical characteristics of rapid rise after a small cycle correction. The daily K-line combination continues the long arrangement, the moving average system shows a divergent rise, the technical form is in line with the characteristics of "stepped short squeeze", and the probability of continued upward trend is high in the future market. Based on the combination of fundamental and technical factors, the current gold market is still in a strong bull-dominated pattern. The operational strategy is recommended to focus on the callback low and long, and at the same time be wary of short-term fluctuation risks caused by the Fed's policy tone being more hawkish than expected. The 4H chart K-line combination pattern is long, and the probability of a change on Wednesday is small, and the continuation is expected to fluctuate upward; short-term support is 3374, and strong support is 3370-3366; in terms of specific points, the upper side needs to focus on the 3430-3470 US dollar/ounce area (Fibonacci extension level and previous dense trading area resonance resistance), and the lower side needs to pay close attention to the 3260-3250 US dollar/ounce support band (double support of the bullish trend line and the integer psychological barrier)
Operation strategy:
1. Go long on gold near 3375, stop loss at 3365, and target 3400-3430;

Analysis of gold market trendIn terms of short-term gold operation ideas, it is recommended to short on rebounds and long on pullbacks. The short-term focus on the upper side is the 3328-3330 resistance line, and the short-term focus on the lower side is the 3260-3252 support line.

XAUUSD NEXT MOVE Over-Reliance on Double Top Projection
• The chart assumes a price move straight up to form a “double top” around 3,540–3,550 without acknowledging possible market hesitation or intervening resistance zones.
• A double top pattern requires a confirmation of rejection at the same level; assuming it prematurely can be misleading.
2. Support Zone Might Not Be Strong Enough
• The “Strong Support and Bullish Area” is drawn around 3,200–3,230, but the bounce shown in the chart is still not well-established. A break below this would invalidate the bullish thesis.
• There is no confirmation of higher lows, which is critical for a trend reversal.
3. Overlooked Bearish Pressure
• The previous high (around 3,540) led to a sharp selloff, indicating strong supply. This area could be a distribution zone rather than just resistance.
• Market sentiment might still be bearish unless a higher high is confirmed.
4. Resistance Area Is Vague
• The “Resistance” zone between 3,340–3,360 is too narrow and lacks confluence with indicators like moving averages or volume spikes.
• A pullback from this zone is plausible, and it should be treated as a decision area, not just a step before price rallies.
5. Economic Events Are Ignored
• There is an icon showing a U.S. economic event, but the chart doesn’t factor in fundamental catalysts, which could disrupt technical patterns significantly.

Triangle PatternThe price has formed a triangle pattern as a consolidation pattern, and now the price broken out of the pattern followed by a pullback, it is very likely to continue lower as we follow the trade with the 4 hour MA
time to go short
WE ONLY TRADE PULLBACKS

What's next for XAUUSD?Will gold keep pushing Lower? It Seems to be respecting the higher timeframe(1w) CRT bias.... Only one way to find out...

WILL GOLD PUMP IN FOMC ATH ALERT!
📉 Market Update – Consolidation Mode ON 📈
Hey Traders! 👋
After that sharp morning red candle dropping 💥 600+ pips, the market has been moving sideways, stuck in a tight range. 😴
But don’t get it twisted—the bullish bias is still strong 💪🐂
🔑 Key Level to Watch: 3400
👉 If the price breaks and closes above 3400 on the M30 candle, we’re likely to see momentum kick in and the market may head to new ATHs (All-Time Highs)! 🚀📈
🎯 Bullish Target Zones:
✅ 3500 – First push
✅ 3700 – Major move, potential for a huge bull run! 🐂🔥
🛑 Always Follow Risk Management!
Protect your capital, use SL wisely, and never over-leverage. ⚠️💼
📊 Stay sharp, stay disciplined. Let’s ride the trend! 💸

Gold (XAU/USD) Analysis – 1H🏛 1. Current Market Structure
📉 Gold is currently consolidating and compressing between a Supply Zone below and a 4H FVG above.
🔎 This setup reflects market indecision, typical ahead of a major event like the FOMC.
🌍 2. Bigger Picture Outlook
⚠️ Powell's speech is scheduled in 2 hours, with very low probability of a rate cut.
💰 This would generally benefit gold, but keep in mind that some of this expectation might have already been priced in yesterday.
🔍 3. Key Technical Observations
🟩 4H FVG: Liquidity zone just above the current price, potential target if the price breaks upward.
🟫 Supply Zone: Key structural support, tested multiple times in the past hours.
📐 Classic compression pattern, often leading to a major breakout, but no clear direction confirmed yet.
🎯 4. Short-Term Expectations
📉 Bearish Scenario:
Rejection from the 4H FVG
Drop back to the Supply Zone
Potential liquidity sweep below $3,350
📈 Bullish Scenario:
Clear break above the 4H FVG
Potential rally towards $3,500 if the FED surprises or stop-losses get hunted.
🔥 5. Upcoming Catalysts
🕰 FOMC in 2 hours: Main short-term risk factor.
💸 Powell + Rates: If rates remain unchanged with a cautious tone, gold could break out to the upside.
🔎 Immediate volume and reaction will be critical to confirm a true breakout.
✅ Conclusion
👉 Caution is advised ahead of the FOMC. The market seems ready for a sharp move in either direction, but the outcome will heavily depend on Powell's tone.
📍 Key levels to watch:
4H FVG (~$3,420)
Supply Zone (~$3,370)
Psychological $3,500 level if a bullish surprise unfolds.
