GOLD - Near to CUT n REVERSE Area? what's next??#GOLD. market perfectly bounced from our area and now market just above his current suportinga area that is around 3382-87
keep close if market holds then further bounce on table.
NOTE: we will go for cut n reverse below our region.
good luck
trade wisely
GOLD.PRO.OTMS trade ideas

Gold 3386 is under pressure, don't worry
Gold rose rapidly today. At present, the price of gold has reached the 3386 line. There will be pressure to fill the gap and choose to bear the pressure.
Now that gold is adjusting and falling at 3386, don't rush to gamble and enter the market. Wait for time + point + harmonious position. The market will find support in an effective time. Now the effective support point of gold is about 3346/36. The price fluctuates violently. It is recommended to take a stop loss in time after entering the market to avoid a sudden accident in the market and cause unnecessary losses. Today's rising cycle can be seen in the 3400/3420 range. On the downside today, if the market changes and recovers the opening price, just wait and see. This kind of market is unlikely to occur, but if it occurs, you have to wait and see and don't be stubborn in your thoughts.
Market contradictions and potential risks:
Fed policy expectations: The market's probability of a rate cut in June has dropped to 37%. If the Fed releases hawkish signals this week, it may suppress gold prices.
ETF holdings diverge: Despite the rise in gold prices, the world's largest gold ETF (SPDR) holdings decreased by 4.87 tons, reflecting that some institutions sold off their holdings at high prices.
Geopolitical variables:
Middle East conflict escalates: If the friction between Iran and Israel intensifies, gold may hit $3,450; on the contrary, if the situation eases, the gold price may fall back to $3,300

Bank Holiday Set up🚨 High Risk Alert!
Seeing unusual volume today — already 50 pips in play from this zone. 👀
Targeting that bullish order block for a potential full reversal into higher highs & premium sell zone. 🌀
Waiting on extra confluences before pulling the trigger on a buy setup.
Let’s see what the New York open brings! 🗽📈
#Forex #TradingUpdate #MarketWatch #NYOpen #PriceAction

XAUUSD:Sharing of the Trading Strategy for Next Week This week’s trading wrapped up successfully. Our exclusive VIP trading signals achieved a 90% accuracy rate!
On Friday during the U.S. trading session of the gold market, the Non-Farm Payrolls data was bearish for gold. We directly initiated a short position on gold at 3,260. Although gold rebounded subsequently, it was still prompted that as long as gold did not break through 3,280, a short position should be taken. Below this level remains the optimal price point for placing a short order. Next week, we will still mainly wait for a rebound to initiate short positions.
The signals in the Signature have brought about continuous profits, and accurate signals are shared every day. Hurry up and click to get them!
👇 👇 👇 Obtain signals👉👉👉

Gold trend layout in the evening after the release of NFP data🗞News side:
1. Pay attention to the recent trade situation and news about the Fed's interest rate cuts
2. Be wary of DXY trends
3. The situation of the Russian-Ukrainian war and the follow-up events of the India-Pakistan conflict
📈Technical aspects:
The short orders in hand have already been profitable, and gold is now back near 3250, while the US dollar index has once again fallen by 100, reaching around 99.6, and the 1H moving average is currently showing signs of turning upward. The upper and lower shadow lines of the 1H K-line closing look like cross stars of equal length, which means that things may go wrong, and gold may rebound upwards in the short term. We can still focus on the resistance of 3260-3270 above, and further focus on the first-line resistance of 3280-3286, while the bottom has never been able to effectively break through the first-line support of 3240. If this week closes at 3240, then the market outlook next week will be conducive to long trading.
Intraday operation suggestions
🎁SELL 3260-3270
🎁TP 3245-3240
🎁BUY 3230-3240
🎁TP 3260-3270
If you agree with this point of view, or you have a better idea, please leave a message in the comment area. I look forward to hearing different voices.
OANDA:XAUUSD FX:XAUUSD FXOPEN:XAUUSD FOREXCOM:XAUUSD TVC:GOLD
Analysis of gold market trend in the future.Gold continued to rebound at the opening, and the daily line has gone down for three consecutive days. The probability of correction is relatively high, and the decline is bound to be not that large. The position of choosing short positions cannot be too low, and the support below is 3230-3227! According to the ADP data, it is likely to be bullish for gold. Under the influence of the tariff war, the employment data may not be too good, and the economic situation will only get worse. There is no doubt about this. Comprehensive analysis, I think the probability of big non-agricultural and unemployment rate bullish is relatively high. Therefore, shorting is limited to intraday, and the focus is on the bottoming out and rebound cycle.

The bulls return strongly and continue to buy after the retracemCurrently, gold is fluctuating around 3360. Wait patiently for the opportunity to go long when it falls back. Below, we continue to pay attention to the short-term support at 3350-54, and focus on the important support at 3336-40. In terms of operation, we mainly go long on pullbacks. Be a prudent trader and take profits within your cognition. I have been waiting for your participation. If your current gold operation is not ideal, I hope I can help you avoid detours in your investment. Welcome to communicate with me!
From the 4-hour analysis, gold bulls are making another strong impact. On the top, we pay attention to the short-term suppression of 3385-90 and the suppression of 3400. On the bottom, we pay attention to the short-term support of 3350 and the important support of 3336-40. In terms of operation, we mainly buy when the price falls back. In the middle position, we should watch more and do less, and follow orders cautiously, and wait patiently for key points to enter the market.
Gold operation strategy:
Gold falls back to 3350-53 and buys more when it falls back to 3336-40. Stop loss 3327, target 3380-3385, and continue to hold if it breaks;

Sub 3k ond Gold soon?Gold continues to get rejected off inverted FvGs, all while grinding inside the turning area—and from where I’m standing, the top looks locked in.
We’re now heading straight down the pink ABC structure, with targets lining up at $3,000 and lower. The first major resistance on this descent is marked in white—a critical level to watch.
If we see a strong bullish bounce there, perfect—that’s our chance to scale into a bigger short position with precision.
The tide’s turning. Don’t fight the flow.

Gold's safe-haven stimulus led to a strong rise!In terms of short-term gold operation ideas, it is recommended to short on rebounds and long on pullbacks. The short-term focus on the upper side is the 3328-3330 resistance line, and the short-term focus on the lower side is the 3260-3252 support line.

Gold price fell after a high? Trend reversal?Analysis of Asian morning session:
The recent high point of gold price reached 3437 US dollars, and it fell sharply after the Asian morning session opened. The gold market opened after the Asian holiday, and the bulls rose strongly; the Asian morning session was volatile, and the current lowest reached around 3360, a drop of 77 US dollars.
Then it adjusted back and reached a high of around 3404; this position can be used as an important resistance level at the opening time of the Asian session. Between the sharp rise in the morning of the past two days, and the upward continuity of the European and American sessions, coupled with the recent continuous rise and fall, the rapid fall in the Asian morning session.
Quaid believes that in this continuous upward pattern, once there is a sharp fall, it is also likely to be a signal of insufficient bullish power in the short term; then we need to consider whether the bears can reverse, and the current upper pressure position is at 3395 US dollars, and the lower support level is at 3360 US dollars, which is equivalent to the previous top and bottom conversion.
Operation strategy:
Short when the price returns to 3390, take profit at 3370-3360, stop loss at 3400.
Good luck to everyone.

XAUUSD 15 MINUTESThis chart shows a breakout from a descending channel pattern on the Gold Spot price (XAU/USD) on the 15-minute timeframe. Here's what the chart indicates:
Descending channel: Price was moving within a downward-sloping channel.
Breakout: The price broke above the upper trendline of the channel, signaling a potential reversal or continuation to the upside.
Long position: A long trade was taken right after the breakout, as shown by the green box (profit target area) and red box (stop-loss area).
Target hit: The arrow and label "target successful" indicate that the price reached the trader’s profit target near 3,420.853.
This is a classic breakout trade setup, confirming a bullish move after a short-term downtrend.
Would you like help analyzing the next potential move or finding similar patterns?

Gold is in line with the uptrend
After yesterday's sharp rise from 3238, spot gold continued to climb in the Asian market on Tuesday. The price of gold has now broken through the highest level of 3386 US dollars per ounce, and the daily increase is nearly 28 US dollars. At present, the price of gold remains close to the new record, and the rise is far from over. The global trade war has caused market concerns and continued to push the price of gold to new highs. Gold has become an asset for a new round of investment boom!
The market boom is coming, and the gold bulls are coming?
Banking giant Goldman Sachs released a bullish forecast report on gold, saying that if a recession becomes a reality, the gold price target will reach 3880 US dollars per ounce by the end of 2025. The forecast is based on the expectation that concerns about a recession will accelerate the inflow of funds into gold exchange-traded funds (ETFs), thereby pushing up gold prices.
In addition, Goldman Sachs warned that if the Federal Reserve loses its independence, the price of gold may soar to 4500 US dollars per ounce.
What do you think of today's gold trend!
Looking back at the current gold and silver, from the market point of view, the gold price trend has been stabilizing above the middle track, and the cycle bulls continue to line up. From the indicator point of view, the middle track has been hooking upward, and there is still room for an upward rebound in the short term. In addition, gold started from 3322 last week, and directly rose from 3322 to 3387. Now it is around 3367. So there is a point to pay attention to today, that is, the position of the middle track of 3334. It is still difficult to say whether it can be stepped back.
Don't expect a deep callback. The only difference between the oscillating market and the unilateral market is that the oscillation will come back, while the unilateral market will not. This is why we always emphasize the need to bring a good stop loss. In terms of the cycle rhythm, we have been participating in the cycle of time and space last week. At present, we can still participate in this pattern. There is one opportunity in the European and US markets. We will start at this time point during the day!
Gold: More near 3350, defend 40, and target the resistance of 3385-90! If it breaks below, wait for the two support levels of 3334-20 before considering!

XAUUSD 15 MINUTESThis chart illustrates a short-term bearish trading setup for Gold (XAU/USD) on a 15-minute timeframe. The trader has identified:
A "SELL ZONE" around 3,380–3,390, indicating a potential reversal area.
LEVEL 1 (~3,370) and LEVEL 2 (~3,355) as possible support areas or price reaction zones.
A final target labeled "TAEGET SUCCESSFUL" (likely meant to be “TARGET SUCCESSFUL”) around 3,325.
The projected price action (marked by the purple line) suggests a short position from the sell zone aiming to hit all three levels, with the ultimate target being around 3,325.
Would you like help setting up a trading plan based on this setup or backtesting this strategy?

GOLD: Short Signal Explained
GOLD
- Classic bearish pattern
- Our team expects retracement
SUGGESTED TRADE:
Swing Trade
Sell GOLD
Entry - 3311.9
Stop - 3324.4
Take - 3287.1
Our Risk - 1%
Start protection of your profits from lower levels
Disclosure: I am part of Trade Nation's Influencer program and receive a monthly fee for using their TradingView charts in my analysis.
❤️ Please, support our work with like & comment! ❤️

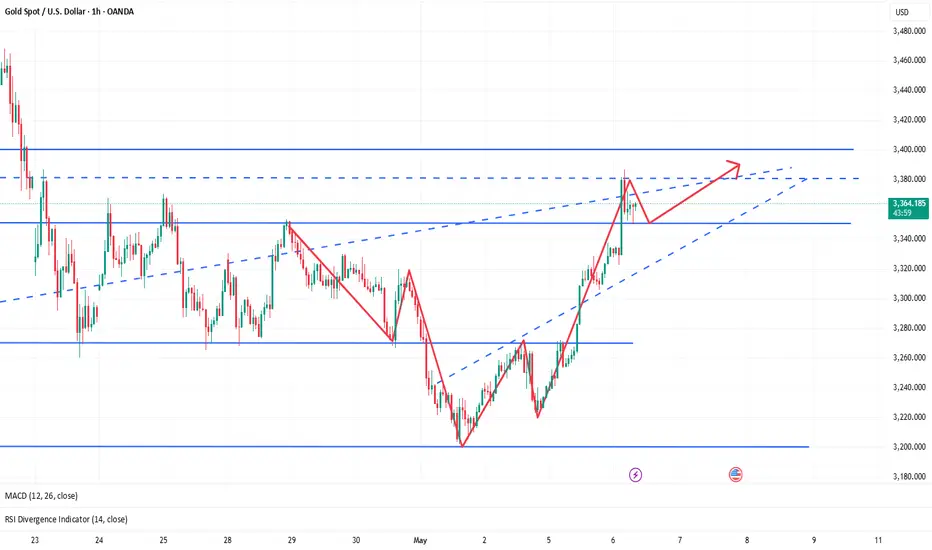
Gold is ready to push againNo comment needed. All information is in the chart analysis.
Steps to follow:
Analyze yourself.
Take the position with SL and Take Profits.
Wait, it may take a couple of days, so take a break and step away from the screen from time to time, just like I do :)
Get the result.
I will update the trade every day.
Like, comment with your good mood or viewpoint, share with your circle. It’s together that we get stronger!
Good trades, Traders!
The golden bear

Buy on dips.After a good selloff, now gold taking support on a key swing support, now i am taking long here to making ATH target on swing.

GOLD UPWARD SOONThis chart showcases a liquidity grab followed by a potential bullish reaction in Gold (XAU/USD).
Key Technical Highlights:
- Resistance Zone: Clearly defined around the 3,370 level, where price has consistently faced rejection.
- Support Level: Identified near the 3,220–3,230 zone, which was recently swept to collect liquidity.
- Liquidity Zone: Price dipped below support to trigger stop-losses before rebounding, signaling a possible bullish reversal.
Projected Move:
The chart suggests a bounce toward the next target at 3251.225, aligning with a previously broken support now turned resistance.
If momentum sustains, further upside could be explored toward the mid-supply zone.
Summary: The recent liquidity sweep hints at a potential short-term bullish move, with a target retracement to 3251.225. Traders should monitor price reaction at that level for confirmation or rejection.

GOLD-SELL strategy 3 Hourly chart GANN SQGOLD may have a possible S/H/S pattern, and neckline break was @ $ 3,290 area. This translates to a possible objective $ 3,030. The GANN SQ also shows potential for further weakness in the near-term.
Strategy SELL @ $ 3,250-3,275 and take profit near $ 3,137 on first move down.

GOLD BULLISH BIAS RIGHT NOW| LONG
GOLD SIGNAL
Trade Direction: long
Entry Level: 3,217.01
Target Level: 3,287.27
Stop Loss: 3,170.16
RISK PROFILE
Risk level: medium
Suggested risk: 1%
Timeframe: 3h
Disclosure: I am part of Trade Nation's Influencer program and receive a monthly fee for using their TradingView charts in my analysis.
✅LIKE AND COMMENT MY IDEAS✅

XAUUSD – 30m Buy Setup | Fair Value Gap + Fib + Liquidity Sweep📈 GOLD LONG – May 6, 2025 | Smart Money Trade Setup
We're seeing an incredibly clean bullish setup form on Gold (XAUUSD) with textbook Smart Money Confluences:
🔍 KEY CONFLUENCES:
🟥 FVG (Fair Value Gap): Price tapped the FVG perfectly and respected it
📐 Fib Zone: Confluence of 70.5–79% retracement with demand reaction
💧 Liquidity Grab: Below short-term equal lows before bullish push
📉 Divergence: Internal lower highs vs external equal lows = engineered setup
🧱 Structure: Short-term bullish BOS (Break of Structure) above recent swing
📊 Trade Plan (Long Setup):
🎯 Entry: ~$3,325.6 (FVG zone base)
⛑️ SL: Below FVG at ~$3,323
🚀 TP: $3,404 zone (clean inefficiency magnet)
💥 RRR: 1:5+ sniper trade
🧠 Execution Notes:
Wait for LTF bullish structure shift confirmation (5m BOS)
Add confluence with volume divergence or SMT (Smart Money Toolkits)
Manage the trade once it reaches 3,350 zone
Break-even and partials at mid-Fib zone (around 3,352–3,360)
💬 Chart Ninja Wisdom:
"Price doesn’t lie—liquidity does. When price leaves a gap, Smart Money’s coming back for it."
📌 SETUP OVERVIEW:
Timeframe: 30m
Entry Type: Limit (FVG tap zone)
Bias: Bullish
Target: Clean inefficiency above
Type: High-probability setup with strong RR and structure support
💥 Tap 💾 to save this sniper setup.
📣 Tag your gold-trading crew & get ready for that pump!
📆 Watch how this plays out live—discipline > hype.

Gold returns to the bull market as expected, follow-up layout🗞News side:
1. The “demand shock” of the Trump administration’s tariffs on the global economy
2. The United States rejected Japan’s request for a comprehensive exemption from 10% reciprocal tariffs and country-specific tariffs in recent negotiations.
3. The conflict between Israel and the Houthis
📈Technical aspects:
From a technical point of view, the 4H gold bulls are once again making an impact. At the top, we focus on the short-term suppression of the 3380-3390 line, focusing on the suppression of the 3400 line. Below, we focus on the short-term support of the 3350 line, and the important first-line support of 3335-3340. In terms of operation, we mainly go long by stepping back on 3350-3360, and the target is temporarily looking at 3380-3390. In the middle position, we should watch more and move less, pursue orders cautiously, and wait patiently for key points to enter the market.
If you agree with this point of view, or you have a better idea, please leave a message in the comment area. I look forward to hearing different voices.
OANDA:XAUUSD FX:XAUUSD FXOPEN:XAUUSD FOREXCOM:XAUUSD TVC:GOLD
Gold (XAU/USD) Analysis – 1D
🏛 1. Current Market Structure
🚀 Gold reached a peak at $3,500 following Trump’s tariff announcement, triggering a sharp bullish reaction.
🔻 This move was followed by a strong correction, leading price back down to key structural support zones.
🌍 2. Bigger Picture Outlook
📉 This violent retracement allowed the market to revisit accumulation areas, including tested supply zones and bullish OTE levels.
🔎 Price seems to be stabilizing now, suggesting a potential directional move could emerge once structure confirms.
🔍 3. Key Technical Observations
⬜️ Supply Zone: A structural area of interest now acting as potential support.
🟦 Bullish OTE: Located lower, it serves as a final line of defense in case of further downside.
📐 Descending trendline is currently being tested — a breakout would confirm bullish momentum shift.
🎯 4. Short-Term Expectations
📉 Controlled pullback scenario:
Price may revisit the supply zone, or even dip into the OTE, to consolidate before a bullish breakout.
📈 Confirmed bullish scenario:
A clean break above the trendline and recent highs would validate a strong reversal and aim again for $3,500+.
🔥 5. Upcoming Catalysts
📰 Geopolitical or economic updates linked to the US (tariffs, inflation).
📊 Institutional reaction to tested support zones.
💡 Volume confirmation on structural breakout.
✅ Conclusion
👉 After a sharp rejection from a geopolitical news-driven spike, gold is now retesting major support zones.
📍 Three key levels to watch:
The Supply Zone
The 50% retracement
The Bullish OTE
🔎 Price action around these areas will determine whether this is just a pullback — or the start of a new bullish leg.

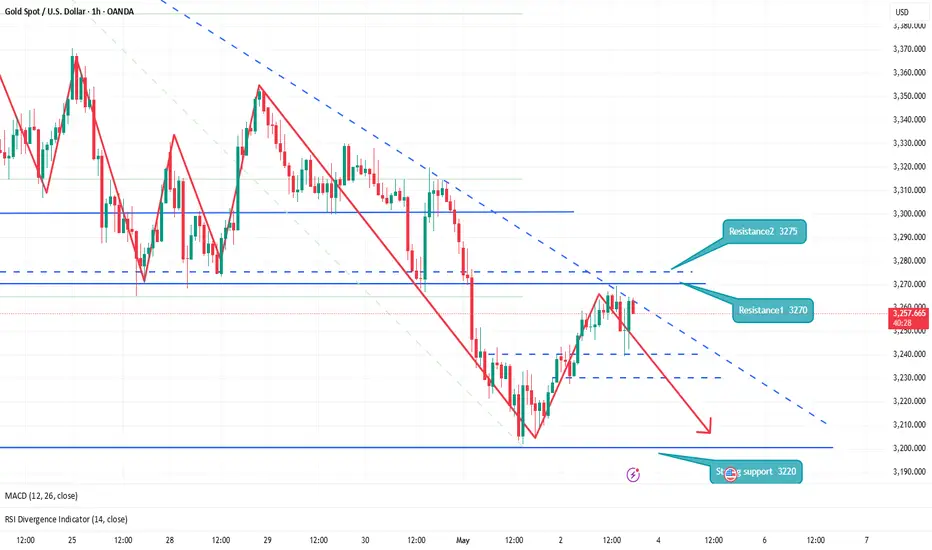
XAUUSD UPDATE : FED INTEREST RATE DECISION hello & happy weekend everyone
For coming week trade forecast. From the left side, the daily chart indicates that a breakout has occurred, and the current increase is a temporary pullback. If a rejection happens at the 0.236 daily retracement and the trendline on 1 hour chart successfully pushes the price downward, I see an opportunity to short towards the upcoming Fed interest rate decision.
And I am very grateful for the support given, especially in some of the previous trades. I hope that my trade plan can help traders identify the direction to enter the market.
good luck all
**My trading strategy is not intended to be a signal. It's a process of learning about market structure and sharpening my trading my skills also for my trade journal**
Thanks a lot for your support
