A Clear Bearish Structure (READ CAPTION)1. Overall Trend: The chart shows a clear bearish structure for XAU/USD (Gold vs. US Dollar) on the 1-hour timeframe. Price is making lower lows and lower highs, suggesting strong downward momentum.
2. Key Zones:
• Support Area (Blue Zone around 2321): Price is reacting to this level with a potential bounce forming an ‘M’ structure (double bottom). This could indicate a short-term support or potential reversal area.
• Resistance Area (Pink Zone): Marked as a critical zone. The note “IF GOLD BREAKS THIS AREA WE CAN CLOSE OUR BEARISH TRADES” implies this is a key invalidation level for bearish bias.
• Target Point (Below 3190): Indicates a bearish target if price breaks the support and continues downward.
3. Trade Setup:
• It looks like a continuation short trade is being considered with the expectation that price will break the support zone.
• Good risk management is shown with a clear stop-loss area (above the pink zone) and target level.
4. Additional Thoughts:
• Watch how price reacts at the support zone. If it shows bullish momentum or fails to break strongly, the setup might become invalid.
• Confirmation with a bearish candlestick pattern at the support break could add confluence.
GOLD.PRO.OTMS trade ideas

Gold shortShort position on a LTF .
i think it retraces a little bit and then it continues higher on HTF.

Key pressure point of gold price on Monday: 3275Key pressure point of gold price on Monday: 3275
1: Falling below 3275, overall bearish + shock range (3220-3260)
2: Gold price still has room to fall, technical aspect: 3220-3200-3170-3100
3: Gold price may enter a wide range of shocks, shock range: 3200-3360
Therefore, our strategy is:
1: When the gold price breaks through the 3200 mark, we go long on gold at the lowest price, and the stop loss is set near 3200
2: When the gold price falls below the 3275 mark, we go short on gold at the highest price, and the stop loss is set near 3280
3: Once the gold price stands firm at the 3275 mark and continues to break through the 3275 mark, you can consider chasing the rise, and the stop loss is set near 3260.
4: Once the gold price breaks through the 3200 mark of 3275 and continues to run below 3200, you can consider chasing the decline and set the stop loss near 3200.
Then, considering the 1.2 strategy comprehensively, it is the most reliable strategy at present.
Let's review the current fundamentals:
What has Trump been busy with in the past 24 hours?
1. Plan to cancel Harvard University's tax exemption status
2. Call for tax cuts
3. Canadian Prime Minister will go to the United States to meet with Trump next week
4. Announce the 2026 budget
5. Try to squeeze the revenue of pharmaceutical companies to pay for tax cuts
6. Put pressure on Mexico
7. Release an AI-synthesized "Pope Photo"
Conclusion: Brave people enjoy the world first

Gold Sellers Incoming!!Fed holding rates steady this week and the technicals show strong signs of a corrective phase coming on gold.

Gold XAUUSD Possible Move 01-02 May 2025📉 Gold Technical Outlook
Gold has decisively broken a key support zone between $3,268–$3,274, now trading near the $3,210-20 level. This move comes amid a clear downtrend structure, with price action respecting a well-defined descending trendline.
🔍 Current Technical Context:
Trend: Bearish
Support Turned Resistance: $3,268–$3,274
Immediate Support: $3,210–$3,220
Resistance: Trendline and previous support zone near $3,270
A retest of the broken support zone could offer a high-risk, high-reward shorting opportunity, especially if price fails to reclaim it. However, a clean break below the $3,210–$3,220 support could trigger another aggressive selloff, with downside targets potentially extending below $3,160.
📊 Key Drivers (Geopolitical/Fundamentals)
US Dollar Strength: The USD remains firm despite mixed economic data, applying pressure on gold prices.
Geopolitical Easing: Reduced US-China tensions are weighing on safe-haven flows, as US approaches China for talks on tariffs.
Russia-Ukarine: Russia declaring cease-fire for a week.
Technical Pullback: Gold is correcting after a strong rejection from the $3,500 zone.
Profit-Taking: Recent rejection led to bearish closes as traders locked in gains.
Liquidity Considerations: With May 1 being a public holiday in many regions, lower liquidity could amplify volatility.
Event Risk Ahead: Caution prevails ahead of key macro events including Non-Farm Payrolls (NFP) and the FOMC statement.
📝 Strategy Notes:
Sell-on-Rally Zone: $3,268–$3,274 (if price retests and rejects)
Bearish Continuation Trigger: Break and close below $3,210
Invalidation for Bears: Sustained reclaim of $3,274 and a break above the trendline
Stay nimble and monitor for reactions around the highlighted zones as event-driven volatility can cause swift moves.

GOLD - Bearish Pressure The chart for Gold (XAU/USD) on the 1-hour timeframe shows a recent sharp downward move, breaking below a previous level of support around $3,250. The price action has created a bearish fair value gap (FVG) between approximately $3,260 and $3,270, which could act as a potential resistance zone. Above this FVG, a Breaker Block in orange is also visible above - further reinforcing this area as significant resistance.
The initial sharp decline is indicated by a strong bearish candle, followed by some consolidation. A projected path suggests a potential retracement back up towards the FVG or volume imbalance before continuing its downward trajectory towards lower support levels around $3,200 and potentially $3,175. The $3,300 level appears to be a significant area of past volume resistance.

GOLD GOLD ,as market makers continues to take profit to correct overbought market we are seeing many support level fail to hold price.the 3rs and 4hr ema+sma is giving a signal of buy which is confirmed by market structure.

Gold update Chart Analysis
Trend: The market is currently in an uptrend with a pullback happening within a bullish flag or channel.
Current Price: Around 3,390.13
Support Zone: Near 3,322.725
Potential Entry: At or just below the current price level after a small dip (as shown by the blue arrow).
Bullish Bias: Based on the continuation pattern and price respecting the upward trendline.
📈 Trade Setup (Buy Position)
Entry: Around 3,390
Stop Loss (SL): Below the recent swing low or channel support → around 3,361
Take Profit (TP): Targeting the projected measured move → around 3,450 - 3,460
This setup gives a decent Risk:Reward ratio, approximately 1:2 or better, depending on the exact entry.
🔁 Summary
Entry: 3,390
SL: 3,361
TP: 3,450 to 3,460
Bias: Bullish continuation after a healthy pullback

GOLD China’s massive gold purchases carry significant geopolitical implications that reshape global economic and financial power dynamics:
1. Dedollarization and Reduced US Dollar Dominance
China’s aggressive gold accumulation is a core part of its strategy to reduce dependence on the US dollar amid rising geopolitical tensions and economic decoupling. By increasing gold reserves-while sharply cutting US Treasury holdings-China aims to insulate itself from dollar-related risks such as sanctions or asset freezes, as highlighted by the 2022 Russia-Ukraine conflict experience. This shift undermines the dollar’s global reserve currency status and supports the emergence of a more multipolar currency system.
2. Enhanced Sovereignty and Financial Security
Gold provides China with a tangible, sovereign asset that cannot be frozen or devalued by foreign powers. This strengthens China’s economic autonomy and resilience against external pressures, especially amid ongoing US-China trade conflicts and Taiwan tensions. Physical gold reserves bolster confidence in China’s currency (yuan) and financial system, helping to back efforts to internationalize the yuan and reduce reliance on Western financial infrastructure.
3. Geopolitical Influence and Economic Restructuring
China’s gold market dominance is part of a broader “economic divorce” from the West, reflecting deglobalization trends and the formation of alternative trading and financial systems led by BRICS and allied nations. By controlling significant gold supplies and refining capacity, China gains leverage in global commodity markets and strengthens its geopolitical influence, challenging US-led economic order.
4. Impact on Global Financial Markets and US Economy
China’s gold buying fuels a “virtuous cycle” for itself but a “vicious cycle” for the US: rising gold prices in dollar terms signal dollar weakness, prompting further diversification away from dollar assets, reducing demand for US Treasuries, pushing US bond yields higher, and increasing US borrowing costs. This dynamic pressures US fiscal stability and economic growth.
5. Strategic Resource Control and Long-Term Planning
The recent discovery of a massive gold deposit in China’s Hunan province (over 1,100 tonnes) further strengthens China’s position, potentially boosting reserves by 44% and reducing reliance on imports. This strategic resource control enhances China’s ability to influence global gold supply and pricing, reinforcing its geopolitical and economic ambitions.

xauusd ... 1h chart patternIt looks like me referring to a trade setup — possibly a stock or index you bought at 3394 with a target of 3500.
To assist better:
Is this a stock, index, or crypto?
Are you looking for a short-term, medium-term, or long-term view?
Would you like a technical analysis, news update, or something else?
Let me know how I can help further!

XAUUSDWe have two scenarios in the analysis: either a rise in the form of a trend, a staircase, or a deep correction and taking the buy zone. We wait for the deep correction of the market and taking the buy zone. However, if it rises in the form of a staircase, we will renew the entry, but in the event of any entry, geopolitical situations end the analysis and we analyze another analysis or another renewal.

Gold will first rebound and adjust its rhythm.The 4H chart is a bullish structure. In the short term, it is necessary to continue to be strong, with the target of 3202-3500 connecting the 50% rebound point of 3350. In the medium term, before breaking through the 61.8% rebound point of 3386, maintain a bearish mindset. Short-term support is 3310, strong support is 3304-3300; short-term resistance is 3328, strong resistance is 3336-3350. If it breaks through strongly, pay attention to the attack and defense of the 3370-3386 range.

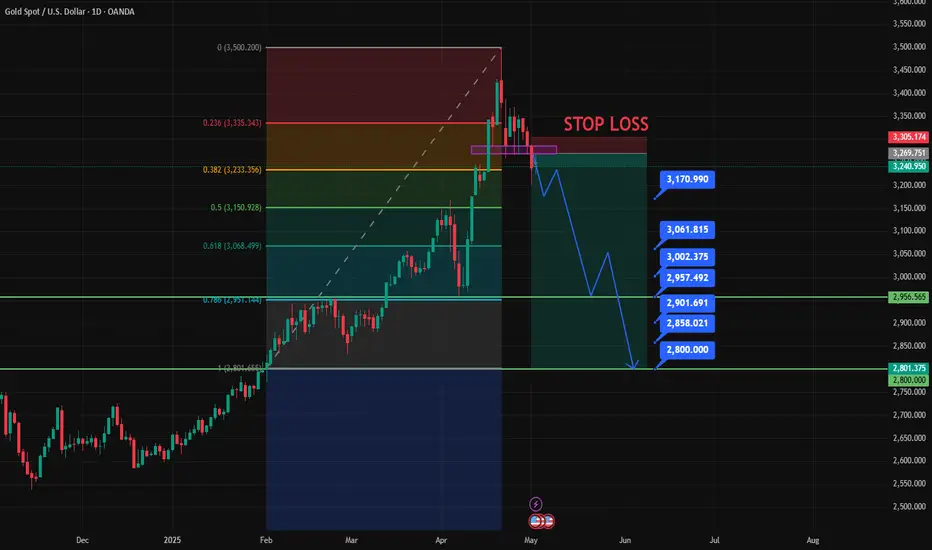
XAUUSD- 1H UpdateChart Description – XAUUSD 1H (Gold Spot vs. USD)
This is a multi-scenario Smart Money Concept (SMC)-based projection chart for Gold (XAUUSD), focusing on potential bullish retracements and major bearish continuations, incorporating Buy Zones, Sell Zones, and Change of Character (CHOCH) areas.
🔍 Key Components:
🟣 Sell Zones
Two sell zones are identified, with the highest near the All-Time High (ATH) around the $3,500 mark.
These are areas of expected bearish reaction if price retraces upward after a low.
🟢 Buy Zones
Located between $3,200 – $3,160 and another deeper one near $2,960, where potential bullish reactions may occur.
🔵 CHOCH - 4H
Marked in red around $3,260 area, indicating a 4-hour Change of Character, suggesting a potential shift from bullish to bearish sentiment.
🔸 Key Price Levels
$3,120: Historical support/resistance.
$2,956.20: Major swing low and key demand zone.
📊 Projected Market Path (Colored Waves)
🔹 Blue Path (Bullish Retracement Scenario)
Price is expected to retrace into a sell zone around $3,400–$3,460 after testing the current demand.
From there, a major sell-off is anticipated.
🔷 Cyan Path (Bearish Continuation)
Following the retracement, the market is projected to break below the recent low and head toward lower buy zones, potentially near the $3,120 and $2,960 regions.
Shows lower-high and lower-low formation, consistent with a bearish trend.
🧠 Market Sentiment
This chart suggests a bearish outlook for Gold unless a structural shift invalidates the CHOCH zone and supply levels. The chart highlights the importance of:
Waiting for confirmation in the supply zones before shorting.
Considering buy opportunities only in valid buy zones with bullish reaction confirmation.

XAUUSD:It is the right time to go short at high levels.The price of gold has strongly surged to around $3,315, forming a key resistance level. Analyzing from both the technical perspective and market sentiment, the selling pressure above this price level is remarkable, and the risk of a short-term pullback has intensified. The current market structure indicates that placing short positions at this high level may effectively capture the profit-taking space during the price correction, which can be regarded as a sensible trading strategy.
XAUUSD
sell@3315-3320
tp:3300-3280
The price of gold has strongly surged to around $3,315, forming a key resistance level. Analyzing from both the technical perspective and market sentiment, the selling pressure above this price level is remarkable, and the risk of a short-term pullback has intensified. The current market structure indicates that placing short positions at this high level may effectively capture the profit-taking space during the price correction, which can be regarded as a sensible trading strategy.

XAUUSD Today's strategySince breaking through the narrow trading range, the price of gold has entered a new round of fluctuations and is currently trading within the range of $3,200 to $3,272. Although the gold price has adjusted by approximately $300, this does not mean that the pullback market has come to an end.
From a technical perspective, within the 4-hour cycle, all moving averages are pressing downwards, forming strong resistance and continuously suppressing the upward movement of the gold price. At the same time, the gold price has repeatedly fallen under pressure after touching the downward trend line, indicating that the bearish force still dominates and the overall downward trend has not been reversed. If the resistance level of $3,272 continues to function effectively, it may be a more ideal trading strategy to place short positions at higher levels in the short term.
XAUUSD
sell@3272-3265
tp:3240-3230
I am committed to sharing trading signals every day. Among them, real-time signals will be flexibly pushed according to market dynamics. All the signals sent out last week accurately matched the market trends, helping numerous traders achieve substantial profits. Regardless of your previous investment performance, I believe that with the support of my professional strategies and timely signals, I will surely be able to assist you in breaking through investment bottlenecks and achieving new breakthroughs in the trading field.

GOLD WILL DROP MORE !!HELLO TRADERS
As i can see Gold break 3300 levles which was expected a Strong Support Zone for a new ATH
but its rejected and now we had saw a Trade War Talks on Going with US and China to be compromise soon on Friday we saw NFP results was good for Dollar and now after closing markets under 3260 is a clear sign for us for a more incoming drop in precious metals Gold Long Term View is still bullsih but markets always not move in one direction so it a great trade ida with a very low Risk and higher Rewards we need ur Support and comments Stay Tuned for more Updates ....
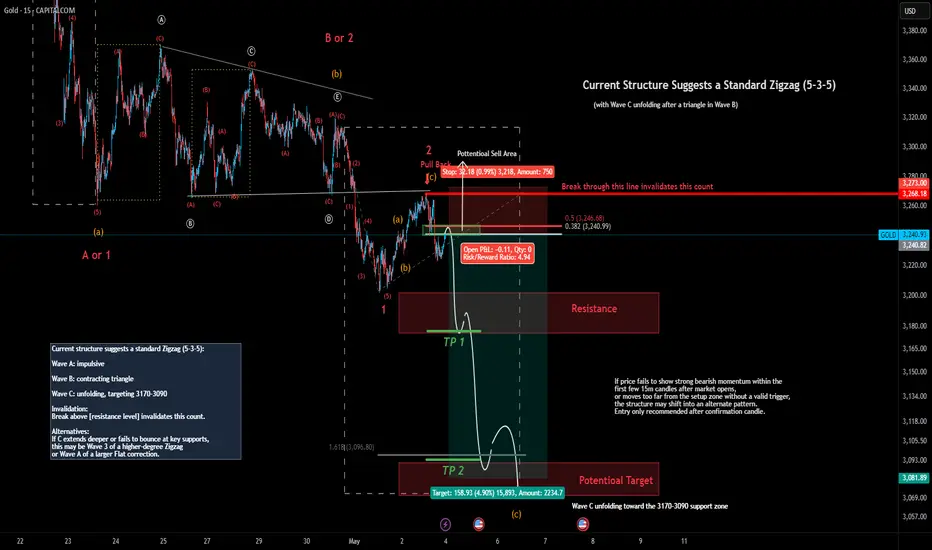
Gold 15m – Bearish Zigzag in Progress or a Larger Correction?This analysis presents a bearish short-term setup on XAUUSD (15m) based on a clean Zigzag structure:
Wave A: Impulsive decline
Wave B: Contracting triangle
Wave C: Currently unfolding, with potential targets at 3170–3090
A potential short entry is highlighted within the yellow zone, with invalidation clearly defined above 3248.
If price accelerates lower after confirmation, the trade offers a favorable R:R setup.
If momentum is weak or price breaks above resistance, this count will be invalidated.
Alternative Scenarios:
This may evolve into Wave 3 of a higher-degree Zigzag,
or Wave A of a larger Flat correction if downside persists beyond expectations.
Let me know your thoughts — would you take this short, or do you see something else unfolding?

Range-bound volatility. Sell high and buy low.After the data release, the market reacted swiftly but in different directions. The US dollar index was indecisive after the data release. Although it briefly touched 100.0418, it then retreated to 99.9507, with a daily decline of 0.23%, failing to continue its previous strength. Spot gold dropped about $9 to $3,250 per ounce within one minute after the data release, but then rebounded to $3,255 per ounce with a daily increase of 0.56%. The short - term resistance levels of $3,260 and $3,265 have become the focus of attention. Overall, the better - than - expected performance of the April non - farm payrolls data has injected short - term confidence into the market. However, the revision of historical data and external uncertainties still make investors vigilant. In the short term, there may still be room for risk - assets to rise, but in the medium to long term, the downside risks are building up.
Trading Strategy:
buy@3225-3240
TP:3275-3290
If your current gold trading performance is not satisfactory and you hope to avoid detours in your investment, you are welcome to communicate and exchange ideas with us!

Gold potential sell setup Current market analysis reveals a potential sell zone in Gold. Key factors:
- Resistance sel llevel:(3267)
-
- Overbought conditions on the RSI
-
- Bearish divergence on the MACD
- Sell zone:------(3268)
-
- Take profit 1:( 3259 )
-
- Take profit 2: (3246)
-
- Stop loss: $ ( 3275 )
Monitor price action and adjust strategies accordingly. Trade with caution.
Good luck for this
Share your thoughts about this trading ideas 💡

NF shows a volatile downward trend
📌 Gold Information
China's Ministry of Commerce announced on Friday that the United States has recently initiated communication through official channels, expressing interest in restarting tariff negotiations. Beijing is currently evaluating the proposal, which has sparked optimism that a solution to the long-standing tariff deadlock between the world's two largest economies is imminent.
New hopes for a breakthrough in trade negotiations helped the dollar rise to a three-week high on Thursday, pushing gold prices down towards the $3,200 mark. However, the dollar's bullish momentum remains weakened as the market increasingly digests expectations that the Federal Reserve may cut interest rates further, especially with the closely watched US non-farm payrolls data about to be released.
📊Comment Analysis
NF news volatility is certain, having accumulated significantly since last week. Gold price confirmed the trend after breaking through 3267, and fluctuated downward below 3200
💰Strategy Package
TP1: $3290
TP2: $3280
TP3: $3270🔥
Buy gold area: $3175 - $3177 SL $3170
TP1: $3185
TP2: $3200
TP3: $3210⭐️
⭐️ Note: Labaron hopes that traders can properly manage their funds
- Choose the number of lots that matches your funds
- Profit is 4-7% of the fund account
- Stop loss is 1-3% of the fund account

Shorting Gold setupAgain, I got two setups done here. One may argue that why take only 1:2 profit target when you could have more. Of course, that is on hindsight. Plus, to do that you need to glue to the computer to close your position and while some like the thrill, I am OK with this strategy.
I won't advocate increasing your position size unless you are very confident but still, it is best to keep things conservative. What you want is CONSISTENCY !!!!
Notice that some of these positions were closed several days later which means you go to sleep knowing you have a tight SL and won't wake up with many zeros in red staring at you.
Looking at current price action, it looks like it could close 50% higher than the previous days which means tide may turn so will be observing the chart.
It is better to have frequent small profits of 2 vs risks of 1 over a period of time than to have volatile ins and out of your profits and losses. Again, different folks, different strokes. My strategy may not be to the liking of others who prefer to use leverage or go to smaller time frame like 5min or 1min to capture the quick moves. If that is your cup of tea, make sure you always use SL.
As usual, please DYODD
Remember - it is not about the losses you got hit but the ratios of your losses compared to your profits. You can still be in the green with just 4 positions of profits and 6 positions of losses. (4x2 = 8 minus 6x1 = 6 , your net position is still positive 2)

TARGET SUCCESSFULLYThis chart highlights a textbook liquidity sweep and reversal pattern in Gold (XAU/USD).
Key Levels:
- Resistance Zone: Clearly defined above 3,360, with multiple rejection points.
- Support Level: Around 3,250, acting as a strong demand area.
- Liquidity Zone: Price dipped below the support to trigger stop-losses and trap sellers before reversing upward.
Price Action Insights:
- After grabbing liquidity below the support zone, the price rallied back, confirming a reversal setup.
- The move reached the target zone at 3251.225, fulfilling the projected bullish objective.
Outcome:
The trade idea played out successfully with the target marked as complete. Now, price is hovering at the former support-turned-resistance zone.
Next Steps:
Traders should monitor for:
- A potential breakout above this zone for continuation.
- Or rejection signals for a short-term pullback.
