Gold lower timeframe trade setup M3 trade setup little bit late but still market respecting our levels
GOLD.PRO.OTMS trade ideas

GOLD WILL GROW FURTHER|LONG|
✅GOLD is trading in a strong
Uptrend so we are bullish
Biased and the price already
Made a bullish rebound from
The horizontal support
Around 3360$ so we will
Be expecting Gold to
To go further up
LONG🚀
✅Like and subscribe to never miss a new idea!✅
Disclosure: I am part of Trade Nation's Influencer program and receive a monthly fee for using their TradingView charts in my analysis.

Gold bulls are comingHuang recommends buying on pullbacks and selling on rebounds today. The upper resistance is 3420-3430, and the lower support is 3365-3370. Friends must keep up with the pace. Control positions and stop losses, set stop losses strictly, and do not resist orders.

GOLD Fresh update after Baseent NewsAs I mentioned earlier, based on the daily candle analysis, we’re likely to see only a minor drop of around 50 to 80 points — no major panic drop is expected before 4080. This is the time to stay focused and look for strong buying opportunities. The next target is in the 3625 to 3650 range. Trade safely — here come the bulls again!

It is in an upward trend with fluctuations, and the overall viewFrom the perspective of the intraday price action, gold exhibits the typical feature of a rapid rally after a small-cycle correction. On the daily chart, the K-line combination continues to be in a bullish arrangement, and the moving average system shows a divergent upward trend. The technical pattern conforms to the characteristics of a "stepped short squeeze", and there is a relatively high probability that the upward trend will continue in the future.
Taking into account both fundamental and technical factors, the current gold market is still in a strong pattern dominated by the bulls. In terms of the trading strategy, it is recommended to focus on going long on pullbacks. At the same time, be vigilant against the risk of short-term fluctuations triggered by an unexpectedly hawkish tone of the Federal Reserve's policy.
During the US trading session, the price of gold rose to 3,399 and then declined. It is currently quoted at 3,395. The K-line combination pattern on the 4-hour chart is bullish. There is a relatively low probability of a significant trend change on Wednesday, and it is expected to continue to rise in a volatile manner tomorrow.
The short-term support is at 3,374, and the strong support is in the range of 3,370 - 3,366. The short-term resistance is at 3,388, and the strong resistance is at 3,398. If this level is broken, the upward target can be seen at 3,410.
Regarding specific price levels, the area between 3,430 - 3,470 US dollars per ounce (the resonance resistance of the Fibonacci extension level and the previous densely traded area) needs to be closely watched on the upside. On the downside, the support zone between 3,260 - 3,250 US dollars per ounce (the double support of the bullish trend line and the round-number psychological barrier) should be closely monitored.
you are currently struggling with losses, or are unsure which of the numerous trading strategies to follow, at this moment, you can choose to observe the operations within our channel.
Trading Strategy:
buy@3375-3380
TP:3400-3430

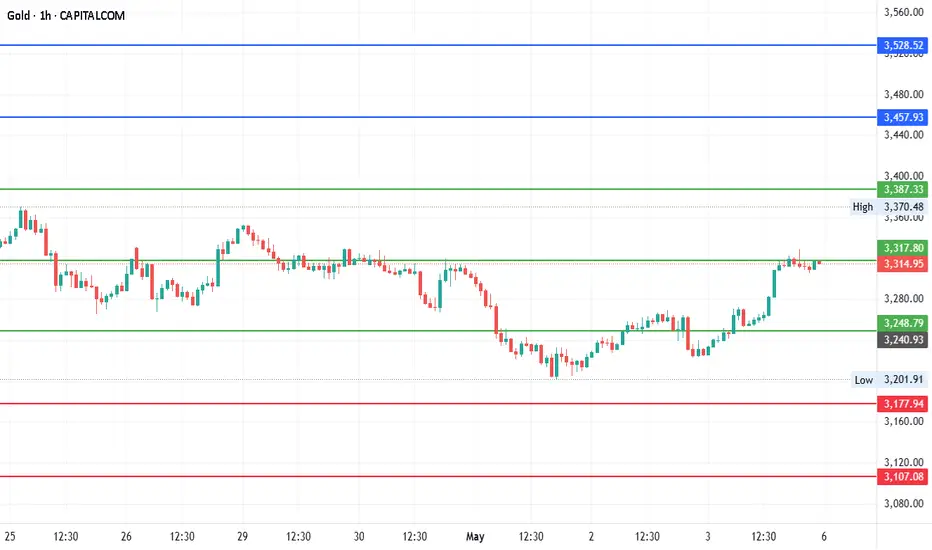
GoldCurrent Price: $3317
Mid-point: $3317.80
Upside: $3457.93, $3528.52, $3607.54 and $3686.56
Downside: $3177.94, $3107.08, $3028.06 and $2949.04
Resistance: $3387.33
Stoploss: 3248.79
#Gold
#GoldChartAnalysis
Gold short Short from 3425$ region.
Gold has to retrace before it keeps going higher.
Let us first wait for 3400 region.

XAU/USD "The Gold" Metals Market Heist Plan (Swing/Day Trade)🌟Hi! Hola! Ola! Bonjour! Hallo! Marhaba!🌟
Dear Money Makers & Robbers, 🤑 💰💸✈️
Based on 🔥Thief Trading style technical and fundamental analysis🔥, here is our master plan to heist the XAU/USD "The Gold" Metals Market. Please adhere to the strategy I've outlined in the chart, which emphasizes long entry. Our aim is to escape near the high-risk ATR Zone. Risky level, overbought market, consolidation, trend reversal, trap at the level where traders and bearish robbers are stronger. 🏆💸"Take profit and treat yourself, traders. You deserve it!💪🏆🎉
Entry 📈 : "The heist is on! Wait for the NEUTRAL LEVEL breakout (3400) then make your move - Bullish profits await!"
however I advise to Place Buy stop orders above the Moving average (or) Place buy limit orders within a 15 or 30 minute timeframe most recent or swing, low or high level for Pullback entries.
📌I strongly advise you to set an "alert (Alarm)" on your chart so you can see when the breakout entry occurs.
Stop Loss 🛑: "🔊 Yo, listen up! 🗣️ If you're lookin' to get in on a buy stop order, don't even think about settin' that stop loss till after the breakout 🚀. You feel me? Now, if you're smart, you'll place that stop loss where I told you to 📍, but if you're a rebel, you can put it wherever you like 🤪 - just don't say I didn't warn you ⚠️. You're playin' with fire 🔥, and it's your risk, not mine 👊."
📍 Thief SL placed at the recent/swing low level Using the 4H timeframe (3200) Day trade basis.
📍 SL is based on your risk of the trade, lot size and how many multiple orders you have to take.
🏴☠️Target 🎯: 3680 (or) Escape Before the Target
🧲Scalpers, take note 👀 : only scalp on the Long side. If you have a lot of money, you can go straight away; if not, you can join swing traders and carry out the robbery plan. Use trailing SL to safeguard your money 💰.
💰💵💴💸XAU/USD "The Gold" Metals Market Heist Plan (Day / Swing Trade) is currently experiencing a Neutral trend (there is a chance to move bullishness🐂).., driven by several key factors.👆👆👆
📰🗞️Get & Read the Fundamental, Macro economics, COT Report, Geopolitical and News Analysis, Sentimental Outlook, Intermarket Analysis, Index-Specific Analysis, Positioning and future trend targets with Overall Score...... go ahead to check👉👉👉🔗🔗🌎🌏🗺
⚠️Trading Alert : News Releases and Position Management 📰 🗞️ 🚫🚏
As a reminder, news releases can have a significant impact on market prices and volatility. To minimize potential losses and protect your running positions,
we recommend the following:
Avoid taking new trades during news releases
Use trailing stop-loss orders to protect your running positions and lock in profits
💖Supporting our robbery plan 💥Hit the Boost Button💥 will enable us to effortlessly make and steal money 💰💵. Boost the strength of our robbery team. Every day in this market make money with ease by using the Thief Trading Style.🏆💪🤝❤️🎉🚀
I'll see you soon with another heist plan, so stay tuned 🤑🐱👤🤗🤩

XAU/USD For Bullishwait for pull-back near by entry point and then go long
general trend is up trend
have fun :)

XAUUSD: 5/5 Today’s Market Analysis and StrategyGold technical analysis
4-hour chart resistance level 3350, support level 3260
1-hour chart resistance level 3350, support level 3274
30-minute chart resistance level 3320, support level 3290
At the 4-hour level, gold lows continue to move up, highs continue to refresh, MACD technical indicators have formed a golden cross upward, adding momentum to the bulls.
The previous high of 3272 will turn into support after breaking through. If the retracement is large, buy again after stabilizing in the 3270-3280 range.
Short-term resistance is at the previous high of 3320. After breaking through, the upward trend will continue. The bullish targets are 3330 and 3350 respectively. If it is blocked near 3350, you can consider selling

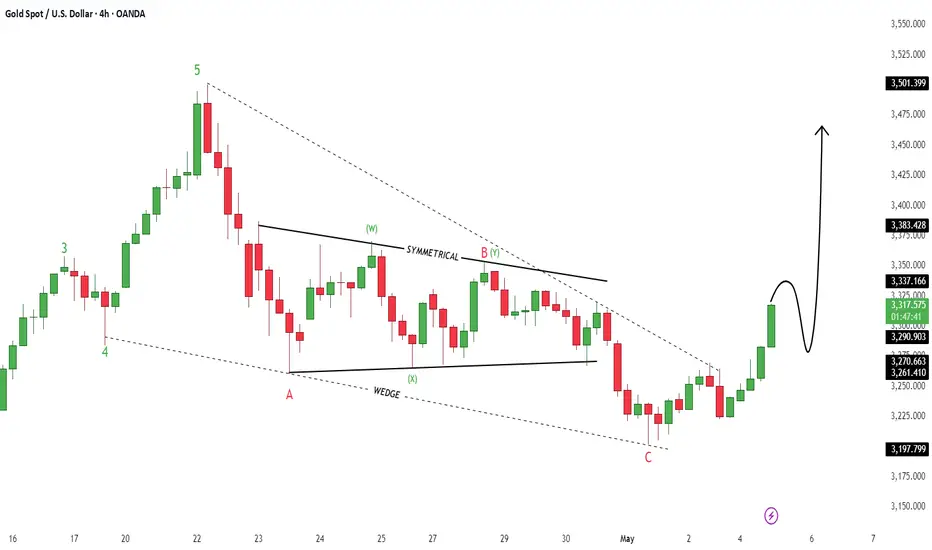
GoldXAUUSD
- Falling Wedge in Long Time Frame
- Completed " 12345 " Impulsive Waves and " ABC " Corrective Waves
- Break of Structure
- Symmetrical Triangle as an Corrective Pattern in Short Time Frame
- Demand Zone
XAUUSD Bearish Setup: Rising Wedge Breakdown Towards 3,166 Targe Overview
This chart illustrates a high-probability bearish setup for XAUUSD based on the breakdown of a rising wedge pattern. Rising wedges typically signal a potential reversal or correction, especially when they occur near a resistance zone and are followed by lower highs and diminishing bullish momentum.
🔍 Technical Breakdown
📐 Rising Wedge Pattern
The price of gold has been rising within a narrowing wedge, forming higher highs and higher lows but within converging trendlines.
This structure generally suggests weakening bullish momentum, and a breakdown is often followed by sharp bearish movement.
The breakdown from the wedge is already starting to form, as price struggles to make new highs near resistance.
🟥 Resistance Level (~3,280 – 3,300)
This area has historically acted as a supply zone.
Recent candlestick wicks show clear rejection in this area, confirming the presence of strong selling pressure.
Price failed to break above this level convincingly, indicating buyers are losing control.
🟩 Support Level (~3,200 – 3,215)
This zone provided a short-term base before the wedge formation.
If the wedge breaks, price may retest this zone on the way down.
If broken, this support could flip into resistance during a pullback.
🎯 Trade Setup
Bias: Bearish
Pattern: Rising Wedge
Timeframe: Suitable for short-term to swing trades (1H – 4H)
✅ Entry Point
Enter short on confirmation of a wedge breakdown (strong bearish candle close below the lower trendline).
Conservative traders can wait for a retest of the broken trendline for additional confirmation.
📉 Target
Primary Target: 3,166.10 – Measured move from wedge height and also aligns with a previous support area.
This area could act as a profit-taking zone as it represents both technical and psychological support.
🛑 Stop Loss
Place SL above the wedge resistance, around 3,313.69.
This protects against false breakouts or unexpected bullish reversals.
⚠️ Risk Management
Only risk a small percentage of capital (1–2%) per trade.
Ensure confirmation before entry – avoid entering early on low-volume breakdowns.
Consider scaling out partial profits near the support zone before the full target is hit.
🔧 Confluence & Validation
The setup aligns with basic price action principles: lower highs at resistance and exhaustion of bullish momentum.
Volume tends to drop during wedge formation and pick up during breakout – monitor volume for confirmation.
RSI or MACD divergence may further validate the bearish momentum.
🏷️ Conclusion
This rising wedge on XAUUSD presents a textbook short setup with a favorable risk-to-reward ratio. The structure, resistance zone, and loss of momentum indicate a potential shift to the downside. Traders should watch for confirmation before entering and use disciplined stop-loss management.

XAUUSDthe BEARS are back in control with the bull having tested and resoected the trendline, sweeped the NY high and the M15 closed below the SUPPLY.

Technical Analysis (15 min – XAUUSD)
1. **IRL FVG (Fair Value Gap) Zone**:
* Price has tapped into a major FVG labeled “IRL FVG.”
* Strong bullish reaction from that area suggests potential accumulation or mitigation.
2. **Market Structure**:
* There was a sharp bearish move right after taking liquidity above the "Initial Expansion Targets."
* After the drop, price begins to show potential bullish structure (possible market structure shift with bullish engulfing candle).
3. **Key POI (Point of Interest)**:
* A possible buy entry is marked with a ❤️ right after the bearish impulse, likely indicating a confluence of FVG + breaker/block + liquidity grab.
* There is also a visible **candle body gap** being partially filled.
4. **Likely Scenario**:
* If price holds above the grey FVG zone, we could see bullish continuation toward higher inefficiencies or unfilled targets.
* Buyers seem to have stepped in after a liquidity sweep, indicating short-term bullish momentum.
---
### 🧠 **Conclusion (Bias)**
* **Short-term bias**: 🔼 **Moderately bullish**, as long as price holds above the IRL FVG and local FVG.
* **Potential targets**: Retest of the -1 level or higher (-2), depending on bullish follow-through.
* **Invalidation**: A clean break below the 1.597 level (marked at the bottom) would likely invalidate the bullish idea.

Is the gold market ushering in betting?
📌 Gold driving factors
There are two aspects to look at the impact of April non-agricultural data on the gold market.
One is the data itself and the existing economic environment, and the other is combined with the technical aspect.
The market itself is troubled by the tariff issue. Whether it is the US stock market or the US dollar, it needs good economic data to boost it. Once the April non-agricultural performance is poor, the market sell-off will be out of control, and it also means that the risk of US economic recession is increasing.
Secondly, good data performance reduces the Fed's expectations for rate cuts. As we all know, the Fed's expectations for rate cuts or rate cuts are theoretically good for gold prices, and vice versa.
The cooling of the tariff issue may come soon, which is also not conducive to the rise in gold prices, but cooling does not mean the end, and the final achievement will definitely take some time.
📊Comment Analysis
"After experiencing short-term fluctuations, the price of gold appears to be relatively stable around $3,250. If it is to rise further, it must break through the $3,300 mark. But whether the market is ready to break through this point remains to be seen."
At present, gold is still in a continuous adjustment trend. Although it retreated to the 3,200 line on Friday and then rose again, it is still under pressure below the opening of the 3,265 decline. This is also the pressure level we need to pay close attention to next Monday!
The sideways trading period on Friday is long enough, and it is time for a breakthrough. So how should we arrange the market next week? It should not rise, but it will fall instead. It is not difficult to understand the trend on Friday. If it rises in the morning next week, it should be noted that the upper 3,265 is the watershed. If it breaks through, it will continue to rise, but if it is still under pressure, it is our opportunity to enter the short position!
💰Strategy Package
Operation ideas for next week:
Short at 3265 gold, stop loss at 3275, target 3230-3220;.
The market fluctuates violently, and real-time entry and exit are mainly based on real-time guidance!
⭐️ Note: Labaron hopes that traders can properly manage their funds
- Choose the number of lots that matches your funds
- Profit is 4-7% of the fund account
- Stop loss is 1-3% of the fund account

Xauusd buyBuying gold , it's just signal for you ,enjoy and make money , do anylisis and learn ,gold was good today we hit 400 pips in 2 trades ,

gold sellOANDA:XAUUSD Next TRD strategy and entry for Gold (XAUUSD) is here ↓
Expected price Dump after touching the entry zone.
TVC:GOLD TVC:GOLD

Technical analysis of short-term gold operations!!!On Wednesday, the gold price generally showed a downward trend. The highest price rose to 3327.91 on the day, and the lowest price fell to 3266.79, closing at 3288.16. In view of the fact that gold fell under pressure during the early trading on Wednesday and broke through the four-hour and daily support as expected, and then the US market rebounded again and came under pressure, and finally ended in a big negative state at the daily level. The price has fallen below the daily support, so we need to pay attention to the continuation of the band decline in the future.
From a multi-cycle analysis, first observe the monthly rhythm. The price rose for three months in the early stage and then a single-month correction appeared. Recently, it has risen for four months and then a single-month correction appeared. Therefore, according to the rhythm, four consecutive positives have appeared. For May, we must pay attention to market risks. From the weekly level, the gold price is supported by the support level of the 3040 area. From the perspective of the medium-term, we can continue to maintain a bullish view, and the price drop is only a correction in the medium-term rise. From the daily level, the current price resistance is in the 3007 area, which is the key watershed of the band trend. If the price is below this position, the subsequent band will be treated as short. At the same time, for the short-term four-hour price resistance, it is around 3290, so the subsequent price will be treated as short under the four-hour resistance. In general, the price can be treated as short under the four-hour resistance and the daily resistance.

ZIGZAG wave-c has startedContinuing the previous gold analysis
It seems that wave-(b) is turning into a normal zigzag and wave-c has started from the zigzag. Wave-c of this zigzag could end in the range of $3200-3216 or $3104-3118.
After the zigzag ends, we will have another upward movement in gold.


XAUUSD BULLISH IDEA TAKE ENTRY WITH CONFIRMATION FROM THIS LEVELI'm looking buy from 30mint order block price zone 3326-25 with 100 pip sl and target All time high with proper risk management

XAUUSD NEXT MOVE FOR FOMC NEWS TRADE Instrument: Gold CFDs (XAU/USD)
• Timeframe: 4H
• Current Price: ~$3,385.83
• Key Annotations:
• Support Zone: Around 3,280–3,360
• Breakout Point: Just above current price (~3,390)
• Resistance Level: Near 3,500
• FOMC Note: “FOMC TRADE DON’T MISS

Gold 100% Profit SignalTechnical analysis of gold: Gold has fallen after rising, and there is a large room for gold to fall, from 3438 to 3360 now, with a fluctuation of nearly 78 US dollars. Under this change, we should pay attention to whether the long and short changes of gold will continue. From the perspective of cyclical performance, there is a high possibility of a wave of adjustment space after three consecutive positive lines on the daily line, and the intensity of this adjustment will not be small. It is possible that the big negative line swallows the positive line and directly falls below 3300. If it comes out like this, then it can be said that it is difficult for gold to rise this week. On Thursday and Friday, it may fluctuate and fall or fluctuate at a high level.
From the perspective of the 4-hour cycle, a big negative line closed, covering the previous positive lines, and breaking the support of the 5- and 10-day moving averages. This wave may continue to fall to the Bollinger middle rail near 3300, but if it is a high-level shock and the Bollinger middle rail is not broken, it may rise again to the high point of 3430. Therefore, gold has experienced large ups and downs in this cycle, and now it is possible to rise or fall. In the short-term cycle, we will first focus on the support effect of 3360-3350 under the weakness of the early trading. If it is not broken, we can continue to be bullish. The upper target is 3400, and if the strength is strong, we will look at 3430. On the whole, the short-term operation strategy for gold today is to mainly short on rebounds and to do more on pullbacks. The short-term focus on the upper side is the 3400-3405 line of resistance, and the short-term focus on the lower side is the 3350-3300 line of support.
Short order strategy:
Strategy 1: When gold rebounds to around 3397-3400, short sell (buy short) in batches, 20% of the position, stop loss 6 points, target around 3360-3330, break the position and look at the 3300 line
Long order strategy:
Strategy 2: When gold falls back to around 3300-3305, buy long positions in batches (buy up) with 20% of the position, stop loss 6 points, target around 3330-3350, break the position and look at 3370
