Going Long On GoldGold (XAUUSD) Elliott Wave Analysis – Wave 5 Targeting New Highs
Gold has been exhibiting strong bullish momentum since yesterday, and based on the 4-hour Elliott Wave structure, we are currently in Wave 5 of a classic 5-wave bullish impulse. This final wave often aims to surpass previous highs, and with gold recently reaching an all-time high of $3,500.33, the current price action suggests a potential move to establish new record levels.
Key Levels to Monitor:
Resistance: Previous all-time high at $3,500.33
Support: Prior Wave 4 low, serving as dynamic trailing support
Traders should watch for a decisive break above the $3,500.33 level, which could confirm the continuation of Wave 5 and signal further upside potential. Conversely, failure to breach this resistance may indicate the onset of a corrective phase.
GOLD.PRO.OTMS trade ideas

GOLD - WAVE 4 CORRECTION TO $2,800 (UPDATE)Gold has climbed higher into our 0.365% zone, which I highlighted on yesterday's analysis. We will keep a close eye out to see if price action offers any rejection around this zone, for sellers to kick in. However, the closer it gets to the ATH, the higher chance of it creating a new ATH.

Sell Probably!Hello guys. Do you agree? Market will falling ASAP? I think it is a good option. it maybe a risky position, but lets see.(wink)

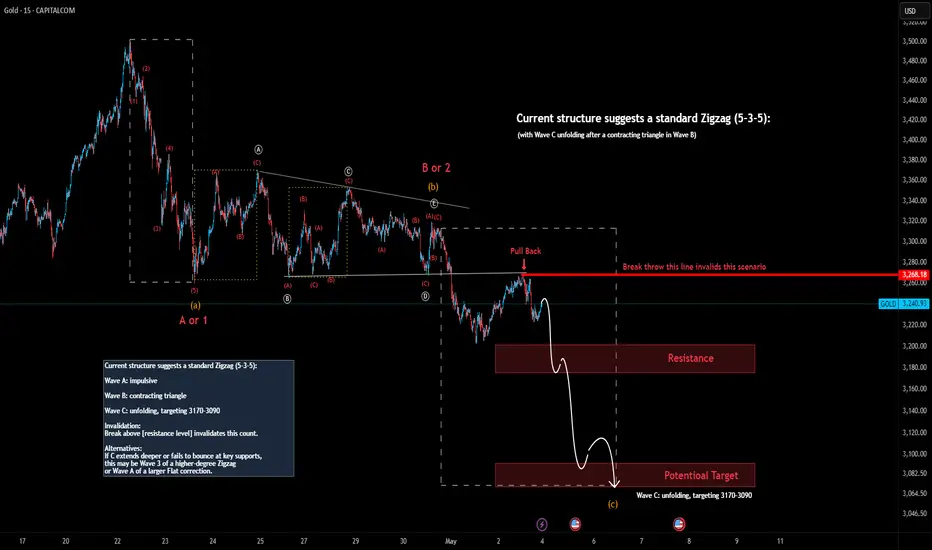
Gold 15m – Zigzag in Progress or Start of a Larger Correction?This analysis presents a short-term Elliott Wave count on Gold (XAUUSD) in the 15-minute timeframe.
The current structure suggests a standard Zigzag correction (5-3-5) unfolding from the recent high:
Wave A formed a clean 5-wave impulsive decline
Wave B developed as a contracting triangle (A-B-C-D-E)
Wave C appears to be in progress, with projected targets between 3170–3090
🔴 Invalidation level:
A break above 3248 invalidates this scenario and suggests that the correction is either complete or transforming into a different pattern.
🌀 Alternative Scenarios:
If price fails to reverse within the key support zone (3170–3090) or extends much deeper:
We may be witnessing Wave 3 of a higher-degree Zigzag
Or, this drop may be Wave A of a larger Flat correction in development
🗨️ What’s your view?
Do you agree with the Zigzag count?
Or do you expect a deeper, more complex correction to unfold?
Share your take in the comments below 👇
GOLD SELL WITH LIMIT ORDER!!!!!!!!Xauusd is currently on a down trend with price just created a lower low and is heading for a retest at the lower high or the buyside liquidity am looking at these sell limit 3,267 and 3,283 for selling opportunity.....
Lets know your thoughts on this.........

XAUUSD update Plan B after FOMCIf 3360 - 3350 level support broken, it could be make a retracement with 62% fibonaci.
Goodluck !

Gold Trading Strategy, May 7-8📊From the hourly level, gold formed a double-needle bottoming pattern near 3360 during the early morning correction, showing strong short-term support. At the same time, 3350, as the low point of yesterday's Asian session correction, also constitutes an important support area at present, which needs to be focused on in the short term.
📊Before the announcement of the Fed's interest rate decision, market sentiment is relatively cautious, and gold is expected to continue to fluctuate at a high level in the range of 3350 to 3400. In terms of trading strategy, you can continue to maintain the idea of selling high and buying low in the range, that is, try to short with a light position near 3400, and try short-term long orders when it falls back to 3350.
📊If gold breaks below the 3350 support line, it means that the short-term structure will weaken. It is recommended to follow the trend and go short. The further downward target can focus on the 3290 line, which is an important platform support area in the early stage.
✅Short-term Trading Strategy:
🔰Within the range (3350-3400): mainly sell high and buy low;
🔰If the support of 3350 is broken: follow the trend and go short, the target is around 3290;
🔴Upper resistance level: 3400-3410;
🟢Lower support level: 3350, 3290.
✅Trading strategies are time-sensitive. We will provide members with real-time and accurate trading strategies based on market changes. Short-term trading requires flexibility, timely adjustment of positions, strict risk control, and ensuring that you are not affected by large fluctuations.

Gold Spot Levels 1. Trend Overview (Multi-Timeframe Analysis)
Daily (D): Bullish
4H: Bullish
1H: Bullish
15M and 5M: Bearish
🔍 This shows strong upward momentum on higher timeframes, with only a minor intraday pullback or consolidation.
2. Price Action
Current Price: $3,387.50
Recent High: $3,438.16 (marked as resistance)
Immediate Support: $3,360.20
Consolidation Range: Between $3,360.20 (support) and ~$3,390–$3,400 (resistance zone)
📊 Price appears to be consolidating near highs after a strong uptrend — typical bullish flag or pause before breakout behavior.
3. Key Support & Resistance Levels
Level (USD) Type Implication
3438.16 Resistance Key short-term high
3387.50 Price Current consolidation level
3360.20 Support Immediate and strong support
3330.12 / 3319.82 Support Zone Ideal pullback entry for buyers
3269.27 Support Deeper correction support
3222.94 / 3201.96 Support Zone Strong base zone from earlier trend
4. Market Structure
The chart shows a clear higher high and higher low structure.
A bullish breakout occurred from the base near $3,220–$3,270.
The rally paused near $3,438 and is now consolidating just below.
5. Candlestick Pattern Insight
Several small-bodied candles near current levels indicate indecision — a range-bound market likely awaiting a catalyst.
A breakout above $3,400 could trigger continuation toward or above $3,438.
6. Market Sentiment
✅ Bullish Bias overall.
❗ But caution in short term (15M/5M bearish) — could dip toward $3,360 or $3,330 before next leg up.
Trade Setup Idea (Hypothetical)
Bullish Scenario:
Entry: On breakout above $3,400
Stop-loss: Below $3,360
Targets: $3,438 → $3,460+
Pullback Buy:
Entry: $3,330–$3,320
Stop-loss: $3,300
Target: $3,390–$3,430

Gold Technical Analysis.The image you uploaded is a technical analysis chart for XAU/USD (Gold) on the 1-hour timeframe, published on TradingView. Here’s a breakdown of the chart:
1. Trend and Pattern:
The chart shows a bullish trend with two ascending channels (marked in green) that recently broke to the downside.
The price reached a resistance zone (marked with a black rectangle) and reversed sharply.
2. Price Action:
The current price is approximately 3,370.94, showing a decrease of 1.91%.
After breaking the ascending channel, the price is showing bearish momentum.
3. Prediction/Target:
The chart suggests a potential continuation of the downward move, with a target around the 3,340 level (marked in blue).
A consolidation or small pullback is indicated before continuing downward.
4. Key Zones:
Resistance Zone: Around 3,400 - 3,440.
Support Zone/Target: Around 3,340.
The chart analysis indicates a bearish bias with the possibility of a price drop toward the target zone. Would you like insights on trading strategies based on this analysis?

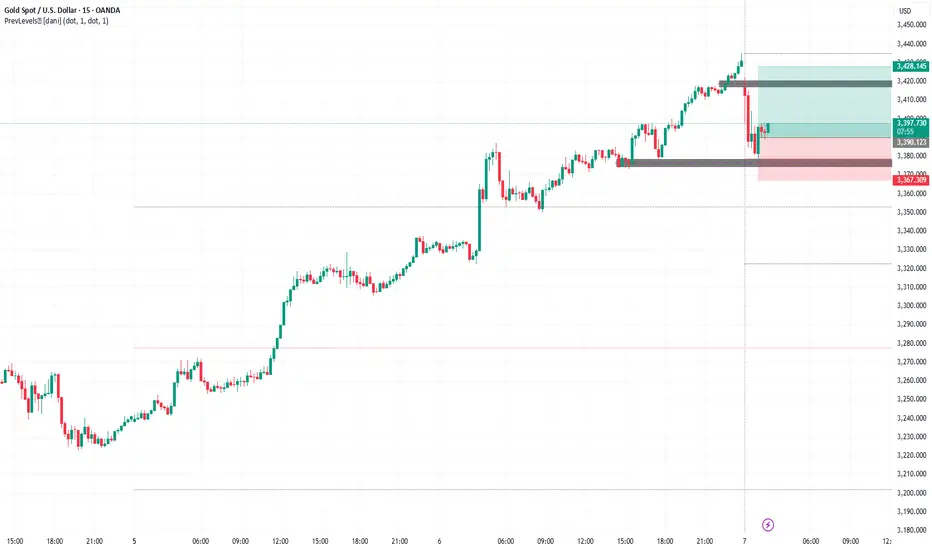
GOld BuyWe are in an uptrend. We have an engulfing candle on 15th minutes . WE join the market at the current rate hoping to fill the gap that is between 3420 and 3428
Positive tariff news favors lower gold prices - wait for FOMC🔔🔔🔔 Gold news:
➡️ Gold prices ended the week down around 2.50% as improved risk appetite - driven by easing trade tensions and a strong US jobs report - prompted investors to book profits ahead of the weekend.
➡️ Over the weekend, China's Ministry of Commerce said the US was open to trade and tariff talks, reaffirming that Beijing's door to dialogue remains open.
➡️ Bullion prices continued to fall after April's non-farm payrolls unexpectedly rose, beating expectations, while the unemployment rate remained unchanged from March. XAU/USD fell to an intraday low of $3,222 as traders reduced expectations for four rate cuts from just three now.
Personal opinion:
➡️ There is still no strong enough momentum for gold to continue rising and must wait for the upcoming FMOC. Therefore, gold will maintain a short-term downtrend in the beginning of next week
➡️ Note: any information about the US-China trade war is given top priority
➡️ Analysis based on resistance - support levels and trend lines combined with EMA to come up with a suitable strategy
Plan:
🔆Price Zone Setup:
👉Buy Gold 3293 - 3296
❌SL: 3190 | ✅TP: 3200 - 3205 - 3210
👉Sell Gold 3255 - 3258 (Scalping)
❌SL: 3263 | ✅TP: 3251 - 3246 - 3240
FM wishes you a successful trading week 💰💰💰

XAUUSDpossibility of a long position.
- a lot of bullish momentum
- retested upwards trendline
- market structure is in a upwards continuation
- bullish engulfing candles
- price broke through demand zone, now we wait to see if it breaks back through or changes direction (bearish)

Gold Will Fall DownXAU/USD Analysis (4H)
Observations:
- Current price nearing a Bearish Fair Value Gap (FVG) zone
Trade Idea:
- Expecting a downward push from the FVG zone
- Sell opportunity in Gold
Target:
- 3150
This setup suggests a potential sell signal, with the FVG zone acting as a resistance level. Let's see how the market reacts.

GoldXAUUSD
- Descending Triangle as an corrective pattern in Short Time Frame
- Break of Structure
- S / R Level
- Change of Characteristics
- Completed " 12345 " Impulsive Waves and " ABC " Corrective Waves

#GOLD #IDEA #GOLD #IDEA we now arE at 50% of continuation RANG .Will it drop continue ?
let's See.we will focus on M15 and M5 looking for set-up for sell

Technical move on Gold XAUUSD GOLD Update H1 Timeframe 🙌
- This Analysis is based on Educational Purposes using Technical aspect ❗️
- We set our trendline accordingly to Technical Analysis
- There is a good selling Opportunity from 3278.00 - 3285.00 point
- Targets would be set according to charts 3264 - 3242.00 - 3230.00
Follow the Trend with 🔽
- Consistency
- Focus Mindset
- Confident
- Risk Management
Additionally: There is a high impact news which would fluctuate the market ❗️

Gold plummeted as expected. Operation strategy?In my last analysis, Quaid predicted that gold was at risk of falling and breaking.
Quaid promptly told everyone that they could short trade at 3310-3320.
At present, the market situation is basically consistent with Quaid's expectations. As of now, gold has fallen to a low point near 3215. And it has been maintained for some time.
Quaid speculates that gold will continue to maintain a bearish trend and continue to retreat.
Quaid data analysis:
From the hourly chart, gold is currently following a wave trend, and the highest point of 3352 is the starting point of wave A. The high point of wave b is at 3320. If the current 3220 is the beginning of the low point of wave C, then be careful of its continued decline.
Trading strategy:
In terms of the next operation, Quaid suggests waiting for short trading near 3225.
If gold falls below 3210 again, then the bottom can directly look towards the 3190-3200 range.
Quaid warned everyone not to think that the trading range is very large; because the trading markets in some Asian countries are closed, any terrible thing could happen. It is recommended that everyone take profits in time.

XAU / USD 4 Hour ChartHello traders. Happy Thursday. On the 4 hour chart, I have marked my area of interest to see if gold will keep pushing down or push back up to retest the breakdown area. Many times the overnight sessions get corrected with the NY open. Saying that, we may push up a bit only to come back down. Let's see how the 4 hour candle closes. Big G gets my thanks. Be well and trade the trend.

The Fed’s interest rate decision makes a grand debut
After gold quickly rose and fell today, gold basically began to fluctuate sideways. Of course, this is also to welcome the heavy data of the Federal Reserve's interest rate decision; gold is likely to fluctuate like this before the data, so where will the Federal Reserve's interest rate decision go? And how to lay it out?
Judging from the recent market and data, there is a high probability that gold will keep interest rates unchanged, so gold as a whole will still maintain a volatile upward trend. The gold 1-hour moving average is still a bullish arrangement with a golden cross upward. The strength of the gold bulls is still there, and gold will continue to make more dips. Gold 3350 is still an important turning point for gold's long-short transition. After the gold Fed interest rate decision, then we will continue to go long on dips above 3350. After the Federal Reserve's interest rate decision, gold will continue to buy on dips above 3350.
Gold's short-term trend is still a bullish arrangement. Gold will continue to buy on dips without breaking 3350. If the gold data unexpectedly falls below 3350, then re-arrange it at that time.
Operational ideas:
Gold more than 3350, stop loss 3340, target 3400-3420;

GoldXAUUSD
- Point of Interest
- Symmetrical Triangle as corrective pattern in Short Time Frame
- Order Block
- Completed " 12345 " Impulsive Waves and " AB " Corrective Waves
- Fibonacci Level - 38.20% / 50.00%

GOLD-NEUTRAL SELL strategy 3 hourly chart - GANN GOLD has recovered sharply but somehow it feels we may see a lower test once again. the short-term picture suggest upward pressure still.
Strategy SELL @ $ 3,3380 - 3,425 and take profit near $ 3,267 for now.

GoldXAUUSD
- Double Top as corrective pattern in Short Time Frame
- Break of Structure
- RSI - Divergence
- Completed " 12345 " Impulsive Waves
- Change of Characteristics

The Trader’s Trinity: THE BIG 3 OF TRADING!Everyone talks about strategies, indicators, and secret setups.
But if you strip trading down to its core, three pillars separate the winners from the quitters.
me @currencynerd , i call them The Big 3:
✅ Mindset/ Psychology
✅ Risk Management
✅ Strategy/ System with edge
You master these — you grow.
You neglect even one — you stay stuck, or worse, blow up.
Let’s dig in.
🧠 1. Mindset: Your Inner Edge
Markets aren't just math — they’re emotion, fear, greed, and uncertainty.
Successful traders:
Stick to plans during volatility
Stay calm after wins or losses
Manage ego (no "I must be right!" trades)
Key mindset habits:
Journaling trades (and emotions)
Setting realistic expectations
Accepting losses as part of the game
🔔 Reminder:
The market doesn't owe you anything. Stay humble, stay focused.
💣 2. Risk Management: Your Lifeline
Risk management isn't sexy — until you realize it's the reason you survive long enough to succeed.
Never risk more than 1–2% of your account on a single trade
Use stop-losses religiously
Understand position sizing — bigger conviction doesn’t mean "bet the farm"
Be comfortable being wrong — because you will be, often
Quote to live by:
"Amateurs focus on returns. Professionals focus on risk."
You don’t need to win every trade. You just need to protect your downside.
📈 3. Strategy: Your Playbook
Strategy gets all the attention — but it's only powerful if Mindset and Risk are already in place.
Your strategy should answer:
When do I enter?
When do I exit?
How do I manage trades in between?
Good strategies:
Are tested (backtested and forward tested)
Are simple (complexity often kills execution)
Fit your timeframe and personality
Trend following, mean reversion, breakout trading, scalping — it doesn’t matter.
What matters is consistency and execution.
🚀 Why the Big 3 Matter More Than Anything Else
Mindset keeps you stable.
Risk Management keeps you in the game.
Strategy gives you direction.
Neglect one and your trading will eventually collapse — no matter how good the other two are.
Successful trading isn’t a magic trick.
It’s mastering boring basics, executed relentlessly.
Final Thoughts from @currencynerd
You don’t need to find the Holy Grail.
You just need to respect the Big 3:
Master your mind.
Respect your risk.
Stick to your strategy.
Most traders are searching for the secret.
Elite traders are perfecting the fundamentals.
Which group are you going to be in?
put together by : @currencynerd
courtesy of : @TradingView
