Gold Potential Bullish ContinuationGold price still seems to exhibit signs of potential Bullish momentum as the price action may form a credible Higher Low with multiple confluences through key Fibonacci and Support levels which presents us with a potential long opportunity.
Trade Plan:
Entry : 3389.8
Stop Loss : 3345
TP 0.9 - 1 : 3430 - 3434
GOLD.PRO.OTMS trade ideas

GOLDChina's central bank is aggressively accumulating gold reserves as part of a multifaceted strategic agenda, driven by the following factors:
1. Diversification Away from US Dollar Assets
China is reducing reliance on US Treasuries, converting proceeds into gold to mitigate risks from US sanctions, trade tensions, and dollar volatility.
Gold now represents 6.5% of China’s total foreign reserves (up from 5.9% in January 2025), signaling a deliberate shift toward non-USD assets.
2. Geopolitical and Economic Hedging
Escalating US-China trade conflicts (e.g., tariffs) and Taiwan tensions have heightened the need for a "safe haven" asset to insulate China’s economy.
Gold’s role as a crisis hedge is critical amid fears of financial instability or sanctions, especially with the US targeting Chinese exports.
3. Supporting the Yuan’s Global Role
Gold reserves bolster confidence in the yuan, aiding its internationalization and positioning it as a credible alternative to the dollar in trade settlements.
The PBOC’s gold-backed digital yuan initiative aims to enhance its appeal as a global reserve currency.
4. State-Mandated Institutional Demand
Chinese insurers and pension funds are required to allocate 1% of assets to gold, absorbing ~30–40% of global annual supply.
This creates structural supply deficits, driving up prices and reinforcing gold’s value in China’s reserves.
5. Undisclosed Strategic Stockpiling
Officially reported reserves (2,292t) likely understate holdings. Analysts estimate 40,000+ tonnes when including military and state-controlled entities.
Secret stockpiling prepares China for potential crises, including wartime financing or currency stabilization.
6. Market Dynamics and Price Control
The PBOC’s sustained purchases (12.8t in Q1 2025) and Shanghai Futures Exchange activity have fueled gold’s 20% price surge in 2025, enhancing reserve values.
By dominating physical markets, China gains influence over global gold pricing, reducing dependence on Western exchanges.
Summary:
Reduce USD dependency Swap Treasuries for gold Insulates against US policy risks
Yuan internationalization Back currency with gold reserves Enhances trust in digital yuan
Geopolitical hedge Prepare for trade/currency wars Stabilizes economy during crises
Control supply/pricing Mandate institutional buying, restrict exports Tightens global supply, supports prices
China’s gold strategy is a calculated response to global instability, aiming to secure economic sovereignty and challenge the dollar’s dominance. This trend is expected to persist, with analysts forecasting gold could reach $4,500/oz by late 2025 due to China-driven demand

Gold (XAUUSD) 4H Chart – Key Resistance Test: Breakout or RejectSimple Analysis:
Price is currently at a resistance zone (~$3,335).
Two possible outcomes are drawn:
Bullish scenario: Break above current resistance → move toward the next resistance (~$3,500+).
Bearish scenario: Rejection from current resistance → fall back to the support zone (~$3,240).
EMAs:
50 EMA (red) is above 200 EMA (blue) = bullish bias, but price must break resistance to continue upward.
Summary:
Watch for a breakout above ~$3,335 for bullish continuation, or a rejection for a potential drop to support near ~$3,240.

GOLD 1H CHART PATTERNThe chart shows a bullish breakout from a descending trendline after forming a triple bottom support around the 3,250 level on the 1-hour timeframe. The breakout is supported by strong bullish momentum and structure shift, with price making higher highs and higher lows. A successful retest of the broken trendline confirms the reversal. The setup suggests a continuation to the upside with good risk-to-reward potential. Entry is near 3,370, and the stop-loss is placed just below 3,350 to manage risk. This indicates strong buying interest and a potential move toward the next key resistance levels.
Entry : 3375
Target Zone: 3,500

Gold Prediction Hits 600+ Points – Spot On!Spot-on analysis! Yesterday’s gold setup played out perfectly, delivering over 600 points. Demand zone held strong, and bulls took full control. Precision pays off – follow for more high-probability setups!
#XAUUSD #GoldAnalysis #TradingView #PriceAction #ForexSignals #TechnicalAnalysis #GoldBulls #MarketPrediction #600Points #SmartTrading

GOLD Gold buying is exceptionally high in 2025, and this surge is directly linked to geopolitical tensions-especially between China, Taiwan, and the United States-as well as broader trade and economic uncertainty.
Key Reasons for High Gold Buying
1. Geopolitical Risk: China–Taiwan–US Tensions
Investors are flocking to gold as a safe haven due to escalating tensions in the Taiwan Strait and the broader US-China relationship. Even without open conflict, the risk of confrontation or trade war is enough to drive up demand for gold.
The mere threat of a China-Taiwan conflict is seen as a potential trigger for global financial shocks, prompting investors to hedge against instability by accumulating gold.
2. Central Bank and Institutional Buying (Led by China)
Central banks, especially China’s, are buying gold at record levels. In Q1 2025, China’s central bank added 95 tonnes of gold to its reserves, part of a broader move to diversify away from US dollar assets.
This central bank accumulation is a major structural driver of gold’s price surge, providing persistent upward pressure even as other asset classes remain volatile.
3. Trade War and Tariff Uncertainty
The US has announced aggressive new tariffs on Chinese goods, and China is expected to retaliate. This has reignited fears of a global trade war, further fueling safe-haven demand for gold.
Gold is less affected by tariffs than other assets, making it particularly attractive during periods of trade friction.
4. Dollar Weakness and Portfolio Diversification
A sharp decline in the US Dollar Index (DXY) has also contributed to gold’s rise, as investors seek assets that are less exposed to dollar depreciation.
Regulatory changes in China have allowed more institutional and insurance fund investment in gold, further boosting demand.
Summary Table
Driver Gold Buying Impact
China–Taiwan–US Geopolitical Risk Strongly increases demand
Chinese Central Bank Accumulation Structural, sustained boost
Trade War/Tariff Uncertainty Safe-haven flows surge
Dollar Weakness Makes gold more attractive
In summary:
Gold buying is at record highs due to a combination of China–Taiwan–US geopolitical risk, aggressive central bank purchases (especially by China), trade war fears, and a weaker dollar. The situation in Taiwan is a major catalyst, as any escalation would have global economic consequences, making gold the preferred hedge for both institutions and individual investors.

Buy gold, it will continue to 3350!Fundamentals:
Focus on Trump and the Fed;
Technical aspects:
Currently, gold is moving in a fluctuating upward manner, and in the short term, the effective double bottom structure constructed in the area around 3200 and 3220 supports the continued upward movement of gold. In the short term, gold is not very willing to fall, and it has not even been able to fall back below 3300 again. If gold breaks through the 3330-3335 area during the rebound, then gold will inevitably continue to rise to the area around 3350, or even the area around 3380.
Trading strategy:
If gold retreats next, we will mainly focus on the opportunity to go long on gold in the 3315-3305 area; TP: 3350

Gold is once again affected by tariffs and rises sharplyNews: Gold rose sharply, mainly because Trump announced a 100% tariff on all films produced abroad and entering the United States, which once again triggered global trade tensions. At the same time, the conflict between Russia and Ukraine is still ongoing, and the situation in the Middle East has become tense again. For example, Israel’s missile attacks retaliated against the Houthi armed forces in Yemen and Iran. These have stimulated gold’s safe-haven properties and pushed up gold prices.
Technical aspect: Gold bulls are strong, so there is a certain risk in shorting gold. The point of concern below is the low of 3323. If gold continues to maintain its strength, it is impossible to fall below the 3323 line again.
Trading ideas: Buy gold near 3338, stop loss 3330, target 3360

Gold operation strategyFrom the 4-hour analysis, the upper pressure is around 3336-3345, and the lower support is around 3280-3293. Continue to rely on this range to maintain the main tone of high-altitude and low-multiple cycles. For the middle position, watch more and do less, be cautious in chasing orders, and wait patiently for key points to enter the market.

Gold Weekly Outlook - XAUUSD May 5th- May 9th🌍 XAUUSD Weekly Outlook – “Gold’s Cooling Off… Or Just Reloading? 🔁💥”
📅 Week of May 5–9, 2025
After breaking records with a fiery move into 3533, Gold just blinked. But is this the start of a deeper pullback — or simply a power nap before another skyrocket? Let’s break it down.
🧱 Macro Structure:
🔹 Massive bullish expansion from sub-2000 to 3533 → clear weekly BOS & continuation
🔹 First real retracement candle after months of nonstop gains
🔹 Price now hovering around the 3240–3270 mid-range FVG zone
🔑 Key Weekly Levels + Real Confluence:
📍 Price Range Zone Type What’s Here & Why It Matters
3533 🔺 ATH / Weak High Top liquidity grab + Premium high — supply reaction confirmed
3480–3510 ⚠ Reversal OB zone Weekly OB + clean FVG + sell-off origin = potential rejection zone
3240–3270 🔵 Micro Demand Mid-imbalance fill + minor OB + current retest base
3050–3100 🟦 Weekly Demand Block Big boy OB + 50% FIB retrace + macro HL zone → sniper reentry magnet
2750–2850 🧠 Strong HTF Demand Long-term CHoCH zone + discount imbalance stack = last line of defense
🔎 Weekly Confluences:
✅ SMC: BOS confirmed, CHoCH flipped in 2023 = macro bullish bias holds
📐 FIBO: 3050–3100 = perfect golden pocket (50%) of last full impulse
📊 EMA 5/21: Full bullish lock, no signs of EMA cross down
🔥 Liquidity: Above 3533 = final weak highs, below 3050 = deep liquidity pool
🧭 Bias Summary:
Bullish overall, but watching for:
A trap sell into 3050–3100 (clean sniper reentry zone)
🧲 Liquidity grab near 3300+ that could fuel another leg up or fakeout
🙏 Like this breakdown? Boost and follow us for sniper setups all week.
📌 Important Notice!!!
The above analysis is for educational purposes only and does not constitute financial advice. Always compare with your plan and wait for confirmation before taking action.
#XAUUSD #GoldOutlook #SMC #LiquidityHunt #SmartMoneyFlow

xau bearish?Technical analysis imo shows xauusd is creating a bearish channel. Important to follow fundamental factors as this could change the outlook. Support levels at 3160 and 3100 important on the short to longer term trend.

Non-farm payrolls may bottom out and rebound!Today's opening continued to rebound and rise, and the daily line has gone through three consecutive negative lines. Today is the fourth day of the probability of correction, and the decline is bound to be not as large as yesterday. Therefore, the position of choosing a short position cannot be too low, because it is not extremely weak. The Asian session rebounded and corrected. In the afternoon, you can switch to a short position around 3260. The support below is 3230-3227!
For the big non-agricultural data in the evening, according to the ADP data on Wednesday, it is likely to be bullish for gold. Under the influence of the tariff war, the employment data may not be too good, and the economic situation will only get worse. There is no doubt about this. Comprehensive analysis, I think the probability of the big non-agricultural data and unemployment rate in the evening is relatively high. Therefore, shorting is limited to intraday, and the focus in the evening is on the bottoming out and rebounding cycles.

Will the market trend continue to rise before the Fed’s decisionFrom a technical perspective, gold has a large downward space after rising in the early trading session, from 3438 to 3365 now, with a fluctuation of nearly 73 US dollars. Under this change, we should pay attention to whether the long and short changes of gold will continue. From the perspective of cyclical performance, there is a high possibility of a wave of adjustment space after three consecutive positive lines on the daily line, and the intensity of this adjustment will not be small. It is possible that the big negative line swallows the positive line and goes directly below 3300. If it comes out like this, it can be said that it is difficult for gold to rise this week. On Thursday and Friday, it may fluctuate and fall or fluctuate at a high level.

Strong support at 3360; future trend analysis belowI mentioned yesterday that gold was accumulating bullish momentum to challenge the 3400 level at that time 📈. If the challenge failed, it would drop sharply 📉, and if it succeeded, it would continue to rise. That's why I advised you not to trade at that moment, as it was easy to choose the wrong direction and have your account wiped out 💥.
Currently, the international geopolitical situation has suddenly heated up 🌋, and the market's risk - aversion sentiment has once again pushed up the gold price 📈. However, tonight's Federal Reserve interest rate decision and Jerome Powell's speech will be key nodes in the battle between bulls and bears ⚔️. The sharp fluctuations in gold this morning conform to the characteristics of a washout 🌀. But be wary of a significant pullback after the continuous slow rise 🚨.
In terms of operation, it is recommended that investors avoid blindly chasing the upward trend and focus on the impact of the Fed's decision on real interest rates and the US dollar 👀. Currently, the resistance above is at 3397 - 3407, and the strong support level of 3360 has been tested twice today, showing a double V bottom pattern📊.
⚡️⚡️⚡️ XAUUSD ⚡️⚡️⚡️
🚀 Buy@3360
🚀 TP 3380 - 3390
Accurate signals are updated every day 📈 If you encounter any problems during trading, these signals can serve as your reliable guide 🧭 Feel free to refer to them! I sincerely hope they'll be of great help to you 🌟 👇

Daily live trade with XAUUSD in 15m/30m/1h 20250507Daily live trade with XAUUSD in 15m/30m/1h 20250507

GOLD Bullish Breakout!
HI,Traders !
GOLD is trading in an uptrend
And the price made a bullish
Breakout of the key horizontal
Level of 3350.56$ and the brekaout
Is confirmed so we are bullish
Biased and we will be expecting
A further bullish continuation !
Comment and subscribe to help us grow !

XAUUSD (GOLD) | 4H | SWING TRADING Good morning, my friends,
Gold is currently at the 3355.0 level.
Even if gold makes a correction at this point, my target remains 3461.0.
This is a swing trading model, so there may be delays in reaching my target. However, I am confident that I will reach it eventually.
Once we hit that level, I will share an update for you all.
Dear friends, your likes are always my biggest motivation to keep sharing analyses. That’s why I kindly ask each of my followers to show their support—please don’t hold back on the likes.
I sincerely thank everyone who supports me with their likes. It truly means a lot

Skeptic | XAU/USD Analysis: Gold’s Next Big Move Is Brewing!Hey everyone, Skeptic here! Let’s kick off the morning with a deep dive into XAU/USD —gold’s serving up some exciting opportunities right now! 😊 Activating our triggers could spark a sharp move, potentially reigniting the major trend from before, so stick with me to the end of this analysis. As always, we’ll start with the Daily Timeframe to get the big picture. Let’s dive in! 📊
📅 Daily Timeframe: The Big Picture
It’s clear as day—the major trend is bullish . We’re seeing higher highs and higher lows, which, per Dow Theory, confirms a solid uptrend. After gold hit a peak at 3502.48 , it entered a secondary corrective trend, pulling back to the 50% Fibonacci retracement level. This correction was healthy, and the price action suggests the uptrend still has plenty of juice left. 💪
Post the sell-off candle on May 1, it looks like the correction might be done, and we’re now heading to test the resistance at 3425.31 . If that level breaks, we could see the major uptrend resume with some serious momentum. With this in mind, let’s zoom into the 1-Hour Timeframe to hunt for long and short triggers.
⏰ 1-Hour Timeframe: Long & Short Setups
The last trigger I used for a long position was at 3270.75 , and it’s been performing nicely so far. But if this growth is to continue—and the correction is truly over—we’re about to see some explosive moves. The long trigger I’m about to share is worth the risk. Plus, if we don’t enter longs around these levels, it’ll get trickier later. A break above 3494.51 could come with heavy shadows, hunting stop losses, or it might spike too fast, leaving us without a good entry. So, the smarter play is to enter now with lower risk and higher R/R. Here’s the plan:
Long Setup 📈
Open a long position after a break above resistance at 3383.61 .
Target? The previous ceiling is a good start, but don’t close too early. Enter with the mindset that if the ceiling breaks, you’re already in a position, sitting pretty. Personally, I’m keeping my earlier long from below open, letting those profits run for peace of mind later. 😎
Short Setup 📉
For shorts, patience is key. Wait for a rejection from these levels, followed by a break below support at 3270.75 . That’s when we open a short position. No rush to short just yet—gold’s not showing signs of a momentum shift. But if it does, we could see deeper corrections, so keep both triggers on your radar. 🐻
🧠 Why This Matters
Spotting these triggers in a multi-timeframe setup gives us an edge, aligning short-term moves with the bigger trend. It’s all about stacking the odds in our favor. Want more insights like this? Check out my latest article on multi-timeframe strategies —it’s a game-changer! 📚
💬 Let’s Talk!
If this analysis helped you out, give it a quick boost—it means a lot! 😊 Got a pair or setup you want me to tackle next? Drop it in the comments, and I’ll get to it. Thanks for hanging out, and I’ll see you in the next one. Keep trading smart! ✌️

GOLD PLAN UPDATE 06/05/2025XAUUSD: Bullish momentum confirmed
Gold just printed a strong bullish D candle after days of retracement.
Price has broken H4 resistance zone — potential retest of previous ATH ahead.
✅ Still watching for new buy opportunities.

Gold: Multi-cycle Liquidity & The Silent ResetThe Grand-Scale Consolidation – The Market Reckoning
The exaggerated price hike has already priced in all major factors—interest rates, geopolitics, economic shifts, and institutional positioning. Fear drove the market upwards, but now, it’s time for a long-term balance that reflects real demand, not opportunistic hype.
Right now, gold demand is opportunistic. Wealthy investors and institutions jumped in early, securing "first come, first serve" pricing at the cheap side. But the over-inflated FOMO has pushed speculative pricing beyond its actual value.
Liquidity Trap at the Top—Now What?
Liquidity is locked in a high-stakes trap, forcing major players into a cycle of cashing out and recollecting liquidity pools to break even. The initial investment isn’t profitable unless liquidity gets redistributed.
Only big players can push price higher, but now they are risking their own liquidity—they underestimated retail traders, whose excitement keeps fueling the cycle.
The Grand Consolidation Range
This trick works on a global scale—economic policies, geopolitical moves, and institutional trade positioning are primed for consolidation. If price action confirms this range-bound phase, we could be looking at a multi-cycle balancing period before the market corrects to its true value.
Swing High : 3,403 - 3,500 – The extended liquidity trap zone where institutional players exit positions.
Swing Low : 3,215 - 3,134 / 2,970 – The deeper retracement zones where liquidity pools reset before the next expansion move.
Early Warning – The Consolidation is Setting Up
This isn’t just a minor retracement—this is the early warning of an extended consolidation phase, where liquidity must cycle multiple times before any true trend shift occurs. For traders, this means selling high and buying low, but only with near-term confirmation signals to avoid liquidity traps. Key areas to watch:
Volume shifts – Exhaustion vs continuation signs.
Price reactions at swing levels – Validating liquidity absorption.
Institutional positioning – Tracking big player activity in price action.
Speculation vs Reality – Time Will Tell
While the current market behavior signals consolidation, only time will confirm whether this phase will fully materialize. There’s no absolute certainty, but the conditions are aligning toward a grand-scale liquidity rotation that could define gold’s trajectory for the foreseeable future.
I’m putting this out there first—before the rest of the market catches on. Gold is primed for grand-scale consolidation, but as always, we shall see .


Gold price suddenly accelerates, approaching the 3,300 USD/ounceAfter two consecutive weeks of decline, the world gold price is showing strong signs of recovery when it skyrocketed to 3,266 USD/ounce - an increase of 25 USD in just one session. Although still quite far from the peak of 3,500 USD/ounce, the increase this morning shows that investor sentiment has begun to change direction.
The increase occurred at the beginning of the session despite previous negative forecasts, reflecting the sensitivity of gold to geopolitical and economic information such as US-China trade negotiations or the strength of the USD. The daily chart shows that gold has bounced strongly from the EMA34 support zone and returned to the resistance zone around 3,320–3,340 USD, opening up an opportunity to retest the 3,400 USD mark if the current increase is maintained.

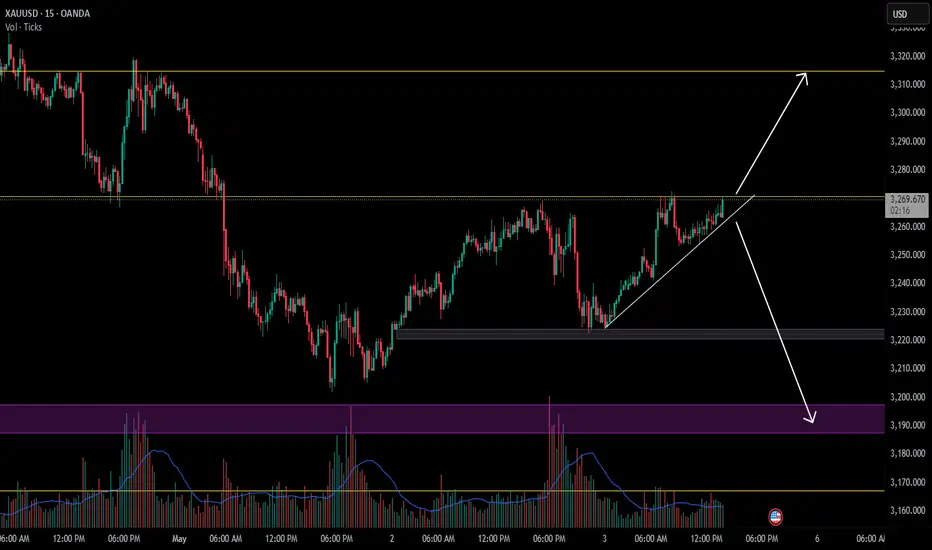
XAUUSD Analysis: Make or break
Price is currently approaching a key Level.
Upside Scenario: If XAUUSD breaks above 3270 and holds, we may see a bullish move towards the 3310 target.
Downside Scenario: If price fails to break above and instead breaks below the trendline, it could trigger a downside move toward 3200.
Watch for confirmation before entering any position.