GOLD Bullish Breakout!
HI,Traders !
GOLD is trading in an uptrend
And the price made a bullish
Breakout of the key horizontal
Level of 3350.56$ and the brekaout
Is confirmed so we are bullish
Biased and we will be expecting
A further bullish continuation !
Comment and subscribe to help us grow !
GOLD.PRO.OTMS trade ideas

XAUUSD (GOLD) | 4H | SWING TRADING Good morning, my friends,
Gold is currently at the 3355.0 level.
Even if gold makes a correction at this point, my target remains 3461.0.
This is a swing trading model, so there may be delays in reaching my target. However, I am confident that I will reach it eventually.
Once we hit that level, I will share an update for you all.
Dear friends, your likes are always my biggest motivation to keep sharing analyses. That’s why I kindly ask each of my followers to show their support—please don’t hold back on the likes.
I sincerely thank everyone who supports me with their likes. It truly means a lot

Skeptic | XAU/USD Analysis: Gold’s Next Big Move Is Brewing!Hey everyone, Skeptic here! Let’s kick off the morning with a deep dive into XAU/USD —gold’s serving up some exciting opportunities right now! 😊 Activating our triggers could spark a sharp move, potentially reigniting the major trend from before, so stick with me to the end of this analysis. As always, we’ll start with the Daily Timeframe to get the big picture. Let’s dive in! 📊
📅 Daily Timeframe: The Big Picture
It’s clear as day—the major trend is bullish . We’re seeing higher highs and higher lows, which, per Dow Theory, confirms a solid uptrend. After gold hit a peak at 3502.48 , it entered a secondary corrective trend, pulling back to the 50% Fibonacci retracement level. This correction was healthy, and the price action suggests the uptrend still has plenty of juice left. 💪
Post the sell-off candle on May 1, it looks like the correction might be done, and we’re now heading to test the resistance at 3425.31 . If that level breaks, we could see the major uptrend resume with some serious momentum. With this in mind, let’s zoom into the 1-Hour Timeframe to hunt for long and short triggers.
⏰ 1-Hour Timeframe: Long & Short Setups
The last trigger I used for a long position was at 3270.75 , and it’s been performing nicely so far. But if this growth is to continue—and the correction is truly over—we’re about to see some explosive moves. The long trigger I’m about to share is worth the risk. Plus, if we don’t enter longs around these levels, it’ll get trickier later. A break above 3494.51 could come with heavy shadows, hunting stop losses, or it might spike too fast, leaving us without a good entry. So, the smarter play is to enter now with lower risk and higher R/R. Here’s the plan:
Long Setup 📈
Open a long position after a break above resistance at 3383.61 .
Target? The previous ceiling is a good start, but don’t close too early. Enter with the mindset that if the ceiling breaks, you’re already in a position, sitting pretty. Personally, I’m keeping my earlier long from below open, letting those profits run for peace of mind later. 😎
Short Setup 📉
For shorts, patience is key. Wait for a rejection from these levels, followed by a break below support at 3270.75 . That’s when we open a short position. No rush to short just yet—gold’s not showing signs of a momentum shift. But if it does, we could see deeper corrections, so keep both triggers on your radar. 🐻
🧠 Why This Matters
Spotting these triggers in a multi-timeframe setup gives us an edge, aligning short-term moves with the bigger trend. It’s all about stacking the odds in our favor. Want more insights like this? Check out my latest article on multi-timeframe strategies —it’s a game-changer! 📚
💬 Let’s Talk!
If this analysis helped you out, give it a quick boost—it means a lot! 😊 Got a pair or setup you want me to tackle next? Drop it in the comments, and I’ll get to it. Thanks for hanging out, and I’ll see you in the next one. Keep trading smart! ✌️

GOLD PLAN UPDATE 06/05/2025XAUUSD: Bullish momentum confirmed
Gold just printed a strong bullish D candle after days of retracement.
Price has broken H4 resistance zone — potential retest of previous ATH ahead.
✅ Still watching for new buy opportunities.

Gold: Multi-cycle Liquidity & The Silent ResetThe Grand-Scale Consolidation – The Market Reckoning
The exaggerated price hike has already priced in all major factors—interest rates, geopolitics, economic shifts, and institutional positioning. Fear drove the market upwards, but now, it’s time for a long-term balance that reflects real demand, not opportunistic hype.
Right now, gold demand is opportunistic. Wealthy investors and institutions jumped in early, securing "first come, first serve" pricing at the cheap side. But the over-inflated FOMO has pushed speculative pricing beyond its actual value.
Liquidity Trap at the Top—Now What?
Liquidity is locked in a high-stakes trap, forcing major players into a cycle of cashing out and recollecting liquidity pools to break even. The initial investment isn’t profitable unless liquidity gets redistributed.
Only big players can push price higher, but now they are risking their own liquidity—they underestimated retail traders, whose excitement keeps fueling the cycle.
The Grand Consolidation Range
This trick works on a global scale—economic policies, geopolitical moves, and institutional trade positioning are primed for consolidation. If price action confirms this range-bound phase, we could be looking at a multi-cycle balancing period before the market corrects to its true value.
Swing High : 3,403 - 3,500 – The extended liquidity trap zone where institutional players exit positions.
Swing Low : 3,215 - 3,134 / 2,970 – The deeper retracement zones where liquidity pools reset before the next expansion move.
Early Warning – The Consolidation is Setting Up
This isn’t just a minor retracement—this is the early warning of an extended consolidation phase, where liquidity must cycle multiple times before any true trend shift occurs. For traders, this means selling high and buying low, but only with near-term confirmation signals to avoid liquidity traps. Key areas to watch:
Volume shifts – Exhaustion vs continuation signs.
Price reactions at swing levels – Validating liquidity absorption.
Institutional positioning – Tracking big player activity in price action.
Speculation vs Reality – Time Will Tell
While the current market behavior signals consolidation, only time will confirm whether this phase will fully materialize. There’s no absolute certainty, but the conditions are aligning toward a grand-scale liquidity rotation that could define gold’s trajectory for the foreseeable future.
I’m putting this out there first—before the rest of the market catches on. Gold is primed for grand-scale consolidation, but as always, we shall see .

GOLD ROADMAP Impultse to Trade Within this Big CorrectionI think Down force its not done just yet, then, looks like its in Wave C a clear Impulse whithin the Correction so..
Selling level @ 3.400 Target 3.310
Buyin Level @ 3.310 Target 3.450 / 3.465
Selling Level 2 @ 3.450 / 3465 Target 3.165
GG!


XAUUSD Analysis: Make or break
Price is currently approaching a key Level.
Upside Scenario: If XAUUSD breaks above 3270 and holds, we may see a bullish move towards the 3310 target.
Downside Scenario: If price fails to break above and instead breaks below the trendline, it could trigger a downside move toward 3200.
Watch for confirmation before entering any position.

XauUsd bullish outlook✅ Reasons for Entry:
✅ Third Touch on H4 Extreme Trendline confirms clean anchor & rejection
✅ Strong RBS zone at 3235 — previously supported upward impulsive move
✅ Visible demand rejection wicks on H1 and M15 — signs of buyer defense
✅ Bullish market structure still intact on D1 (trend continuation bias)
✅ Extreme Trendline + Structure + Rejection = High-probability setup
Auto Generated by Custom Smart Trading Chart AI

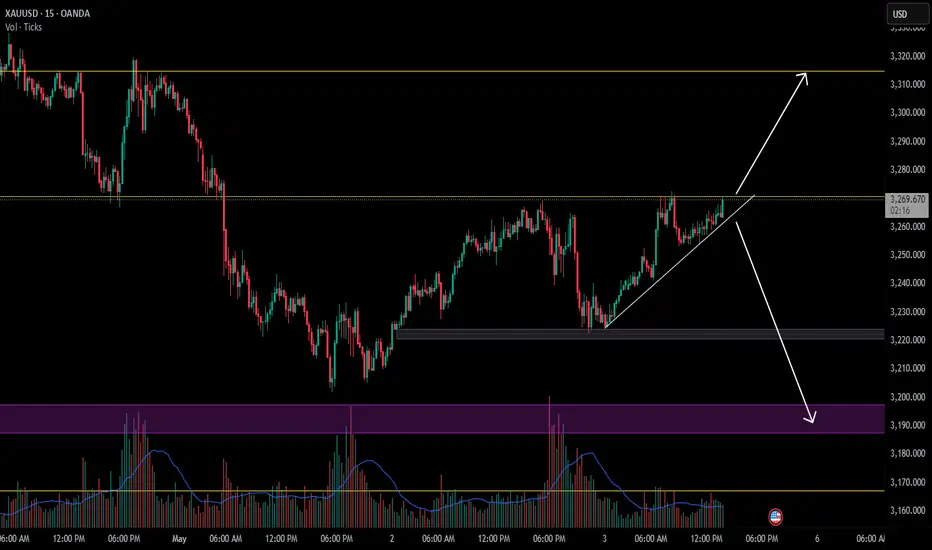
XAU/USD 4hAs usual, the market is ttracted toward either the support level or the target. It gravitates to one or the other. Once the first “orbit” is left, the price is attracted to the other. Here, we can see that the price remains under the influence of the support level, and the rejection of the bullish-target deviation (pale purple line) is clearly visible.
Since the downtrend is accompanied by strong volume (the blue dot candle), the bearish scenario prevails. The optimal point to enter a short position is at the bullish deviation (gray line), with a bearish target currently around 3,164.

Summary of the Gold Market This WeekThis week, the gold market showed a clear downward trend, with spot gold accumulating a 2.43% decline.👉👉👉
The economic data had a significant impact on the gold market this week. Data released by the US Department of Labor on the 2nd showed that the non - farm payroll employment in the US increased by 177,000 in April, much better than the expected 138,000, and the growth data for the previous two months were revised downwards. The US unemployment rate was 4.2% in April, in line with market expectations. The strong non - farm payroll data reduced the possibility of the Federal Reserve cutting interest rates in June. Under normal circumstances, the reduction in the interest rate hike expectation should be bullish for gold. However, the gold market did not rise sharply this time, mainly because the gold price had risen significantly in the early stage and the long - term investors had a strong sentiment of taking profits. At the same time, the relatively good employment data also reflected the resilience of the US economy to a certain extent, weakening the appeal of gold as a safe - haven asset. As a result, the gold price did not show an obvious upward trend immediately after the data was released. Instead, it remained volatile in the short term.
From a technical perspective, although the gold price has declined this week, the futures price still has certain technical advantages in the near term. On the daily chart, although a negative candlestick was recorded this week, the previous upward trend has made the moving average system still show a long - term arrangement. From the perspective of the RSI, the current value is hovering around 50, indicating that the market's long and short forces are temporarily relatively balanced, and neither side has an obvious advantage. Therefore, the gold price has entered a consolidation stage.
With the economic development in Asia and the changes in consumers' demand for gold investment and jewelry, Asia's influence in the global gold market has become increasingly prominent. If the demand in Asia remains strong in the future, it will provide strong support for the gold price. On the contrary, if the demand weakens, it may increase the downward pressure on the gold price.
Looking ahead to next week, the gold market still faces many uncertainties. On the one hand, the continuous changes in economic data and the direction of the Federal Reserve's monetary policy remain key factors. If the subsequently released data continue to show the resilience of the US economy, it may further reduce the market's expectation of a rate cut by the Federal Reserve, thereby suppressing the gold price. On the other hand, any new development in the international trade situation may trigger fluctuations in the market's risk - averse sentiment, thus affecting the supply - demand relationship and price trend of gold.

GOLD UNDER PRESSURE – Is a Massive Drop Coming?Gold (XAU/USD) has just tapped into a major supply zone around the $3,390 - $3,450 level and is showing signs of rejection with a sharp 1.16% drop.
Key Highlights:
Price: $3,391.220
Bearish Rejection observed at the supply zone (marked in blue), indicating potential downside.
Volume Profile shows heavy distribution in this zone, suggesting strong institutional selling.
First Major Support sits around $3,200, which aligns with historical structure and demand interest.
If broken, expect further decline towards $3,043, and possibly $2,626 in an extended correction.
What To Watch:
Red Arrows indicate possible drop zones if supply dominance continues.
Price needs to hold above $3,390 to regain bullish strength, otherwise, we’re looking at a correction.
Keep an eye on U.S. economic news (marked with flag) that could add volatility.
My Take:
We are in a potential distribution phase. If momentum fails to break above the current supply zone, gold could retrace deeply. The $3,200 level is critical — break it, and the bears will feast.
---
Like, share, and follow if you want more real-time technical breakdowns like this!
Drop your thoughts below — Is gold going back to $3,000? Or will the bulls surprise us again?

XAUUSD UP OR DOWN?My analysis outlines a common technical trading strategy based on order blocks and market structure shifts (MSS) in XAUUSD (gold vs USD). Here's a breakdown and a more structured interpretation of what you might be saying:
🟨 Technical Analysis Summary:
Order Block Identified at 3340.00 (1H Timeframe):
This is likely a bearish or bullish order block, where institutions previously placed large orders.
Price is expected to react at this level (likely resistance or support, depending on context).
Need to Observe Market Structure Shift (MSS) on Lower Timeframes:
You're waiting for a confirmation (e.g., a break of structure or BOS) on a 15M or 5M chart before entering a position.
This is a confirmation strategy to avoid false reactions.
Potential Retracement to 3260.00:
This may be a liquidity grab or the lowest point (swing low) before the next upward move.
Implies you're expecting a bullish reversal from that zone after an MSS.

0507 Watch out! Gold is cooling down for the news of..Hello traders,,
The resumption of china-us economic and trade talks is imminent, and the risk aversion in the gold market has cooled.
Gold stop rising and opened with a gap on Wednesday Asia morning !
On 4H chart, this strong bearish red candle is a strong reversal signal!
Looking for a new ABC swing trend for GOLD .
3267 is a recent breaking through level which now become a support for gold .
The next support would be 3202 where gold stop dropping since 1 day before NFP.
For a short-time 4H swing trader, could take a chance to follow this new swing down to those two levels.
GOOD LUCK!
LESS IS MORE!

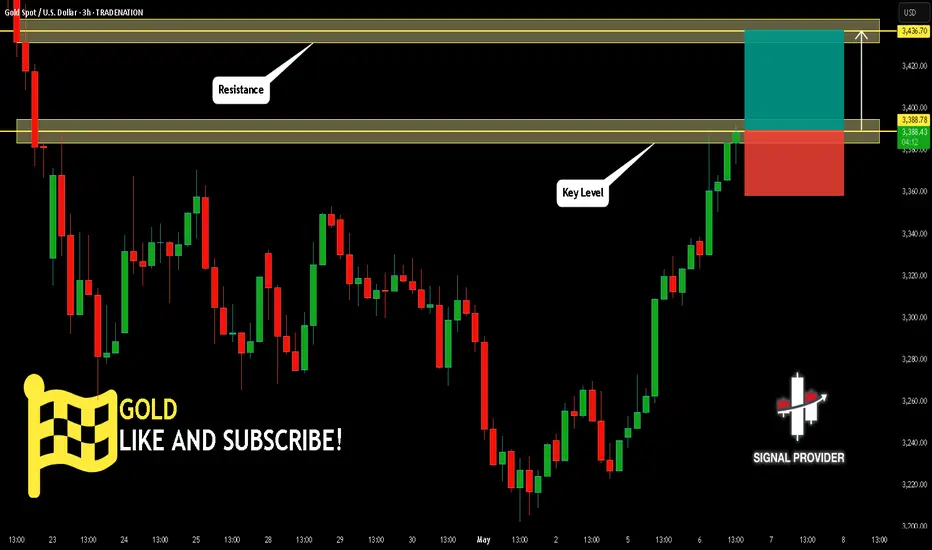
GOLD Will Go Up! Long!
Take a look at our analysis for GOLD.
Time Frame: 3h
Current Trend: Bullish
Sentiment: Oversold (based on 7-period RSI)
Forecast: Bullish
The market is testing a major horizontal structure 3,388.78.
Taking into consideration the structure & trend analysis, I believe that the market will reach 3,436.70 level soon.
P.S
The term oversold refers to a condition where an asset has traded lower in price and has the potential for a price bounce.
Overbought refers to market scenarios where the instrument is traded considerably higher than its fair value. Overvaluation is caused by market sentiments when there is positive news.
Disclosure: I am part of Trade Nation's Influencer program and receive a monthly fee for using their TradingView charts in my analysis.
Like and subscribe and comment my ideas if you enjoy them!
Swing Trading/XAUUSDband trading strategy points out. XAUUSD can be bought on the left side, TP3330-3350.
Aggressive traders can buy at the current price. Conservative traders can wait until the price retreats to around 3300 or below before buying.
The Swing Trading Strategy Center continues to announce trading opportunities. Stay tuned.

Gold (XAUUSD) - Bullish Breakout from Bearish Pennant | 4H ChartTechnical Analysis: On the 4-hour chart, Gold has completed a bullish breakout from a Bearish Pennant formation, defying its typical continuation pattern to the downside. This breakout is supported by a strong bullish candlestick close above both the pennant's upper boundary and the Ichimoku Cloud, indicating a potential trend reversal and shift in momentum.
Key Highlights:
Pattern: Bearish Pennant invalidated with bullish breakout.
Breakout Confirmation: Price closed above the upper resistance trendline and Ichimoku cloud.
Next Resistance Zone: Targeting 3,362 – 3,381 based on the measured move and price structure.
Support : Immediate support at 3,286 in case of a pullback.
Fundamental Context: Gold prices are rebounding amid renewed geopolitical concerns, weaker U.S. dollar performance, and increased central bank gold buying activity. This aligns with a short-term bullish narrative despite recent corrections. Any dovish signals from the Federal Reserve or weaker macroeconomic data could further fuel upward momentum.
Trend Outlook: Short-to-mid term trend is bullish following the breakout. Traders should look for bullish continuation signals and volume confirmation. A sustained move above 3,340 would further validate upside potential.
Must Support Me Share My Idea With Your Firends Mention Your Feed back Comment Section
Note: This is not financial advice. Please conduct your own research and manage risk accordingly.

Gold Pullback Incoming!Gold has struggled to break through its daily highs for the past week. I am looking for another push up to the $3360-$3370 range. If it fails to break that level again, we may see support levels around $3200 being retested. In my opinion, there is even potential for it to go lower. I'd love to hear your thoughts in the comments!
*Side note:* With the U.S. dollar falling in value and ongoing economic uncertainty, I believe gold has tremendous upside potential over the next 12-18 months. FX:XAUUSD

GOLD SELL ANALYSIS The $3266:$3267 sell zone for gold likely refers to a resistance level or a strategic price point where investors or traders are inclined to sell. Several factors could contribute to this sell zone:
- *Resistance Levels*: $3266:$3267 might be a key resistance area, where gold prices have historically faced selling pressure or struggled to break through.
- *Technical Analysis*: Traders may be using technical indicators, such as moving averages, Relative Strength Index (RSI), or Bollinger Bands, to identify $3266:$3267 as a selling opportunity.
- *Market Sentiment*: Shifts in market sentiment, driven by news, economic data, or geopolitical events, could lead to increased selling pressure around $3266:$3267.
- *Profit-Taking*: Investors might be looking to take profits at $3266:$3267, especially if they've seen significant gains in gold

From Tulips to Tech: The Evolution of Financial Bubbles 🎯 Introduction:
financial/economic bubbles are a recurring theme in economic history, this is often when a particular financial asset goes to unrealistic price levels often making money for early investors but usually these high price levels do not match their fundamental value this is then followed by a large public participation who also want a piece of the pie eventually with the price collapsing or sharply declining blowing or living investors in a large financial loss..
From 17th-century tulip gardens to 21st-century crypto manias, one thing has remained constant: Humans never learn.
Every generation thinks this time is different — but the pattern of bubbles keeps repeating.
Here's the crash course in 400 years of financial euphoria, panic, and pain.
🧠 Section 1: 1637 — Tulip Mania 🌷
The original bubble.
In the Netherlands, rare tulip bulbs were worth more than houses.
Prices exploded... then collapsed 90% in a matter of weeks.
Lesson: Speculation + FOMO is not new. Humans were flipping flowers before they flipped crypto.
Mini Nerd Tip:
"When people stop caring about value and only care about price rising, watch out."
🧠 Section 2: 1720 — South Sea Bubble 📜
Britain’s South Sea Company promised massive profits trading with South America (but barely did any business).
Politicians and aristocrats pumped the stock price.
Collapsed spectacularly → ruined many fortunes (including Isaac Newton himself:
"I can calculate the motion of heavenly bodies, but not the madness of men.")
Mini Nerd Tip:
"If a bubble needs government help to stay alive, it's already dying."
🧠 Section 3: 1929 — Wall Street Crash 🏛️
Roaring 20s: endless optimism, cheap margin loans, "stocks only go up!"
1929: Stock market crashed, triggering the Great Depression.
People were buying stocks with 10% down and gambling recklessly.
Mini Nerd Tip:
"When leverage is everywhere, the smallest panic causes waterfalls."
🧠 Section 4: 2000 — Dotcom Bubble 💻
Everyone thought the internet would change everything (it did — but slower and differently).
Companies with no profits were valued in billions.
"Eyeballs" were treated as real revenue.
NASDAQ lost 78% from top to bottom.
Mini Nerd Tip:
"Innovation creates real value... but hype inflates fake value faster."
🧠 Section 5: 2008 — Housing Bubble 🏡
Banks handed out mortgages to anyone.
Financial engineering (CDOs, synthetic MBS) created the illusion of safety.
US housing prices collapsed → global financial crisis.
"Too Big to Fail" became the famous phrase.
Mini Nerd Tip:
"If everyone is getting rich easily, someone is lying or blind."
🧠 Section 6: 2017/2021 — Crypto & Meme Stocks 🚀
Gamestop, Dogecoin, NFTs, Shiba Inu — the wildest "everyone’s a genius" market since the 1920s.
Social media + free apps = amplified bubble speed.
Massive rises, insane collapses.
Mini Nerd Tip:
"Technology changes, human emotion doesn’t."
🧠 Final Section: Why Bubbles Will Never End
Greed, fear, and FOMO are timeless.
Every era dresses up bubbles in new clothes (flowers, sea companies, internet, crypto).
Smart traders understand this pattern — and use it to survive and thrive.
"**Bubbles don't pop because of bad assets. They pop because confidence disappears
put together by : Pako Phutietsile as @currencynerd
courtesy of : @TradingView

Gold 1H Outlook - XAUUSD May 4th 2025🔥 XAUUSD – H1 Outlook | May 4, 2025
Bias: ⚠ Short-term neutral to bearish — price reacting from a weak CHoCH + premium rejection.
Flow: Intraday trapped between 3240 demand and 3280–3300 supply. Next move decides the breakout.
🔎 Market Structure:
❗ Clean CHoCH + BOS sequence from 3285 → confirms bearish LTF momentum
🟠 Current HL attempt rejected off imbalance around 3268–3275
🔹 Structure still building under H4 LH (3315), supply remains in control unless flipped
🗝 Key H1 Levels (with confluence):
🔵 3233–3244 → Micro OB + FVG Support
🔄 Key short-term HL zone
⚡ RSI oversold bounce last touch
EMA5/21 zone → bounce risk
🟡 3268–3275 → FVG + OB + Last CHoCH Zone
🚩 This is the first sell POI
💧 Liquidity just above (equal highs)
Ideal for LTF short scalp if price rejects again
🔺 3288–3302 → H1–H4 Confluence Supply
🔥 Strong bearish OB + liquidity sweep area
🧱 Reaction zone for swing shorts (supply locked)
Confluence with premium fib retracement
🔻 3190–3200 → Extreme Demand Zone
🧲 Weak low + imbalance + discount OB
🔑 Watch for possible NY reversal trap if price collapses
💡 Plan:
We’re in the battlefield between weak HLs and greedy supply zones.
If 3275 rejects again → scalp sells back to 3240.
If 3240 fails → 3200 could be the "trap long" to flip everything.
🧠 Final Note:
Patience beats precision. Let the chart show its cards — no need to guess when liquidity does the talking.
🙏 Like this breakdown? Boost and follow us for sniper setups all week.
📌 Important Notice!!!
The above analysis is for educational purposes only and does not constitute financial advice. Always compare with your plan and wait for confirmation before taking action.
#XAUUSD #GoldOutlook #SMC #LiquidityHunt #SmartMoneyFlow

Gold weekly outlookUsing Fibs and regression trend channel, we should see a continuation to the downside with a possible buy in the fibs buy zone potentially rising towards the sell zone.
