Continues Bullish TrendStill focus on buy for gold and possibly retest previous ATH or creating a new ATH from current lvl price 3400<>
GOLD.PRO.OTMS trade ideas

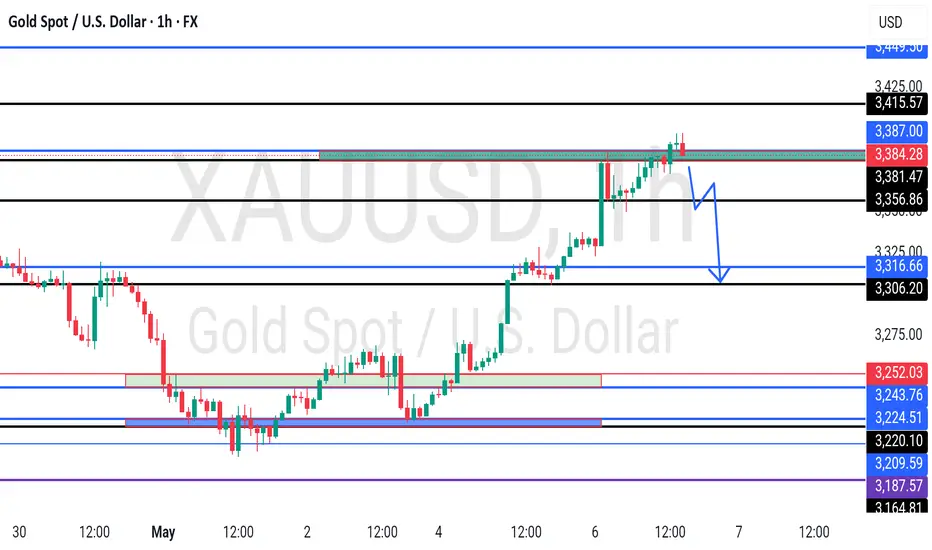
GOLD - Sell Setup📉 GOLD - Sell Setup
🔹 Date: 07 May 2025
🔹 Pattern: Double Top + Break of Trendline
🔹 Entry Zone: 3387 - 3397 (Strong Resistance Rejection)
🔹 Confirmation: Clear rejection from previous supply area (highlighted in red), with break below ascending trendline.
🔹 Target 1: 3350
🔹 Target 2: 3337
🔹 Stop Loss: Above 3400
🔹 Risk/Reward: Solid setup with favorable RRR.

Gold. Long-term Elliott Wave Structure.I'm showing this beautiful weekly chart since 1971 when president Richard Nixon ended the international convertibility of the US dollar to gold. The path followed by gold since that time, is a text-book Elliott wave structure where long term wave 3 has ended. Wave 4 resides at 900 dollars per ounce.


Gold bides its time. Bulls are suppressed at high levels?
Gold is waiting for the Fed's interest rate decision.
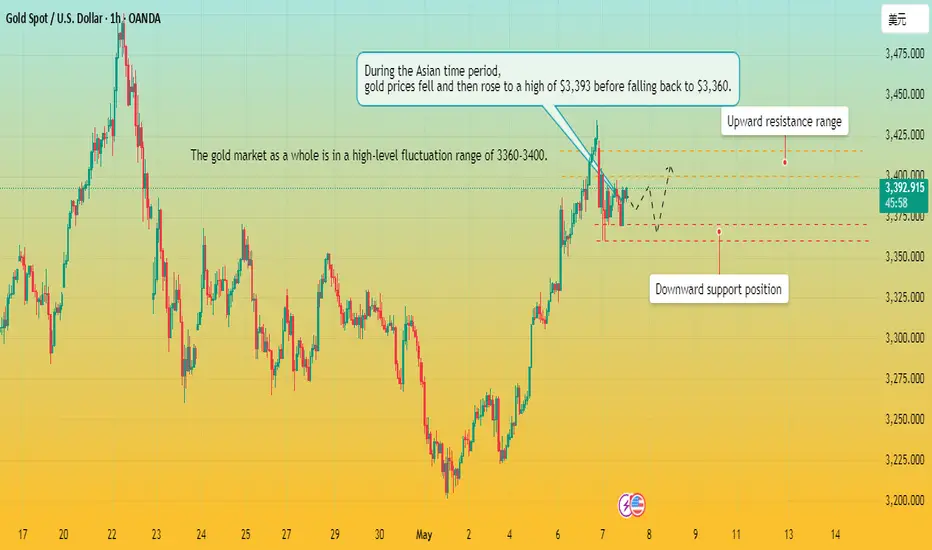
analysis in Asian time period:
Gold opened with a sharp drop due to international news, and continued to fluctuate at a high level in the 3360-3400 range predicted by Quaid. I predicted in the early Asian session that the price of gold would rise to around 3390 and then fall back to around 3370-3360. And its trend is just as Quaid predicted and analyzed, with a correction after the predicted high point.
Now it seems that gold has fallen into a high-level fluctuation range after a sharp drop in the early Asian session, which is in line with my expectations. Quaid believes that the trend direction of the European session is very important. The current upward suppression range is between 3400-3415, and the downward support level is between 3360-3370;
On the contrary, if the European session falls below the downward support range, it may continue to fall.
But Quaid believes that the overall upward trend of gold prices has not changed. Gold prices are just accumulating strength now, and will continue to rise after the adjustment.
Overall trend analysis:
Quaid recommends that the long strategy is still the main one. If the support range of 3360-3370 can resist the downward trend, then we can still carry out the long strategy after the price falls back.
Operation strategy:
Long strategy: Go long when the price falls back to 3365, stop loss 3350, take profit range 3400-3415.
Short strategy: Go short at 3395, stop loss 3405, take profit 3360.
XAUUSD bounce?Hello traders, this is a complete multiple timeframe analysis of this pair. We see could find significant trading opportunities as per analysis upon price action confirmation we may take this trade. Smash the like button if you find value in this analysis and drop a comment if you have any questions or let me know which pair to cover in my next analysis.

Still in upside channel H1 & H4 updated
Market still in the parallel channel
What possible scenario we have?
Bearish scenario:
-if h4 remains below 3375 stay bearish side and target will have 3330- 3290
Bullish scenario:
-if market able surpass 3385 and (candle closes above)then buying up to 3430 and 3445
Key area:
-3385 (above bullish)
-3370-3375( Below bearish)

xabcd on gold
After the strong move bullish on 6 may yesterday
gold is obviously move to D point based on XABCD pattern
in my oppinion for this day gold will be bearish.
i might be trade for intra just to make sure my strategies.
Target for XAUUSD ; 3.328

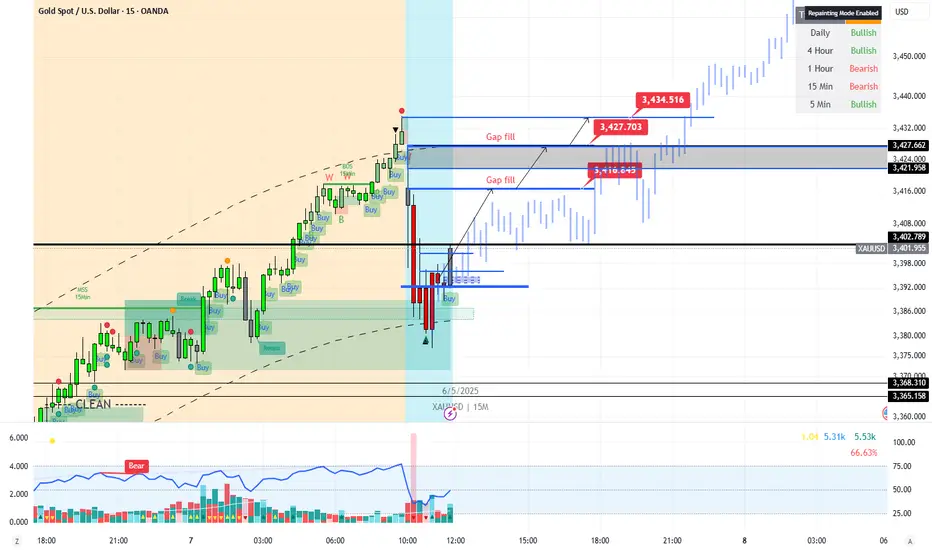
XAUUSD - Buy - A Shape Recovery - Gap fill - Strength
A Shape Recovery
Return to Previous Level imminent
Profit taking at NZ open from the massive run-up yesterday.
COT data didn’t show any buying of longs on Monday It could have driven down lower, but instead, they drove it up.
First, it should fill the gap, then continue on to 4,000… then 7,000 over time, of course.
The USA is still in hot water — Trump has ruffled a lot of feathers.
No one trusts him, no one likes him — a snake in the grass.
China is hunkering down until he’s gone.
Xi Jinping will not tolerate Trump’s snide remarks or his constant demeaning of him and China.
So, the USD will likely face 145% tariffs for quite some time.
It’s the perfect tool to help destroy Americas economy and they did it to themselves.
Weak Dollar. Strong Gold.
"China has stated it will not engage until the U.S. cancels its 145% tariffs, a condition the U.S. has not met. Despite hints of openness from both sides and China evaluating U.S. approaches, no formal agreement has been confirmed, and conflicting statements suggest the situation remains fluid. The lack of a signed deal, combined with China’s retaliatory 125% tariffs and its focus on diversifying trade partners, casts doubt on an imminent resolution"
Gold price breaks through 3400. Bulls take control?Gold price breaks through the 3400 resistance level I predicted. And there is a trend of continuous rise.
Next, Quaid will comprehensively analyze the current market situation for all traders.
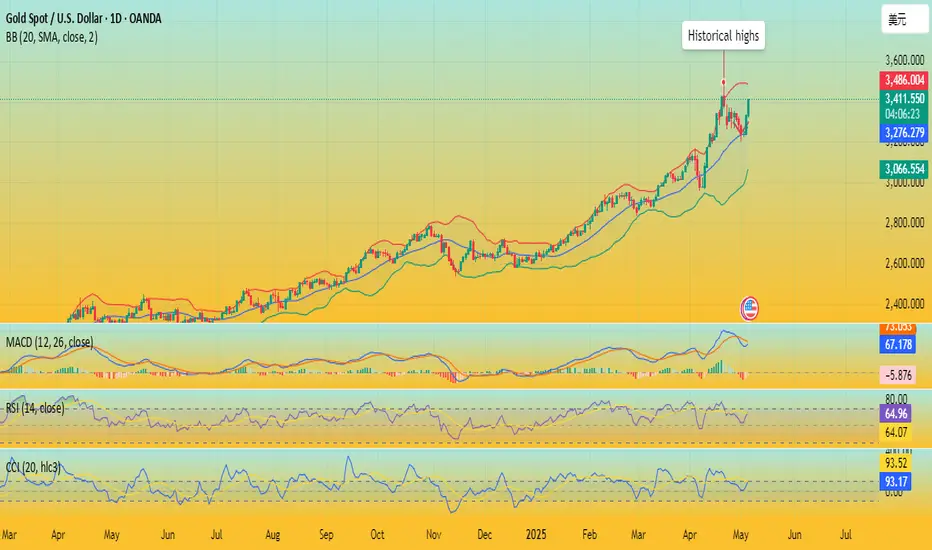
Technical analysis:
From the daily chart, the gold price has broken through the important resistance level and formed a strong upward trend. Currently trading above $3400, it has successfully broken through the key resistance range of $3385-3400. The Bollinger Band indicator shows that the middle track is at 3231.01, the upper track is at 3485.06, and the lower track is at 2976.97, indicating that the current price is near the upper track of the Bollinger Band, showing strong upward momentum.
The RSI indicator shows that the current value is 64.8, which is in the neutral to strong area, and has not yet reached the overbought level, and there is still room for growth.
Quaid believes that in the short term, if gold stabilizes above $3,400, it may hit $3,430-3,450. Once it breaks through, it will open up the possibility of a higher price.
Market sentiment observation:
The current market sentiment is clearly biased towards risk aversion, and global geopolitical tensions have become the main driving force for gold to rise. The continued tension of geopolitical conflicts and political uncertainty in Germany have prompted market participants to seek safe assets. At the same time, expectations for the Fed's future monetary policy shift are also increasing. Although the possibility of a rate cut in May is extremely low, the probability of a rate cut in the June meeting is close to 30%.
Liquidity indicators show that the trading activity in the gold market has increased and institutional funds continue to flow in, indicating that bullish sentiment in the market has the upper hand in the short term. Technical indicators have not shown obvious overbought signals, which means that the current rally still has room to continue. Compared with other asset classes, gold's relative strength is outstanding, especially in the context of the possible challenges to the status of the US dollar as a safe haven asset.
Outlook for the future
In the short term: Gold prices may continue to rise to test the $3,400-3,500 area. The Fed's decision will be a key trigger for gold prices in the near term. If the Fed shows a dovish attitude, gold prices are expected to further break through historical highs.
Medium term: Global geopolitical uncertainty is expected to continue to support gold prices. If geopolitical conflicts escalate further or the situation in the Middle East deteriorates, safe-haven demand may push gold prices to hit the $3,600 level. At the same time, market expectations of a shift in the Fed's monetary policy will be another key factor affecting gold prices.
Long term: From a macro perspective, the current combination of slowing global economic growth and geopolitical tensions will continue to provide support for gold.
GOLD- alternate scnerios, what's next??#GOLD.. market behave volume drop above 3387
So again our area is 3381-87
And we will go for CUT n reverse below
Good luck
Trade wisely
Gold Eyes $3,418 as Bullish Channel Holds Gold (XAUUSD) Analysis – May 6, 2025
📈 Technical Outlook: Gold Eyes $3,418 as Bullish Channel Holds
Gold continues to trade within a rising channel on the 30-minute chart, with price currently near the mid-range around $3,373.
Two likely scenarios:
Bullish breakout toward $3,418 if minor resistance fails.
Or a healthy pullback to $3,360–$3,345 support zone before resuming upward.
Support levels: $3,370 (minor), $3,345 (strong).
Resistance: $3,418, a key decision zone at the channel top.
Short-term bias: Bullish, unless the price breaks and closes below $3,345.
🔍 Headline: “Gold Holds Above Key Support, Eyes Fresh Highs Toward $3,418 Within Bullish Channel”
🌍 Fundamental Outlook: Gold Supported by Fed Dovishness & Geopolitical Tensions
Fed Policy Watch: Traders anticipate potential rate cuts later in 2025. Any dovish commentary this week will boost gold.
U.S. Dollar Pressure: A softening dollar adds tailwind to gold prices.
Bond Yields: Moderating U.S. Treasury yields reduce gold’s opportunity cost.
Safe Haven Demand: Ongoing tensions in Ukraine, Middle East, and uncertainty in global equities maintain demand for gold.
Central Bank Buying: Continued accumulation by central banks (e.g., China) lends structural support.

GOLD PLAN UPDATE 06/05/2025 - 2PM UTC• Gold surges to $3,38x/oz on dovish Fed bets, geopolitical risks, and safe-haven demand.
• Fed pivot hopes fuel upside as weak data boosts rate cut odds.
• U.S.-China trade tensions and Middle East unrest lift safe-haven flows.
• Weaker USD adds support; central banks continue strong buying.
• Growth and inflation fears keep gold bid.
🎯 Key Levels:
• Resistance: $3,400–$3,420
• Support: $3,300–$3,310
🟢 Buy Zone 1: $3,355–$3,360
- SL: $3,350
- TP: $3,380–$3,385
🟢 Buy Zone 2: $3,300–$3,320–$3,330–$3,340
- SL: $3,320–$3,280
- TP: $3,390–$3,400–$3,450–$3,500
🔴 Sell Zone 1: $3,395–$3,400–$3,410
- SL: $3,405–$3,420
- TP: $3,370–$3,365–$3,350–$3,340
🔴 Sell Zone 2: <$3,300
- SL: $3,320
- TP: $3,250–$3,200
• Use tight stop-losses tailored to timeframe (5–10 prices for scalping; 20–30 for intraday/swing).
• Limit risk per trade to 1–2% of account equity.
• Stay alert to real-time Fed commentary, tariff news, and geopolitical headlines for sudden volatility spikes.

XAUUSD – The Setup’s Already BreathingFlipped to the 15M so they don’t see the precision… but this is 5M business.
IDM below that HH is baiting price back in—liquidity needs to get swept.
Once the zone’s kissed, I’m hunting the micro LH to get smoked.
The move’s already loaded… just waiting on the trigger.
They watching. I’m waiting. That’s the difference.
Bless Trading!

Daily Analysis- XAUUSD (Tuesday, 6th May 2024)Bias: Bullish
USD News(Red Folder):
-None
Analysis:
-Strong bullish momentum
-Looking for price to reach 0.618 fib level
-Potential BUY if there's confirmation on lower timeframe
-Pivot point: 3300
Disclaimer:
This analysis is from a personal point of view, always conduct on your own research before making any trading decisions as the analysis do not guarantee complete accuracy.

Gold Price ActionHello traders! This is almost same setup or pattern as BTCUSD
If you look closely at the left side of the chart, you’ll notice multiple rejections from the same zone — forming a head-and-shoulders-style distribution. This area has now become a strong supply zone.
📌 What to Expect:
This is a high-probability short setup. If price taps into the supply zone again, it could trigger a strong move down, especially with liquidity already swept.

Gold technical analysis, May 5-6📊Today, gold once again showed strong performance, rising rapidly during the session, breaking through the previous shock consolidation range, and basically no obvious correction, directly rising to the expected first target of 3310, and the strong market fulfilled the risk aversion expectations. However, it should be noted that once the risk aversion sentiment is released in the short term, the market is often accompanied by a rapid decline after the surge, so it is not suitable to blindly chase the rise at this stage.
📊The 1-hour moving average system began to turn, indicating that the short-term bullish momentum has weakened;
🔰The current price is approaching the previous strong resistance area (3328-3330), which is an important starting point for the previous round of decline;
🔰From the perspective of the fluctuation rhythm, this round of rise has basically not made a decent retracement, so the bulls are already in a high-risk range;
🔰Before there is an effective consolidation or retracement confirmation, the risk of chasing more is high, and the short-term is more inclined to a correction.
🔴Upper resistance: 3328-3330, if this area is repeatedly blocked, you can try to intervene with short orders;
🟢Lower support: 3260-3252, if it pulls back to this area and stops falling and stabilizes, you can consider participating in long orders.
✅If the gold price continues to be under pressure in the 3325-3330 range during the U.S. market, short orders can be placed first, with the target looking at the 3270-3260 area, and the stop loss is recommended to be set above 3335; if there is a rapid retracement and cannot break 3252, you can still consider going long in the future to win a new round of rise.
✅The short-term rhythm of gold is fast, and it is greatly affected by the news. The market may have a unilateral trend of "breaking through but not falling back". Therefore, it is necessary to make flexible adjustments according to the actual strength of the market, and do not blindly chase the rise or fall.

XAU/USD "The Gold" Metal Market Heist Plan (Day Trade)🌟Hi! Hola! Ola! Bonjour! Hallo! Marhaba!🌟
Dear Money Makers & Robbers, 🤑💰✈️
Based on 🔥Thief Trading style technical and fundamental analysis🔥, here is our master plan to heist the XAU/USD "The Gold" Metal Market. Please adhere to the strategy I've outlined in the chart, which emphasizes short entry. Our aim is the high-risk GREEN MA Zone. Risky level, oversold market, consolidation, trend reversal, trap at the level where traders and bullish robbers are stronger. 🏆💸"Take profit and treat yourself, traders. You deserve it!💪🏆🎉
Entry 📈 : "The heist is on! Wait for the Neutral Level breakout then make your move at (3260.00) - Bearish profits await!"
however I advise to Place sell stop orders above the Moving average (or) after the Support level Place sell limit orders within a 15 (or) 30 minute timeframe most NEAREST (or) SWING low or high level for Pullback entries.
📌I strongly advise you to set an "alert (Alarm)" on your chart so you can see when the breakout entry occurs.
Stop Loss 🛑: "🔊 Yo, listen up! 🗣️ If you're lookin' to get in on a sell stop order, don't even think about settin' that stop loss till after the breakout 🚀. You feel me? Now, if you're smart, you'll place that stop loss where I told you to 📍, but if you're a rebel, you can put it wherever you like 🤪 - just don't say I didn't warn you ⚠️. You're playin' with fire 🔥, and it's your risk, not mine 👊."
📌Thief SL placed at the nearest/swing High or Low level Using the 3H timeframe (3360.00) Day/Scalping trade basis.
📌SL is based on your risk of the trade, lot size and how many multiple orders you have to take.
Target 🎯: 3170.00 (or) Escape Before the Target
💰💵💸XAU/USD "The Gold" Metal Market Heist Plan (Scalping/Day Trade) is currently experiencing a Bearish trend.., driven by several key factors.👇👇👇
⚠️Trading Alert : News Releases and Position Management 📰 🗞️ 🚫🚏
As a reminder, news releases can have a significant impact on market prices and volatility. To minimize potential losses and protect your running positions,
we recommend the following:
Avoid taking new trades during news releases
Use trailing stop-loss orders to protect your running positions and lock in profits
💖Supporting our robbery plan 💥Hit the Boost Button💥 will enable us to effortlessly make and steal money 💰💵. Boost the strength of our robbery team. Every day in this market make money with ease by using the Thief Trading Style.🏆💪🤝❤️🎉🚀
I'll see you soon with another heist plan, so stay tuned 🤑🐱👤🤗🤩

Will gold rise or fall this week?Last Friday's non-agricultural data had little impact on the market, and gold is still fluctuating around the range. At present, the gold moving average crosses downward in a short position, and is now under pressure from the 3270 line. 3270 is the turning point for gold bulls and bears. The rise in gold will not be easily reversed for the time being unless there is a big news impact.

Let's wait for gold to break new highs
Today, the price of gold bottomed out and rebounded, breaking through the expected dividing point of 3260.
At this time, many traders need to learn to adjust their thinking.
If it is a retracement, on the one hand, the price will not break through and open a decline, and on the other hand, after the force is too strong, it must be a position adjustment and a reverse long.
Even if you don’t go long, you can’t go short easily. In many cases, the rules of trading must be followed.
The second rise from the low point to the high point just corrected the 382 support 3252 and continued to rise and break the high. It depends on whether you have the courage to enter the market.
The intraday increase of 80 US dollars +, today there is only one idea, continue to go long;
The support level refers to 3210 and 3215, you can go long in batches, with 3290 as defense, and continue to watch the gold price break high!
After the strength, there will be a second high point!
Thank you dear traders for reading, if you like it, please tell me

XAUUSD: Mayali Signals - Premium Insighthe market surged like a tidal wave—swift, unexpected, and bold. But every wave eventually pulls back.
At $3,312, our system triggered a high-conviction SELL, backed by three signals; Overextension beyond psychological barrier $3,310, Exhaustion candlestick with low follow-through, and Divergence from momentum indicators on the 1H frame.

My Recent Long Trade on XAUUSD | Bullish Crab Pattern
Weekly:: Price was reacting from the weekly key level of rejection block(wick)
Set Up: Bullish Crab Pattern on H1, the d-leg PRZ aligns with the weekly key level of rejection block. so bc projection of the d leg of 1.618 was fully tested and confirmed.
ENTRY: Entry was on H1 support after M15 CHOCH. Supply to Deman Flip entry model can also work here. sniper entry at H1 support.
H1 support entry, (sniper)
TP1 AT 0.382 WAS ACHIEVED ( Trade mgt, moved sl to breakeven)
TP2 AND TP3 WAS HIT AT 0.618 AD 0.786 Respectively.
that was how we made 1:7.4 R:R on Gold.
Hope you got value from this analysis. chat soon guys and drop your comments below.

XAUUSD - Gold Trend Before FOMC!Gold is trading above its EMA200 and EMA50 on the 4-hour timeframe and is trading on its uptrend line. A continued upward move in gold will put it in the supply zone, where it is possible to look for short positions. A downward correction in gold will also open up long positions.
Gold traders endured another turbulent week, marked by the second consecutive decline in prices—once again underscoring the market’s acute sensitivity to economic news and developments.
Adrian Day, CEO of Adrian Day Asset Management, offered a cautiously humorous take on the situation by likening it to the Peggy Lee song that asks, “Is that all there is?” He pointed out that gold has pulled back by over 7% from its recent high in less than two weeks.Although this correction is notable, it hasn’t been deep enough to flush out all short-term traders or weak-handed investors from the market.
Day added that rising fears of a U.S. recession—which typically exert early downward pressure on gold—alongside the possibility of easing U.S.-China trade tensions, may limit investment demand for gold in the short term. Concluding his comments, he maintained a cautious stance, saying that further downside remains likely and that his outlook for the coming week is bearish.
Meanwhile, U.S. President Donald Trump, in a new interview with NBC, addressed several key economic and political issues. He stated that if necessary, the deadline for selling TikTok would be extended, and some tariffs on Chinese goods might become permanent. Nevertheless, he indicated that he is also considering reducing certain tariffs in the future.
Trump emphasized that small businesses do not require additional assistance and that the Federal Reserve should cut interest rates. He confirmed that Jerome Powell will remain Fed Chair through the end of his term in 2026. He also mentioned potential successors for his own position, naming Vance and Rubio as possibilities.
After a week dominated by employment data, the upcoming week will be entirely focused on monetary policy. The centerpiece will be the May FOMC meeting, the Fed’s rate decision, and Jerome Powell’s press conference on Wednesday. While markets broadly expect the Fed to hold rates steady, Powell’s official remarks and answers to press questions—especially following his sharp tone earlier in April—will be under close scrutiny.
It is widely expected that the Federal Reserve will leave its key interest rate unchanged on Wednesday, as policymakers assess how President Trump’s tariffs gradually impact various sectors of the economy. Markets are currently pricing in a potential rate cut starting in July. The Fed’s dual mandate is to maintain low inflation and high employment, and it may face a dilemma if tariffs negatively affect both indicators, as many economists now warn.
Immediately following the Fed meeting, senior policymakers including Barr, Kugler, Waller, and Cook will travel to Iceland to attend the Reykjavik Economic Conference. On Friday, they will participate in panels discussing artificial intelligence, labor market trends, and monetary research—topics that could offer insights into the Fed’s long-term policy direction.
Simultaneously, traders are also awaiting two key reports: the ISM Services Index for May, due today, and weekly jobless claims figures set for release on Thursday. Together, these reports will help complete the picture of the U.S. economy as critical monetary policy decisions approach.
