Technical Breakdown on Gold Spot / USD (XAU/USD) | 1H TimeframeHere's a detailed technical breakdown of the Gold Spot / USD (XAU/USD), 1H timeframe chart using Volume Profile, Cumulative Volume Delta (CVD), and ADX:
1. Key Observations (Volume, Gann & CVD + ADX Focused)
a) Volume Profile Insights:
Value Area High (VAH): 3395.88
Value Area Low (VAL): 3311.18
Point of Control (POC): 3381.67 (recent) / 3311.18 (previous)
High-volume nodes: Concentrated around 3380–3390 and earlier at 3300–3320, suggesting strong buyer interest.
Low-volume gaps: Between 3350–3370, indicating weak resistance and potential for swift price movement.
b) Liquidity Zones:
Stop Clusters: Around 3400 (recent swing high), and 3310 (swing low/POC) — potential liquidity sweep zones.
Order Absorption: Strong delta buildup near 3380–3390 indicates heavy buying pressure and potential large-position accumulation.
c) Volume-Based Swing Highs/Lows:
Swing High (Volume Spike): 3395.88 – recent high with strong breakout volume.
Swing Low (Volume Spike): 3311.18 – confirmed reversal point with heavy absorption.
d) CVD + ADX Indicator Analysis:
Trend Direction: Uptrend (confirmed by multiple bullish CVD bars and higher highs).
ADX Strength: ADX > 20 with DI+ > DI- ⇒ Confirmed uptrend.
CVD Confirmation: Rising CVD with bullish price action = Strong demand confirmation. Market is led by aggressive buyers.
2. Support & Resistance Levels
a) Volume-Based Levels:
Support:
VAL: 3311.18
POC: 3381.67
Swing Low with Absorption: 3310
Resistance:
VAH: 3395.88
Swing High: 3400–3410 zone
b) Gann-Based Levels:
Gann Swing Low: 3311
Gann Swing High: 3395
Key Retracements (From 3311 to 3395):
1/2 level: 3353
1/3 level: 3339
2/3 level: 3367
3. Chart Patterns & Market Structure
a) Trend: Bullish
Supported by rising price structure, channel breakout, and rising CVD.
b) Notable Patterns:
Bullish channel forming (highlighted in purple).
Breakout above previous consolidation range (POC breakout).
Retest of POC at 3381.67 acting as support now.
4. Trade Setup & Risk Management
a) Bullish Entry (Confirmed by CVD + ADX):
Entry Zone: 3381–3385 (retest of POC/support).
Targets:
T1: 3410
T2: 3440
Stop-Loss (SL): Below swing low at 3350
RR: Minimum 1:2
b) Bearish Entry (Wait for breakdown of trend):
Entry Zone: 3310 (if price breaks below support).
Target:
T1: 3275
Stop-Loss (SL): Above 3350 (last high-volume rejection)
RR: Minimum 1:2
c) Position Sizing: Risk only 1–2% of capital per trade.
GOLD.PRO.OTMS trade ideas

XAUUSD SHORT/SELL 1:4Are we ready for the drop?
1.Break of structure
2.Expanding flat formed
3. Engulfing candle in the 4 HR Timeframe
4. a, b, c correction needed for complete structure
5. FVG formed with the 4HR bearish candle needs to close
Entry:3407
Stop loss:3459
Take Profit:3186

XAUUSD: Strong Bullish (Intraday & Swing)Gold closed Friday with indecision, rejecting both 3230.00 and 3274.00 as NFP remained muted. That led to an explosive 936 pip candle yesterday, ripping straight through 3274.00 and closing just shy of the major 3333.00 level.
Today, price has already pushed 400 pips higher and is currently hovering around 3365 on the 4H chart.
Key Buy Setups:
Break above 3380 → Target 3428
Pullback & successful retest of 3333 as support → Target 3428
Pip Range Opportunity:
500 – 900 pips depending on the entry
Summary: Bullish bias remains intact on all timeframes. I’m watching for a clean break of 3380 to ride the next leg up, or a healthy pullback to 3333 before continuation.

XAUUSD – Calm Before the LaunchMarked this IDM sitting under the HH with clean structure flowing bullish on 4H and 30M.
Flipped to the 2H for a smooth Bird’s Eye view—just watching now, waiting for that sweep and micro shift to load up.
The market’s breathing, building up energy. Once it taps in and confirms, it’s game time.
Let the liquidity do the work. I’ll handle the entry.
Bless Trading!

Gold is rising strongly. What is the reason?Analysis of today's market in Asian session:
Last week, the price of gold rebounded to above 3240, the lows were constantly rising, and the highs were broken; such a rebound is tempting traders to short.
In the morning of Asian session, the price of gold rose rapidly from 3320 to 3385 US dollars. In just two days, the price of gold recovered the decline during the Asian holiday. In the current market situation, it is not far away to rush back to the high point. The key to the price increase in the morning of Asian session may also support the European session and the US session. You can use a long strategy during this period.
However, you must pay attention to the continuity of the gold price. If there is an attack in the market transaction, there must be a defense; the downward or upward resistance level must be clear after the breakthrough position, how to operate to maximize the benefits and minimize the losses.
Quaid believes that if gold pulls back, its support point needs to focus on the 3340-3350 range, and the defense position is 3320; the position of the Asian morning rise should be paid attention to. If it falls below this position, you need to adjust the strategy in time.
Quaid believes that the upward trend is currently focused on $3380-3400.
GOLD - Bullish - Fundamentals safe haven for inflationary times.The trend is long on the weekly, daily, and 4hr charts.
-Dly 21 held as support.
-Fundamentals - USD inflation may increase. Gold is a haven when or if risk-off occurs.
-Look to buy at Tokyo from the 1st area, then if we fail to make a HH, then price may make a deeper pullback to the 2nd area that I have indicated.
Targets are calculated using Fibonacci extensions depending on where price holds and extends from.
This is just what I am doing and not financial advice!

GOLD Update - One More Javpot Trade . We Have planned a Gold Trade In Previous Post . Gold Trading At 3200 at that Time .
Now Gold Blasting Current Price is 3313 . We Are Expecting a All Time High In Gold .
Hope You Have Taken a advantage . Keep Rocking

How to plan when gold’s rise encounters resistance🗞News side:
1. Pay attention to the recent trade situation and news about the Fed's interest rate cuts
2. Be wary of DXY trends
3. The situation of the Russian-Ukrainian war and the follow-up events of the India-Pakistan conflict
4.Trump imposes 100% tariff on non-US films
📈Technical aspects:
Compared with today's market, the morning rise happened to be a sideways price, breaking through the previous high point. In a volatile rise, it doesn't matter. It is very likely that in the later trend, the price will return to the starting point or even lower, but it can continue to rise. This is a feature of the shock. At the same time, the current market is not extremely strong, and it is still in a volatile rise. Therefore, do not chase long, but retrace as much support as possible.
🎁SELL 3315-3325
🎁TP 3280-3270
🎁BUY 3270-3280
🎁TP 3300-3310
If you agree with this point of view, or you have a better idea, please leave a message in the comment area. I look forward to hearing different voices.
OANDA:XAUUSD FX:XAUUSD FXOPEN:XAUUSD FOREXCOM:XAUUSD TVC:GOLD

Gold mostly bearishGold mostly bearish with 2 possible scenarios can play out. Wait for break of 15min TL to sell of break of 61 to buy. wait for your confirmation candles at key points as always.

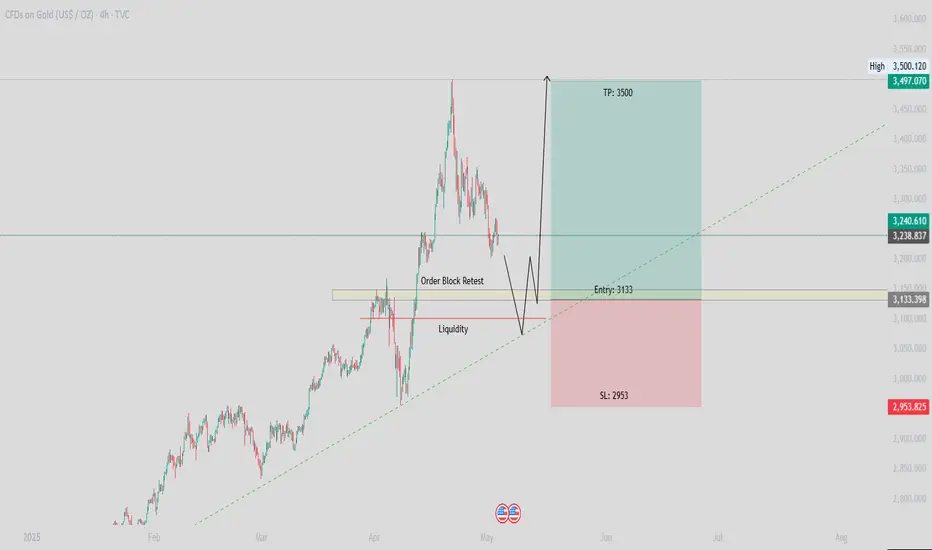
Gold Long Setup - Manipulation Before AccumulationAfter an exceptional rally towards the highs, Gold will be retracing to retest the order blocks, trendline and sweep liquidity of the local lows. I will be looking at longing Gold at 3133 area upon internal liquidity sweep, trendline and order block retest.
Entry: 3133
Target: 3500
Stoploss: 2953
XAUUSD swing Analysis XAUUSD took support from support line,
All long targets are achieved.
this month taking rejection from major resistence,
Let's track the moves to down.
follow for more swing analysis on INDICES - CURRENCY - COMMODITIES

XAUUSD VIEW FOR UPCOMING WEEK Is the gold going to fall again as PW bearish and showing no strength to down side?


Gold (XAU/USD) – Technical & Fundamental AnalysisGold (XAU/USD) – Technical & Fundamental Analysis
🔹 Technical Analysis
Current Price: $3,240.39
Trend Context: Gold remains in a broad ascending channel, with price action currently consolidating below all-time highs (ATH). The structure remains bullish unless key support levels are decisively broken.
Key Technical Levels:
Resistance Zones:
$3,339 – Monthly resistance zone
$3,500 – Psychological round number
$3,608 – All-Time High (ATH) extension zone
Support Zones:
$3,197 – Daily trendline support
$2,957 – Monthly support and key demand zone
Price Scenarios:
Bullish Scenario (Green Path):
A successful hold above $3,197 and a break above $3,339 would likely trigger a retest of $3,500, with potential for continuation toward $3,608, supported by macro fundamentals.
Bearish Scenario (Red Path):
A break below $3,197 may lead to further downside toward the $3,000–$2,957 zone. Failure to hold that support could signal a deeper corrective phase within the broader uptrend.
🔹 Fundamental Analysis
1. U.S. Monetary Policy:
Expectations of interest rate cuts by the Federal Reserve in late 2025 continue to support gold prices, as lower rates reduce the opportunity cost of holding non-yielding assets like gold.
2. Inflation & Economic Outlook:
Persistently elevated inflation and concerns of a potential economic slowdown or recession are keeping investor interest in gold high as a hedge against uncertainty.
3. Geopolitical Risk:
Geopolitical instability in regions such as Eastern Europe and the Middle East maintains a steady flow of safe-haven demand, adding support to gold.
4. Central Bank Demand:
Robust gold purchases by global central banks—especially from emerging markets—are strengthening long-term bullish sentiment.

GOLD D1 Chart Update For Shorter Term TradingRead all levels mentioned in chart carefully as we have 2 directions
Right now GOLD standing at turning point
GOLD remains in BUY trend as long as stays above 2900-3000 Zone

Bearish Rejection at Resistance – Potential Drop Incoming🔍 Chart Analysis Summary
1. Key Zones
Resistance Zone: ~$3,340 – $3,360
Price has been rejected multiple times from this area, showing strong selling pressure.
Support Zone: ~$3,200 – $3,240
Strong historical support level, previously held during a pullback after the last rally.
2. Moving Averages
EMA 50 (Red): Currently at ~$3,340
Price is fluctuating around it, indicating short-term indecision or a possible retest.
EMA 200 (Blue): Currently at ~$3,300
Acting as a mid-term support level. Price previously bounced from this region.
3. Pattern and Price Action
Fakeout Potential:
The chart suggests a possible false breakout above the resistance followed by a sharp drop—highlighted by the arrow. This is a common bull trap setup.
Bearish Outlook Indicated:
The projected path suggests a rejection from resistance and a drop to the support zone (~$3,200). This would create a lower high, a bearish sign.
4. Trading Bias
Bearish Setup if:
Price fails to hold above $3,340 (EMA50).
Price gets rejected from the resistance zone and breaks below $3,300 (EMA200).
Bullish Invalidated if:
Price closes convincingly above the $3,360 resistance with volume, flipping it into support.
📉 Potential Trade Idea
Short Entry: Around $3,350–$3,355
Stop Loss: Above $3,365 (above resistance zone)
Target: $3,220–$3,230 (support zone)

The Gold is in the Selling DirectionHello Traders
In This Chart GOLD HOURLY Forex Forecast By FOREX PLANET
today Gold analysis 👆
🟢This Chart includes_ (GOLD market update)
🟢What is The Next Opportunity on GOLD Market
🟢how to Enter to the Valid Entry With Assurance Profit
This CHART is For Trader's that Want to Improve Their Technical Analysis Skills and Their Trading By Understanding How To Analyze The Market Using Multiple Timeframes and Understanding The Bigger Picture on the Charts

Gold is in the Bearish DirectionHello Traders
In This Chart GOLD HOURLY Forex Forecast By FOREX PLANET
today Gold analysis 👆
🟢This Chart includes_ (GOLD market update)
🟢What is The Next Opportunity on GOLD Market
🟢how to Enter to the Valid Entry With Assurance Profit
This CHART is For Trader's that Want to Improve Their Technical Analysis Skills and Their Trading By Understanding How To Analyze The Market Using Multiple Timeframes and Understanding The Bigger Picture on the Charts

CHECK GOLD SIGNAL UPDATE READ THE CAPTAINgold signal analysis satup gold buy now entry point 3266 to 3264 take profits (3270) target 2 (3275) last target (3280) techinal analysis satup fallow risk managment

Gold sell target confirm Check this guys, I have done a 45 minute analysis, so if it is a confirmed target, go for the sale.

Gold Analysis UpdateI believe this analysis is only getting started, so let's see what happens in the coming 24 hours or so as there is NFP tomorrow (from the time of this video).
Have a great rest of your day guys

Gold (XAUUSD) - Bearish Breakout from Triangle PatternGold (XAUUSD) - Bearish Breakout from Triangle Pattern | BreakOut
Technical Analysis: On the 1-hour timeframe, Gold (XAUUSD) has formed a symmetrical triangle pattern, indicating price consolidation and reduced volatility. Recently, price action confirmed a bearish breakout below the triangle's lower trendline, suggesting a shift in momentum to the downside. The measured move technique has been applied to project the downside target, which aligns with the 3,158.27 level.
Entry: Break and retest below the triangle.
Stop Loss: Above the triangle resistance (~3,270).
Take Profit Target: 3,158.27 (based on pattern projection).
Risk-to-Reward Ratio: Favorable setup with clear invalidation.
Fundamental Context: From a macroeconomic perspective, ongoing U.S. dollar strength, supported by robust economic data and potential Fed tightening, has added downward pressure on gold prices. Additionally, reduced geopolitical tensions have limited safe-haven demand, contributing to bearish sentiment in precious metals.
Trend Outlook: The short-term trend is bearish following the breakout. Traders should monitor momentum and volume for confirmation of continuation. A failure to hold below the breakout zone could invalidate the setup.

XAUUSD on 1st Recovery at 3260.As Market is created CHOCH on H4
- 3265 the previous high : 3220 the bottom
What possible scenario we have?
Bearish scanario :
-if market give closing below 3220 then ready for the next Drop towards 3190 then 3180.
Bullish scanario :
-if candles remains above( close with body of candle)3230-3235 then owards targets will be 3350 then 3363 target
-Friday we have NFP
On WEEKLY AND MONTHLY IM ON BEARISH SIDE TILL $2980!
