Gold fluctuates, long and short operations in the US market!
📊Comment analysis
At 14:00 on Wednesday, US time, Fed Chairman Powell will hold a monetary policy press conference.
The market generally expects that the FOMC will continue to remain on hold at this meeting, as the impact of tariff policies on inflation and the economy remains to be seen; the Fed may cut interest rates in June. Since this interest rate decision does not update economic forecasts, the focus will be on the Fed's accompanying comments on any signals of future interest rate cuts to support the economy. Since the decision to keep interest rates unchanged has been fully digested by the market, Powell's tone at the press conference will be the key to changing the market's expectations for interest rate cuts this year.
💰Strategy package
The US market is expected to remain volatile, and both long and short positions have opportunities. You only need to operate at a certain point. Go long on a short-term retracement to 3378 support, and go short when it reaches the upper resistance of 3408.
⭐️ Note: Labaron hopes that traders can properly manage their funds
- Choose a lot size that matches your funds
- Profit is 4-7% of the capital account
- Stop loss is 1-3% of the capital account
GOLD.PRO.OTMS trade ideas

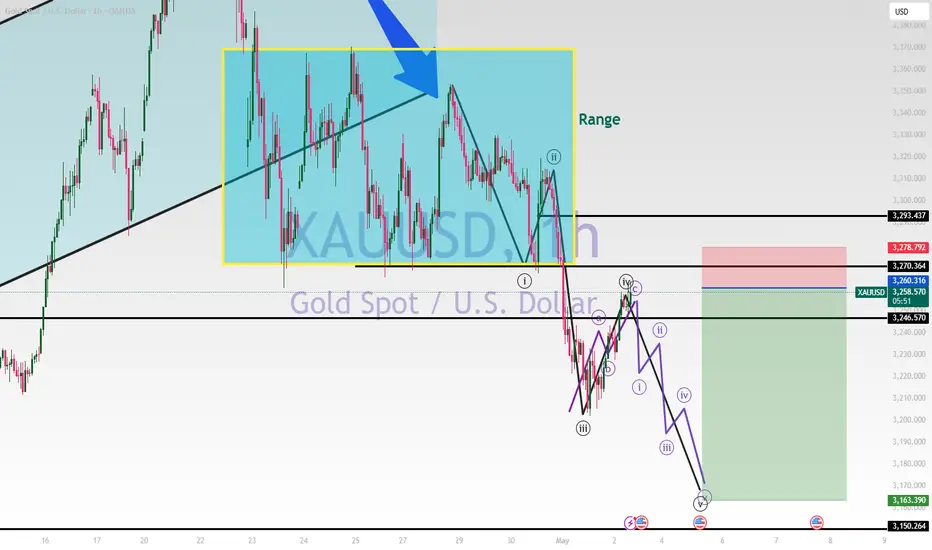
Gold Intraday Trading Plan 5/5/2025As explained in my weekly post, I will engage selling order at the start of this week. As long as 3270 is held, gold in short term remains bearish.
I am looking for selling signals at around 3246-3250 level.
1st target 3200
final target 3165

It's a shame that gold will continue to fallGold Weekly Forecast
Gold closed last week below the previous weekly lows at 3,260, confirming bearish intent. Price has now left behind multiple imbalances from the bullish leg that started at the 3,000 level.
We could first see a retracement to the small imbalance zone around 3,300, followed by a bearish continuation back to the main support/imbalance zone near 3,000.
Sideways price action is likely early in the week — but unless bulls reclaim 3,300+, momentum favors a retest of the base.
Bias: Bearish
Key Zones:
• Resistance / Rebalance: 3,300
• Support / Imbalance Target: 3,000
—
Weekly forecast by Sphinx Trading
Drop your view in the comments.
#Gold #XAUUSD #GoldForecast #LiquidityVoids #TechnicalAnalysis #SphinxWeekly #SmartMoney #FVG #3kLevel

XAUUSD - ANALYSIS👀 Observation:
Hello, everyone! I hope you're doing well. I’d like to share my analysis of XAU-USD (Gold) with you.
Looking at the chart, I see a potential small price pullback towards around 3260. After reaching that level, I expect a further price decrease to 3167.
📉 Expectation:
Bearish Scenario: After the pullback to 3260, a further decrease to 3167 is expected.
💡 Key Levels to Watch:
Resistance: 3260
Support: 3167
💬 What are your thoughts on XAU-USD this week? Let me know in the comments!
Trade safe

XAU/USD - Bearish Flag Pattern (25.04.2025)The XAU/USD Pair on the M30 timeframe presents a Potential Selling Opportunity due to a recent Formation of a Bearish Flag Pattern. This suggests a shift in momentum towards the downside in the coming hours.
Possible Short Trade:
Entry: Consider Entering A Short Position around Trendline Of The Pattern.
Target Levels:
1st Support – 3232
2nd Support – 3188
🎁 Please hit the like button and
🎁 Leave a comment to support for My Post !
Your likes and comments are incredibly motivating and will encourage me to share more analysis with you.
Best Regards, KABHI_TA_TRADING
Thank you.

Bullish or bearish market(Deep correction, not a bear market)Description
Hiii traders
I think that in general, given the upward momentum that occurred in the price from $3,000 to $3,500, the trend is bullish and this price drop to $3,200 or ultimately the support zone of $3,170-3,140.
The price at 3170 is both a strong support and a Fibo level of 0.38.
I expect a rally from around here or eventually 3170.
The important level is marked on the chart and I think we have reached the right price for a buy.
A break of the 3260-3285 price zone paves the way to 3350.
I think we were in a deep correction and not a bearish market.
Possible positions this week
A:Suitable prices for BUY positions
1)3210-3200
2)3174-3150
B:Suitable prices for SELL positions
1)3285
This is just an analysis and everyone is responsible for their own work.
Hoping for a good and profitable week.

XAUUSD on sell#XAUUSD price have breakout 3300 and more which is now at 3315, we expect rejection between the upper rectangle.
Sell at 3315-3317, stop loss at 3335, take profit at 3295-3280.
If H1 makes a closure above 3330 or more then bullish next target is at 3400.

Bullish anticipation on gold.Anticipating gold to drop just a bit before it buys. I believe that it still needs to take out that's sellside liquidity, and cover a daily fair value gap before it becomes bullish.

XAUUSD(SHORT)
Elliot's Wave expecting Final wave to the downside.
ABC retracement done
1-5 wave to begin waiting for reversal candle stick formation.
Gold Short Trade Setup – Targeting 3350 with Tiered Take ProfitThis chart shows a short setup for gold (XAUUSD) on the 30-minute timeframe. Price is currently trading below a descending trendline and has formed a lower high near a marked resistance level. There was a clear change of character and a break of structure to the downside, indicating a bearish shift in market sentiment. Volume also appears to increase on bearish candles, adding strength to the downside move. The target is marked near the previous low around 3350, suggesting a short opportunity with a clear resistance and descending trendline acting as confluence.
TP1 – 3370
Just above the immediate support level, offering a conservative exit before the price potentially bounces.
TP2 – 3350
The main target on the chart, near the previous low. Strong support zone; ideal for full or partial profit.
TP3 – 3325
Extension target if bearish momentum accelerates. Use only if volume and price action support further downside.

Watch out, a strong potential drop onboard.I will be selling at 2270 and TP at 2190, 2160, 2050
This is only an idea and not a financial advice.

Gold XAUUSD is bullish in natureGold XAUUSD is a bullish pair so when it sells its for short reversals and market correction. I see a correction that would be corrected at 3160 area. I hope it reverses in a few mins at the close and start of the 4hr candle by 2pm. I hope gold reverses from 3227-3220 down to 3200 and then 3160 to correct the imbalance and give buyers an opportunity for better entry. I don't know when all these will take place. What do you think about my analysis? and what's your idea on Gold. its currently at 3220 area. Buy or Sell

XAU/USD Trade Plan 30/4/2025XAUUSD Trade Setup:
We are watching the 3260 resistance level closely. If the market breaks above 3260, we will look for a buy opportunity, targeting the 3390 level.
However, if the market fails to break above 3260 and shows signs of rejection, we will consider a sell setup, with a potential move down toward the next support at 3200.

Although the bulls are strong, don't chase them at high levelsFrom the 4-hour analysis, the upper pressure in the evening is around 3336-3345, and the lower support is around 3280-3293. In the evening, we will continue to rely on this range to maintain the main tone of high-altitude low-multiple cycles. In the middle position, we will watch more and do less, and follow orders cautiously, and wait patiently for key points to enter the market. I will remind you of the specific operation strategy during the trading session, so please pay attention to it in time.
Gold operation strategy: 1. Gold rebounds to 3336-45 line, stop loss 3353, target 3280-3295 line, continue to hold if it breaks;
2. Gold falls back to 3280-3295 line and goes long, stop loss 3274, target 3325-30 line, continue to hold if it breaks;

GOLD/USD Short-Term Bullish Setup – Final Wave 5 ExpectedAs per the current 30-min chart, Gold appears to be completing its corrective structure and is now poised for a bullish reversal. Key observations:
🔹 Support Zone:
Gold has respected the 78.6% Fibonacci retracement level (~3210), showing strong demand in this region. This marks the potential base of the upcoming 5th Elliott wave.
🔹 Trigger Level:
Price needs to break and sustain above 3240 to confirm bullish momentum. This is the neckline of the current consolidation and serves as the breakout zone.
🔹 Wave Projection:
We anticipate Gold to initiate Wave 5, the final impulsive move in the current sequence. A clear breakout above 3240 may trigger a rally towards 3300 / 3360 / 3420 in the short term.
🔹 Strategy:
Wait for a bullish candle close above 3240 to confirm breakout. Aggressive traders may initiate early positions near 3210 with tight stop-losses.
📌 Key Levels:
Support: 3210–3200 (78.6% Fib)
Breakout: 3240
Targets: 3300 / 3360 / 3420
🔻 Invalidation:
Break below 3200 would invalidate this bullish count and suggest deeper correction.
💬 Gold is gearing up for its final bullish thrust. Monitor 3240 zone for breakout confirmation. Keep risk managed!
❗ Disclaimer:
This analysis is for educational and informational purposes only. It does not constitute investment advice or a recommendation to trade. Always do your own research and consult your financial advisor before making trading decisions.

Gold is under pressure at 3400, with a short-term decline expectGold is under pressure around 3400. Today we will have the Fed's interest rate decision and Powell's speech. If gold is under pressure at 3400, it is expected to fall. Before the data, we need to be cautious.
In terms of trading ideas, we can short short-term, pay attention to the short near 3393-96, stop loss 3403, take profit 3360/3350

Bullish activated.The market has shifted sentiment, with safe-haven demand, technical confluence, and volume confirmation pointing toward continued upside potential.

GOLD Weekly OUTLOOK HAPPY MONDAY
XAUUSD GOLD DROPPING FROM 3335 TO 3367
Helping us make substantial positive gains.
Gold will first reach 3338 or 3365 and then drop below.Then it will go to my target which I have mentioned in the target up chart 3260If you like my chat, please support and like it.My charts always come out right. I hope this chart of mine comes out right too.
GOOD LUCK AND TRADE SAFELY!
THANKS FOR YOUR UNWAVERING SUPPORT!
LIKE OUR IDEAS
COMMENT ON OUR IDEAS
SHARE OUR IDEAS
TEAM ISABELLA01

XAU/USD BUY - FOOTPRINT EXTREME BUYING IMBALANCE Trade Sequence:
1. Wait for price to take out the low highlighted
2. Once the low has been taken out look for a 15minute timeframe divergence between the candlestick chart and the CVD (should be a bullish divergence with the CVD going upwards)
3. Once the divergence has occured look for an entry on from a 1 minute shift in market structure.
SL = Below the low of that day.
TP = Indicated by the buy box

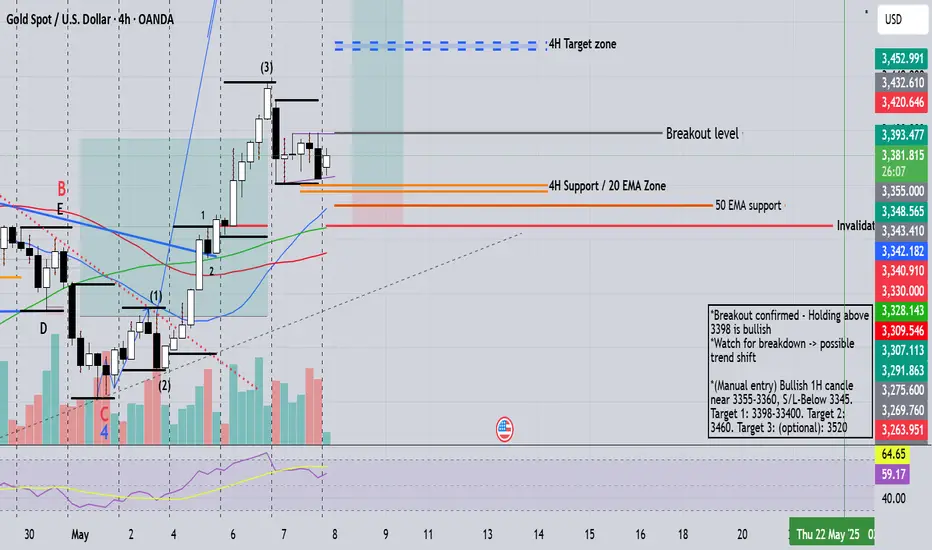
Gold looks bullish at the current level. 1.The chart is showing a series of higher highs and higher lows, indicating an overall uptrend.
2. *Price is above the 20-day MA - Typically a bullish signal.
* (50-day and 89-day MA) are trending upwards and far below the current price, reinforcing a longer-term bullish trend.
Recent Candlestick Action: A strong bullish candle recently bounced off the blue MA after a short consolidation, suggesting buyers stepped in to the pullback. The last candles shows upward momentum resuming, possibly forming a Bullish continuation pattern. The RSI seems to be trending slightly down or flat not yet in overbought territory.
The technicals favor further upside in the short term to medium term, especially if the recent bullish candle closes strong. A break above the recent highs would confirm continuation, while a failure there could mean a short-term pullback.
After the late- April peak and pullback, the market formed a higher low, followed by a strong bullish rally from May 3rd onward. Current candles are consolidating after a sharp move - showing healthy digestion of gains. No strong bearish reversal patterns are visible yet.
Volume increased during the May 3-6 rally - a good sigh of strength behind the move. Slight decrease in volume on the latest candles, suggest consolidation rather than distribution.
RSI is rising but not yet in overbought territory - Room for upside remains. Watch if RSI diverge while price pushes up - that could signal exhaustion.
Warning sign : Drop below 2240 and break below EMAs would shift bias neutral to bearish.
4h Price Structure : after forming a double bottom or rounded base near April 30 - May 2, price pushed up strongly. It`s now consolidating just under the recent highs, forming a bullish flag or tight range, suggesting a potential breakout.
Risk Level To Watch: A break below 3345 (near the 59 EMA and previous range) would invalidate this short-term target and signal weakness.
XAUUSD MG Trading XAUUSD
I am not professional trader.
Short time for me below 3357
Long time for me below 3405

XAUUSD BULLISH INTENT Gold's uptrend is clear. However, are we seeing a short-term selling opportunity shaping up towards 2933?
Trade responsibly.
Like, Comment and Share.
Thank you 😊

GOLD POSSIBLE BUY We'll take partial profit because of incoming volatile news, April's jobs report is expected to show a hiring slowdown amid tariff-related uncertainty, with 135,000 new jobs projected and unemployment steady at 4.2%, as economic data signals early signs of cooling.
