Stock market information for GoldStock market information for SPDR Gold Shares ETF (GLD)
Recent analyses indicate a bullish trend in the gold market.
Entry Point = 3247
Take Profit = 3343
Stop Loss = 3159
GOLD.PRO.OTMS trade ideas

3420, gold prices can reach today
📌 Gold driving factors
Driven by the weakening of the US dollar and safe-haven demand, spot gold closed up $93.77 on Monday, up 2.9%, at $3333.32 per ounce.
On Monday local time, US President Trump signed an order on biomedical research, hoping to take the opportunity to promote the US pharmaceutical manufacturing industry. Trump also announced that tariffs on pharmaceutical products will be announced in the next two weeks.
Kitco Metals senior metals analyst Jim Wyckoff said: "We see continued inflows of safe-haven demand, keeping gold prices high. Gold prices will remain above $3,000 per ounce, at least in the short term."
Gold is often seen as a safe-haven tool in uncertainty and performs well in a low-interest rate environment. Gold prices have soared 26.3% this year and have set new historical highs many times.
📊Comment Analysis
Bulls regained their dominance, and the upward trend approached above 3400 before the market expected a rate cut
💰Strategy Set
🔥Sell Gold Area: 3418-3420 SL 3425
TP1: $3410
TP2: $3400
TP3: $3385
🔥Buy Gold Area: $3323 - $3321 SL $3316
TP1: $3330
TP2: $3340
TP3: $3358
⭐️ Note: Labaron hopes that traders can properly manage their funds
- Choose the number of lots that matches your funds
- Profit is 4-7% of the fund account
- Stop loss is 1-3% of the fund account

5M And15M indicator with tight SL you will make profit XAU/USDReally nice Buy and Sell indicator, Tight SL and let it run SL to Entry. Works well on bitcoin also. If you would like it let me know. thank you

Gold Price ActionHello, Currently, price is in a Compression Phase after a strong Resistance Breakout (RBO). This tight consolidation is creating liquidity on both sides—setting up for a potential breakout.
What to Watch:
Compression Phase = Liquidity Building
Price is moving within a narrow range, trapping traders and stacking orders above and below.
We're waiting for a clean breakout of this range.
After the breakout, price is likely to retrace back toward the base (marked zone) before making a strong move toward the Buy Side Liquidity (BSL).
🎯 Trade Plan:
Wait for the compression to break. A return to the base zone could offer an entry, with BSL as the target (TP).
⚠️ Stay patient and avoid early entries—let the breakout confirm the move.
✅ Patience is key—wait for confirmation and manage risk smartly.


HelenP. I Gold can correct to trend line and continue to growHi folks today I'm prepared for you Gold analytics. After the recent drop and partial gap-fill, the price seems to be forming a solid foundation for a potential continuation to the upside. The price previously rebounded from the lower levels near 2955 and established a strong bullish trend, respecting the ascending trend line multiple times. Each touch acted as a signal for buyers to step in, pushing the price toward higher zones. Eventually, the market broke through a major resistance area, which has now turned into a support zone between 3265 and 3295 points. This area is also reinforced by the trend line, which has been tested again recently. Importantly, the price left a gap during the impulsive move up, and after the correction, the gap was filled, and buyers immediately reacted. Now, Gold is trading slightly above the support zone, showing a clear bounce from both the trend line and horizontal structure. This confluence increases the probability of further bullish momentum. Given the price behavior, market structure, and technical context, I expect that XAUUSD will continue rising toward the 3425 points, that’s why it is my current goal. If you like my analytics you may support me with your like/comment ❤️

Gold Bear Projection After Bullish Rejection at 3316Gold market shifts to a bearish projection following a rejection at the bullish stance near 3316. As 3270s are mitigated, price action now aims to sweep the imbalance zone between 3299 and 3312. follow for more insights , comment and boost idea

GOLD 4H CHART ROUTE MAP UPDATEHey Everyone,
Please see update on our 4h chart route map today after 2 days of smashing targets on the 1h chart idea.
Once again another great day on the markets today. We got our Bearish 3282 and our Bullish 3343 targets hit. No cross and lock on either level, so we are seeing tennis between both Goldturns.
We will look for a ema5 cross and lock on either level to determine the next move. We will see levels tested side by side until one of the weighted levels break and lock to confirm direction for the next range.
We will keep the above in mind when taking buys from dips. Our updated levels and weighted levels will allow us to track the movement down and then catch bounces up.
We will continue to buy dips using our support levels taking 30 to 40 pips. As stated before each of our level structures give 20 to 40 pip bounces, which is enough for a nice entry and exit. If you back test the levels we shared every week for the past 24 months, you can see how effectively they were used to trade with or against short/mid term swings and trends.
BULLISH TARGET
3343 - DONE
EMA5 CROSS AND LOCK ABOVE 3343 WILL OPEN THE FOLLOWING BULLISH TARGET
3404
EMA5 CROSS AND LOCK ABOVE 3404 WILL OPEN THE FOLLOWING BULLISH TARGET
3439
EMA5 CROSS AND LOCK ABOVE 3439 WILL OPEN THE FOLLOWING BULLISH TARGET
3503
BEARISH TARGETS
3282 - DONE
EMA5 CROSS AND LOCK BELOW 3282 WILL OPEN THE FOLLOWING BEARISH TARGET
3224
EMA5 CROSS AND LOCK BELOW 3224 WILL OPEN THE SWING RANGE
SWING RANGE
3190 - 3138
EMA5 CROSS AND LOCK BELOW 3138 WILL OPEN THE SECONDARY SWING RANGE
SECONDARY SWING RANGE
3088 - 3046
As always, we will keep you all updated with regular updates throughout the week and how we manage the active ideas and setups. Thank you all for your likes, comments and follows, we really appreciate it!
Mr Gold
GoldViewFX

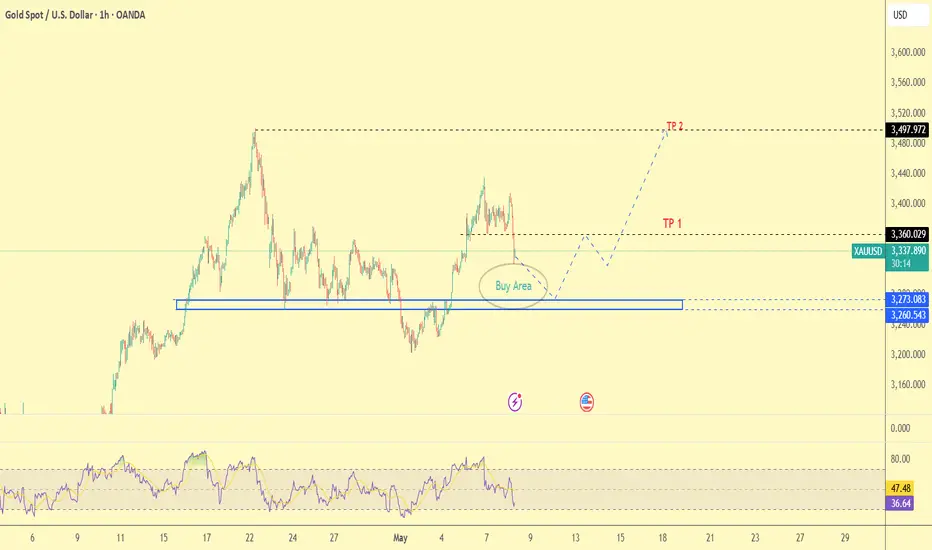
(XAU/USD) 1H Chart: Long Setup Targeting 3,500 with Key Support Entry Point: Suggested near 3,301.51 USD (marked with the purple support zone).
Stop Loss Zone: Below 3,266.87 to 3,221.67 USD (marked in blue and purple). This is where you limit your loss if the trade goes wrong.
First Target (Target Point One): 3,376.65 USD.
Final Target (EA Target Point): 3,523.55 USD (~8.26% potential gain from entry).
Main Setup Idea:
The price is consolidating around the support zone.
There's a plan to buy (go long) at the purple zone (Entry Point) and aim for the two target points

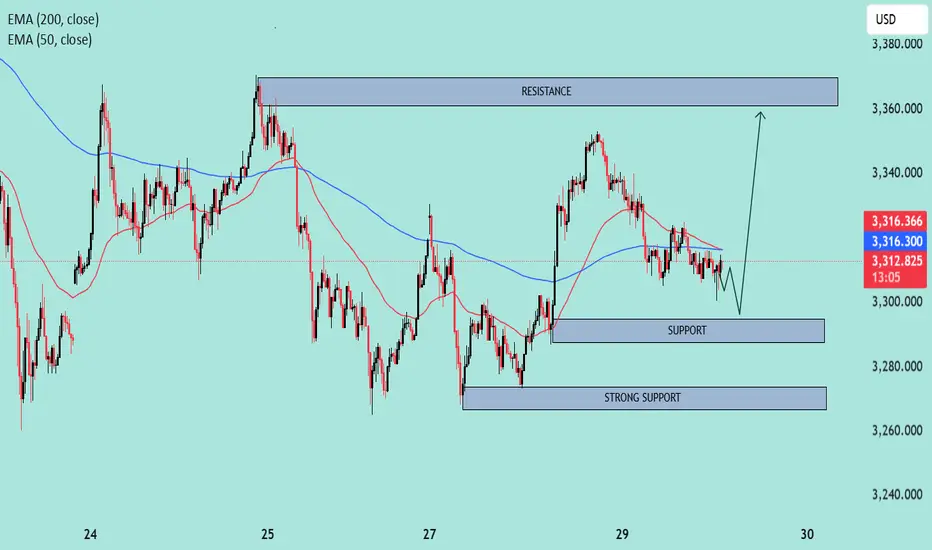
XAUUSD – Bullish Reversal Setup Near Support🟦 Chart Context:
Type: Intraday (likely 15m or 1h timeframe).
Indicators Used:
EMA 50 (Red): 3,316.497
EMA 200 (Blue): 3,316.332
Current Price: 3,312.650
🔍 Technical Analysis:
1. Trend & Moving Averages:
EMA Crossover (Bearish): The 50 EMA is slightly above the 200 EMA, but both are flat and converging, suggesting a neutral to slightly bearish short-term sentiment.
Price below both EMAs indicates bearish pressure in the immediate term.
2. Key Zones:
Resistance Zone: 3,355 – 3,370
Price was previously rejected from this zone, indicating strong supply and likely sell orders.
Support Zone: 3,295 – 3,305
Price has bounced here multiple times, suggesting active buyers.
Strong Support: 3,265 – 3,275
A broader and more historically respected area that could lead to a significant reversal if tested.
3. Price Action:
Currently forming lower highs and lower lows, which is a classic sign of short-term weakness.
A small descending triangle appears to be forming near the support level (bearish bias), but the drawn forecast suggests a potential fakeout breakdown followed by a bullish reversal.
4. Expected Scenario (as per chart projection):
Price might dip briefly into the 3,295–3,305 support, triggering liquidity grab (stop hunts).
A potential bullish rally towards the 3,355–3,370 resistance zone is expected.
This suggests a buy-the-dip strategy near support with tight risk management.
📈 Trade Outlook:
🟢 Bullish Bias:
If the support at 3,295–3,305 holds and price reclaims the 200 EMA convincingly.
Target: 3,355–3,370 resistance zone.
🔴 Bearish Bias:
If price breaks below the strong support (3,265), expect continuation lower.
Downside targets would then extend towards 3,240–3,250.
✅ Conclusion:
Current bias: Neutral to short-term bearish unless the lower support holds.
Key action zone: Watch price reaction around 3,295.
Strategy suggestion: Monitor for a bullish reversal signal at support; avoid chasing trades in the middle of the range.
GOLD - Price can correct to support area and then bounce upHi guys, this is my overview for XAUUSD, feel free to check it and write your feedback in comments👊
A few moments ago price entered to rising channel, where it at once broke $2885 level and reached resistance line of channel.
Then it corrected and then continued to move up in channel, but later it dropped to support area.
Price soon rose above $2885 level, making a fake breakout and after retesting this level, continued to grow.
Later Gold reached resistance line of channel and then made correction movement, exiting from channel and entered to pennant.
In pennant pattern, price made upward impulse, breaking $3275 level and at the moment it trades near $3275 level.
I think that Gold can exit from pennant, decline to support area, and then bounce up to $3440
If this post is useful to you, you can support me with like/boost and advice in comments❤️

GOLD Trade Plan 08/05/2025Dear Traders,
after FOMC and After Powell's speech, we saw heavy fluctuations in gold. I expect the price to drop below the 3300 zone, which is a buying area, and from there, we could see a strong move toward the all-time high.
If you enjoyed this forecast, please show your support with a like and comment. Your feedback is what drives me to keep creating valuable content."
Regards,
Alireza
Lingrid | GOLD Market COMPRESSION: Coiling Up Before BREAKOUTOANDA:XAUUSD is forming a potential triangle pattern after bouncing from support near 3,220, where multiple key levels converge. The price is holding above the short-term upward trend-line, showing signs of compression. If buyers defend this area again, we could see a breakout toward the 3,380 resistance. Until then, the pair remains in a consolidation phase.
📈 Key Levels
Buy zone: 3,280 – 3,290
Buy trigger: bounce from trend-line
Target: 3,380
Sell trigger: break below 3,280 with confirmation
💡 Risks
Gold remains sensitive to USD news — strong data can limit upside.
A sudden break of the triangle base may shift bias to bearish.
Volatility expected ahead of key macro releases this week.
Traders, if you liked this idea or if you have your own opinion about it, write in the comments. I will be glad 👩💻

GOLD - Bearish Head and ShouldersHello Traders !
The GOLD price formed a head and shoulders pattern.
Currently, The neckline is broken !
So, I expect a bearish move📉
_______________
TARGET: 3170🎯

Gold rises strongly and bulls restart!Gold technical analysis: From a technical point of view, the daily line rose on Monday, showing an absolutely strong positive state. Normally, the daily cycle rises and we can see that the upper Bollinger track is near 3500, so there is a lot of room above, and we should pay attention to the continuation of this wave. The 4-hour cycle still needs a wave of strength, and it needs to go out of a big rise before it can open the upper Bollinger track and form an absolute unilateral strength. Therefore, although it is clearly bullish for the time being, there is also a certain possibility of adjustment. At present, the support of the 4-hour cycle is near 3330. If there is a chance of a decline, we can follow the bullish trend.
On the whole, the short-term operation strategy for gold today is to focus on buying on pullbacks and shorting on rebounds. The short-term focus on the upper side is the 3415-3420 line of resistance, and the short-term focus on the lower side is the 3330-3350 line of support.
Short order strategy:
Strategy 1: Short 20% of the gold position in batches when it rebounds to around 3415-3420, stop loss 6 points, target around 3390-3380, and look at the 3360 line if it breaks;
Long order strategy:
Strategy 2: Long 20% of the gold position in batches when it pulls back to around 3350-3352, stop loss 6 points, target around 3380-3400, and look at the 3420 line if it breaks;

GOLD - NEW BREAKOUT !Hello Traders !
The Gold price failed to create a new lower low.
The Last lower high is broken (change of character).
So, I expect a bullish move🚀
______________
TARGET: 3340.000🎯

DXY, BTCUSD, USDJPY, XAGUSD & XAUUSD Daily Trade SetupsIn this update we review the recent price action in the Dollar, Bitcoin, Yen, Silver & Gold and identify the next high probability trading setups and price targets. To review today's video analysis click here!

THE KOG REPORT - UpdateEnd of day update from us here at KOG:
The range continues! We've been playing this range now for nearly a trading week and although it's giving us the scalps, it's not making the move that we want at the moment. Day before yesterday, we said we would stick with the plan, and it's worked again, however, this time, if we approach that key level 3335, we're not going to suggest attempting that short again.
Having said the above, even though it's frustrating, we're going to stick with the plan at the moment. Most of our bearish targets are completing together with KOG's bias of the day, so lets see if we can break below that 3300 level and hold! As it stands, nothing to lose unless we get taken at BE again.
Circled are the key levels to look out for, bias still stands for now. NFP around the corner, it's going to make it even more of a whipsaw.
As always, trade safe.
KOG

XAU/USD..gold 15M chart pattern..Im planning a gold (XAU/USD) trade based on a trend line breakout strategy. Here's a breakdown of your setup:
**Trade Summary:**
- **Action:** SELL GOLD
- **Entry Price:** 3384
- **Target 1 (TP1):** 3352 (-32 points)
- **Target 2 (TP2):** 3322 (-62 points)
- **Strategy:** Trend line breakout (likely a breakdown below support).
### Key Considerations:
1. **Confirmation:**
- Ensure the trend line breakout is confirmed (e.g., a close below the trend line with momentum, high volume, or candlestick patterns like a bearish engulfing).
- Watch for retests of the broken trend line (now resistance) for added validity.
2. **Risk Management:**
- Place a stop-loss (SL) above the trend line or a recent swing high (e.g., 3405–3415, depending on volatility).
- Risk-reward ratio: TP1 offers ~1:1 if SL is ~30 points, TP2 ~1:2.
3. **Targets:**
- TP1 (3352): Partial profit-taking level.
- TP2 (3322): Final target, possibly near a support zone (adjust based on price structure).
4. **Market Context:**
- Check higher timeframes (H4/Daily) for alignment with the downtrend.
- Monitor USD strength, yields, or geopolitical news impacting gold.
Would you like help refining the stop-loss or analyzing the chart structure further?

GOLD (XAUUSD): Trading Plan BEFORE FOMC
Gold bounced yesterday, as I predicted.
Today, we see a retest of a broken daily resistance
that turned into support after a breakout.
BEFORE FED Rate Decision today, there is another opportunity
to buy Gold:
I see a double bottom pattern on an hourly time frame.
Bullish violation of its neckline and an hourly candle close above
3394 will provide a strong intraday confirmation.
It will push the prices at least to 3429 level.
❤️Please, support my work with like, thank you!❤️
I am part of Trade Nation's Influencer program and receive a monthly fee for using their TradingView charts in my analysis.

GOLD Gold’s Trade Relationship with the US Dollar and Bond Market (May 2025)
1. Inverse Correlation Between Gold and the US Dollar
Gold and the US Dollar Index (DXY) typically move in opposite directions. When the dollar weakens, gold prices tend to rise, and vice versa. This inverse relationship remains strong in 2025, with gold’s beta to the dollar shifting to around -0.7, amplifying the negative correlation.
The US dollar has weakened about 8–9% year-to-date in 2025, contributing to gold’s surge to record highs above $3,500 per ounce.
Dollar weakness is driven by factors such as slowing US growth forecasts, political uncertainty around Federal Reserve independence, and declining foreign demand for US Treasuries.
2. Gold’s Role as a Safe Haven Amid Bond Market Dynamics
In 2025, gold has increasingly become the preferred safe-haven asset, especially as US Treasuries and the dollar have faced sell-offs.
The bond market has experienced rising yields (e.g., 30-year Treasury yields hitting highs not seen since late 2023), which traditionally would pressure gold. However, geopolitical tensions, trade uncertainties, and concerns about real yields have driven investors toward gold instead of bonds.
Gold’s correlation with real yields has shifted strongly negative (around -0.78), meaning that as real yields fall or remain negative, gold prices rise. Negative real interest rates reduce the opportunity cost of holding non-yielding gold, enhancing its appeal.
3. Impact of Monetary Policy and Inflation Expectations
The Federal Reserve’s high nominal rates combined with inflation running above target have created negative real interest rates (nominal rates minus inflation), which historically support gold’s price appreciation.
Expansionary monetary policies globally, including increased money supply growth (M2 up 8.3% YoY among G20 nations), provide liquidity that fuels gold demand.
Tariff-induced inflation and geopolitical risks further elevate gold’s status as a hedge against monetary and trade policy uncertainty.
4. Summary of the Relationship
US Dollar Weakness then Gold price rises (inverse correlation) and Dollar declines.
Rising Bond Yields is Usually bearish for gold, but offset by safe-haven demand in 2025 Yields rise, bonds sell off
Negative Real Yields is Strongly bullish for gold Real yields fall, reducing bond attractiveness
Geopolitical/Tariff Uncertainty Boosts gold as safe haven Increases volatility in dollar and bond markets
Monetary Expansion (Liquidity) Supports gold price Can pressure dollar value
Conclusion
In May 2025, gold’s price surge to record levels is primarily driven by a weaker US dollar and negative real bond yields, combined with geopolitical and trade uncertainties that have diminished the safe-haven appeal of US Treasuries. While rising nominal bond yields might typically weigh on gold, the prevailing negative real rates and investor preference for gold as a monetary hedge have reversed this trend. The strong inverse correlation between gold and the dollar remains a key dynamic shaping market behavior.

"Gold Ain’t Done Yet – Snipers Don’t Sleep, They Wait After a clean CHoCH from 3205 and bullish NY session push, Gold is currently hovering around 3239 ahead of major macro catalysts tomorrow (May 2):
💼 News to Watch:
NFP (133K vs. 228K prev)
Unemployment Rate
Average Hourly Earnings All releasing between 15:30–17:00 UTC+2, potentially fueling a volatility storm.
We remain in a broader retracement phase after April highs (ATH 3500), with price still sitting in higher timeframe discount zones and internal bullish signs building. However, supply above is unmitigated and could cap rallies.
🔁 MARKET STRUCTURE
Price is currently at 3239, just above a valid H1–H4 support zone.
Clean CHoCH confirmed from 3205
Liquidity still resting both above 3284 and below 3172
🔽 BUY SCENARIOS (From Discount + Liquidity Areas)
🟢 Buy #1 – 3205–3212
🔹 H1 CHoCH zone + internal FVG
🔹 Sell-side liquidity just swept
🔹 Entry if price retests post-NFP drop
⚠️ Ideal for short-term bounce or reaccumulation into 3260
🟢 Buy #2 – 3172–3185
🔹 H4 OB + sweep zone + EQ
🔹 Heavy stop cluster under 3200
🔹 If broken, becomes invalid → eyes move to 3120
🔸 High-risk/reward reversal zone if NFP panic spikes below
🔼 SELL SCENARIOS (From Premium + Imbalance Zones)
🔴 Sell #1 – 3284–3295
🔹 H1–H4 supply + FVG + internal BOS
🔹 Buy-side liquidity just above 3280
🔹 Classic pre-news pump & dump zone
⚠️ Watch for wicks above 3288 → sniper sell trigger
🔴 Sell #2 – 3325–3333
🔹 HTF OB shelf + imbalance + previous NY rejection
🔹 Final retail breakout trap before larger drop
🔹 Cleanest R:R setup if NFP drives price explosively upward
👀 Eyes On:
Zone Reaction Type What to Watch
3220–3235 Bounce or trap Current zone = fragile intraday demand
3284–3295 Rejection or flip Cleanest NY pump trap zone
3172–3185 Final support Below = invalidates bullish scenario short-term
3325–3333 Bull trap zone If reached = extreme precision sell only
🎯 Bias:
LTF: Bullish retrace valid above 3212
HTF: Still bearish under 3330
Macro: Wait-and-react on NFP → NO prediction
📣 Final Note for GoldMinds:
This is not a prediction plan.
It’s a reaction plan.
We mapped the real zones.
Now let the volatility reveal which liquidity gets hit first.
💬 Drop a 🧠 if you’ve evolved past “buy now / sell now” noise.
Let’s hunt like pros — not guess like rookies.

Bullish Setup on Gold: Correction hints continuation opportunityOANDA:XAUUSD is trading within a well-defined ascending channel, signaling strong bullish momentum. The price has consistently formed higher highs and higher lows, which aligns with the continuation of the uptrend. The recent pullback appears to be a healthy correction within the overall uptrend , allowing the market to potentially reset before continuing its upward trajectory within the ascending channel.
This pullback is offering a potential re-entry point for buyers, if key support levels hold. This would reinforce the bullish structure and increase the likelihood of a move toward the 3,680 price, which aligns with the channel’s upper boundary.
As long as the price remains above the support zone, the bullish outlook stays intact. However, a failure to hold above this level could invalidate the bullish scenario and increase the likelihood of a pullback toward the channel’s lower boundary.
