Gold Trade Plan 30/04/2025Dear Traders,
Gold has once again entered the 3275 support zone. Given that this is the fifth time it has tested this support, I expect the price to break below it. Additionally, the dollar index has entered a reversal phase. Good buying zones are around 3200–3220.
if you enjoyed this forecast, please show your support with a like and comment. Your feedback is what drives me to keep creating valuable content."
Regards,
Alireza!
GOLD trade ideas

Gold awaits NFP after serious decline I expectedAs discussed throughout my yesterday's session commentary: "Technical analysis: Gold is being kept below the Hourly 4 chart’s Resistance zone of #3,292.80 - #3,300.80 despite the rejection on DX and continuous rise on equities, Gold didn’t manage to prepare the terrain for further the uptrend, according to my Technical estimations. Besides the High Selling Volume and evident Price-action showcasing of Bearish trend switch, #3,262.80 Support I mentioned which was about to be tested was invalidated and naturally Gold is on a decline (as I expected it throughout my recent remarks) and is Technicals what's keeping Gold Lower, relative to circumstances. Regardless of that, the Daily chart’s Support (Medium-term) is Trading just few points below, at #3,200.80, if broken it can open doors for #3,127.80 extension and Support mark test and is alone a positive development for Sellers ahead of the end of the Trading week."
Technical analysis: Daily chart remains isolated within solid Descending Channel and being Bearish indicates a Short-term Selling opportunity towards #3,200.80 psychological mark if Support gets invalidated and NFP delivers upside surprise (what I indeed expect). Keep an eye on the DX especially when the U.S. session opens (Bullish Gap fill) throughout today’s session in order to get more information and pointers of the Intra-day direction. Gold got rejected at #3,200.80 - #3,227.80 Medium-term Support zone (many rejections on current pressure point) and since the pullback wasn’t Bought back above the Hourly 1 chart’s Buying accumulation zone, current Price-action points that the Selling sentiment remains unchanged as this is just one of early Trading weeks in May. That keeps the Hourly 4 chart’s Descending Channel valid (already converted to a Bearish Flag / messenger of Selling continuation ahead), with #3,262.80 configuration currently representing it’s local Lower High’s Upper zone).

NF fluctuates in a downward trend⭐️GOLDEN INFORMATION:
China’s Ministry of Commerce announced Friday that the United States has recently initiated communication through official channels, expressing interest in reopening talks on tariffs. Beijing is currently evaluating the proposal, fueling optimism that a resolution to the prolonged tariff standoff between the world’s two largest economies may be on the horizon.
This renewed hope for a breakthrough in trade negotiations helped lift the US Dollar to a three-week high on Thursday, pressuring Gold prices down toward the $3,200 mark. However, bullish momentum for the USD remains tempered as markets increasingly price in the likelihood of more aggressive rate cuts by the Federal Reserve, especially with the closely watched US Nonfarm Payrolls data looming.
⭐️Personal comments NOVA:
NF news volatility is certain, with the big accumulation from last week. Gold price has confirmed the trend after breaking 3267, will fluctuate in a downtrend below 3200
⭐️SET UP GOLD PRICE:
🔥SELL GOLD zone : 3312- 3310 SL 3317
TP1: $3290
TP2: $3280
TP3: $3270
🔥BUY GOLD zone: $3175 - $3177 SL $3170
TP1: $3185
TP2: $3200
TP3: $3210
⭐️Technical analysis:
Based on technical indicators EMA 34, EMA89 and support resistance areas to set up a reasonable SELL order.
⭐️NOTE:
Note: Nova wishes traders to manage their capital well
- take the number of lots that match your capital
- Takeprofit equal to 4-6% of capital account
- Stoplose equal to 2-3% of capital account

Heading into pullback resistance?XAU/USD is rising towards the resistance level which is a pullback resistance that lines up with the 23.6% and the 50% Fibonacci retracement and could reverse from this level to our take profit.
Entry: 3,275.29
Why we like it:
There is a pullback resistance level that line sup with the 23.6% and the 50% Fibonacci retracement.
Stop loss: 3,350.60
Why we like it:
There is a pullback resistance level that lines up with the 50% Fibonacci retracement.
Take profit: 3,168.44
Why we like it:
There is a pullback support level that aligns with the 61.8% Fibonacci retracement.
Enjoying your TradingView experience? Review us!
Please be advised that the information presented on TradingView is provided to Vantage (‘Vantage Global Limited’, ‘we’) by a third-party provider (‘Everest Fortune Group’). Please be reminded that you are solely responsible for the trading decisions on your account. There is a very high degree of risk involved in trading. Any information and/or content is intended entirely for research, educational and informational purposes only and does not constitute investment or consultation advice or investment strategy. The information is not tailored to the investment needs of any specific person and therefore does not involve a consideration of any of the investment objectives, financial situation or needs of any viewer that may receive it. Kindly also note that past performance is not a reliable indicator of future results. Actual results may differ materially from those anticipated in forward-looking or past performance statements. We assume no liability as to the accuracy or completeness of any of the information and/or content provided herein and the Company cannot be held responsible for any omission, mistake nor for any loss or damage including without limitation to any loss of profit which may arise from reliance on any information supplied by Everest Fortune Group.

Gold Trade Plan 06/05/2025Dear Traders,
price broken 3320 (Means Market will continue Upward movement)
i expect price will be continue upward movement to 3400-3420 Area Today ,
If you enjoyed this forecast, please show your support with a like and comment. Your feedback is what drives me to keep creating valuable content."
Regards,
Alireza

Gold Trade Plan 01/05/2025Dear Traders,
The April monthly candle closed around 3285. Currently, the price has reacted to a previously identified zone and is now moving within a descending channel, with the channel's upper boundary at 3285. If the price gives a daily close above 3285, I expect it to rise toward 3370.
otherwise complex Correction will be continue and my Final Target is 3170
if you enjoyed this forecast, please show your support with a like and comment. Your feedback is what drives me to keep creating valuable content."
Regards,
Alireza

YOUR SEEING THIS NOT BY ACCIDENT (GOLD SWING)
remember this idea before, way early to short right?
Now its the time to short it. initial and 2nd tp zone. probable the swing tp could be 2700-2600 or
lower.
See this a liquidity grab on internal/inside a monthly basis chart.
This is not a random as you see this, it means you trade this for Long shot or swing thot.
Guys this idea is on my self only.
This is not a financial advice.
See you again next week.
The previous news or the ADP NFP are non sense. we a make a new highs again once this idea works?
This is only my view.
sharing this could turn your idea to swing trades.
Follow for more.

Gold Trade Plan 02/05/2025-05/05/2025Dear Traders,
The descending channel is working precisely. After hitting the middle of the channel, the price started to drop. I expect another low below 3200, followed by a rise toward around $3400.
if you enjoyed this forecast, please show your support with a like and comment. Your feedback is what drives me to keep creating valuable content."
Regards,
Alireza!

THE KOG REPORT THE KOG REPORT:
In last week’s KOG Report we said we would be looking for the price to continue upside into the region given which gave us a fantastic capture for the start of the week. We then had to adapt as the bias level and targets on the red box indi changed suggesting more upside. We continued to complete all our bias above targets as well as Excalibur and LiTE giving us 100% again for the week!
It wasn’t easy as it sounds, it took a lot of work and constant monitoring but the pip capture on gold was out of this world and well worth it!
So, what can we expect from the week ahead?
For this week we seem to be creating a DB on the 4hr chart which entails caution. We have resistance just above at the 3330-35 with extension 3240-45 region which if attacked and rejected in the early session could give the potential short trade into the support level 3295-8 which is the key level that needs to break for us to go lower.
There is a lot of liquidity above, especially those who like us shorted and held trades from the 3450 levels so the bias this week changes to the 3350-55 level, break above and we will confirm the move higher, otherwise, our thoughts are a test is likely on the high but we would like to get that long from lower to again create a new ATH.
Let’s see how we open, these markets need to be adapted to every day so making long terms plans as intra-day traders isn’t on our agenda at the moment. The market is giving short term, so why not take advantage of the conditions while they last.
Potential for gaps on open so please be careful, we’re on red boxes and extreme levels only.
RED BOXES INDI LEVELS:
Break above 3320 for 3327, 3330, 3335, 3345, 3347 and above that 3362 in extension of the move
Break below 3310, for 3306, 3297, 3295, 3280, 3266 and 3255 in extension of the move
Even the scalping levels are HUGE!
Please do support us by hitting the like button, leaving a comment, and giving us a follow. We’ve been doing this for a long time now providing traders with in-depth free analysis on Gold, so your likes and comments are very much appreciated.
As always, trade safe.
KOG

Gold under Selling pressureTechnical analysis: Gold is being kept below the Hourly 4 chart’s Resistance zone of #3,292.80 - #3,300.80 despite the rejection on DX and continuous rise on equities, Gold didn’t manage to prepare the terrain for further the uptrend, according to my Technical estimations. Besides the High Selling Volume and evident Price-action showcasing of Bearish trend switch, #3,262.80 Support I mentioned which was about to be tested was invalidated and naturally Gold is on a decline (as I expected it throughout my recent remarks) and is Technicals what's keeping Gold Lower, relative to circumstances. Regardless of that, the Daily chart’s Support (Medium-term) is Trading just few points below, at #3,200.80, if broken it can open doors for #3,127.80 extension and Support mark test and is alone a positive development for Sellers ahead of the end of the Trading week.
My positions: All my Selling order are concluded at this point.

XAUUSD: Channel Up aiming for 3,750Gold has turned bullish again on its 1D technical outlook (RSI = 65.582, MACD = 62.840, ADX = 38.882) as it crossed above the 4H MA50 again, following a bottom on the HL trendline of the 4H Channel Up. The 4H RSI made a DB and the new bullish wave is already underway. We expect a similar +18% rally to the top of the Channel Up (TP = 3,750).
## If you like our free content follow our profile to get more daily ideas. ##
## Comments and likes are greatly appreciated. ##

Short gold, gold may continue to fall to 3245-3235Fundamentals:
1. Focus on the performance of US economic data and the dynamics of the Federal Reserve;
2. Pay attention to whether the geopolitical conflicts will escalate, including the situation between India and Pakistan, Russia and Ukraine, and the situation between the United States and Iran, etc.
Technical aspects:
The rebound momentum of gold has gradually weakened, and gold has failed to effectively break through the 3320-3330 resistance zone many times recently, and has built multiple short-term top structures in this area, which has limited the height of gold rebound and further strengthened the bearish sentiment in the market, which is conducive to further decline of gold. In addition, gold has tested the area near 3260 many times, which has weakened the support strength of this area to a certain extent. Gold may fall below this area at any time and continue to the 3245-235 zone.
Trading strategy:
Consider shorting gold again with the 3315-3325 zone as resistance, and expect gold to fall below 3260 and continue to the 3245-3235 zone.

Falling towards pullback support?The Gold (XAU/USD) is falling towards the pivot and could bounce to he 1st resistance which has been identified as a pullback resistance.
Pivot: 3,361.29
1st Support: 3,310.00
1st Resistance: 3,490.34
Risk Warning:
Trading Forex and CFDs carries a high level of risk to your capital and you should only trade with money you can afford to lose. Trading Forex and CFDs may not be suitable for all investors, so please ensure that you fully understand the risks involved and seek independent advice if necessary.
Disclaimer:
The above opinions given constitute general market commentary, and do not constitute the opinion or advice of IC Markets or any form of personal or investment advice.
Any opinions, news, research, analyses, prices, other information, or links to third-party sites contained on this website are provided on an "as-is" basis, are intended only to be informative, is not an advice nor a recommendation, nor research, or a record of our trading prices, or an offer of, or solicitation for a transaction in any financial instrument and thus should not be treated as such. The information provided does not involve any specific investment objectives, financial situation and needs of any specific person who may receive it. Please be aware, that past performance is not a reliable indicator of future performance and/or results. Past Performance or Forward-looking scenarios based upon the reasonable beliefs of the third-party provider are not a guarantee of future performance. Actual results may differ materially from those anticipated in forward-looking or past performance statements. IC Markets makes no representation or warranty and assumes no liability as to the accuracy or completeness of the information provided, nor any loss arising from any investment based on a recommendation, forecast or any information supplied by any third-party.

Gold Short: Update to wave counts and H&SThis is an update to the Gold short idea that I posted yesterday. I showed how we can draw another head-and-shoulders and demonstrated how to use Fibonacci extensions set take profit targets.

Gold: trade tariffs relaxationAs trade tariffs “war” entered into relaxation mode, so the price of gold was easing during the previous week. The major event concerning trade tariffs during the previous week was the announcement from China's government that they are considering negotiations with the US Administration regarding imposed tariffs. Additional influx came also from better than expected US jobs data, in which sense, gold was trading with a modest negative sentiment during the week. The week started by testing the $3.350 short term resistance line, however, it ended at the level of $3.240.
The RSI turned away from the overbought market side, and ended the week at the level of 53. This level still does not represent a clear sign that the market is ready to take the turn toward the oversold market side. Moving averages of 50 and 200 days, without change, continue to move as two parallel lines with an uptrend.
Fundamentals have driven the price of gold to the ATH in a previous period, so fundamentals will continue to impact the price of gold also in the future period. Trade tariffs were the main driver, so as the trade war is settling down, the price of gold might ease also in the coming period. Gold is currently testing the level from the mid-April this year. In case that it is breached, then the next potential level for gold might be around $3.150. Certainly, it should be considered that the FOMC meeting is scheduled for May 7th, which might bring some volatility back on the market, considering current market sensitivity regarding potential Fed's rate cut. At this moment on charts, the price of gold has equal probabilities for a move both toward the up, and down side.
GOLD BUY?Market is reacting to daily area on Daily time frame. Based on 4HR TF, the market seems to be forming a possible reversal pattern which could lead to a possible reversal.
We could see BUYERS coming in strong should the current level hold.
Disclaimer:
Please be advised that the information presented on TradingView is solely intended for educational and informational purposes only.The analysis provided is based on my own view of the market. Please be reminded that you are solely responsible for the trading decisions on your account.
High-Risk Warning
Trading in foreign exchange on margin entails high risk and is not suitable for all investors. Past performance does not guarantee future results. In this case, the high degree of leverage can act both against you and in your favor

Gold Trade Plan 25/04/2025Dear Traders,
There is no strong bullish momentum observed in gold, and it seems to be moving within a descending channel. Meanwhile, the dollar index has entered a reversal phase. I expect the price to drop into the 3220–3230 zone to gather momentum, A new update will be shared soon.
If you enjoyed this forecast, please show your support with a like and comment. Your feedback is what drives me to keep creating valuable content."
Regards,
Alireza

Will gold fall after encountering resistance at its high point?Gold surged after opening yesterday. Although it retreated slightly, it continued to maintain its strong pace. So far, it has reached 3386, with an increase of about 150 US dollars. 3386 is a short-term suppression level. If it breaks below 3350 in the Asian session, the steady idea is to wait for a rebound and then short it to see the downward trend. The focus below is on the support of 3272. Overall, the short-term operation strategy for gold is to short on rebounds and to buy on pullbacks. The short-term focus on the upper side is 3386-3390 resistance, and the short-term focus on the lower side is 3320-3300 support.
Strategy: Short gold in batches around 3380-3385 when it rebounds, stop loss at 3391, target around 3350-3330, break to target 3320

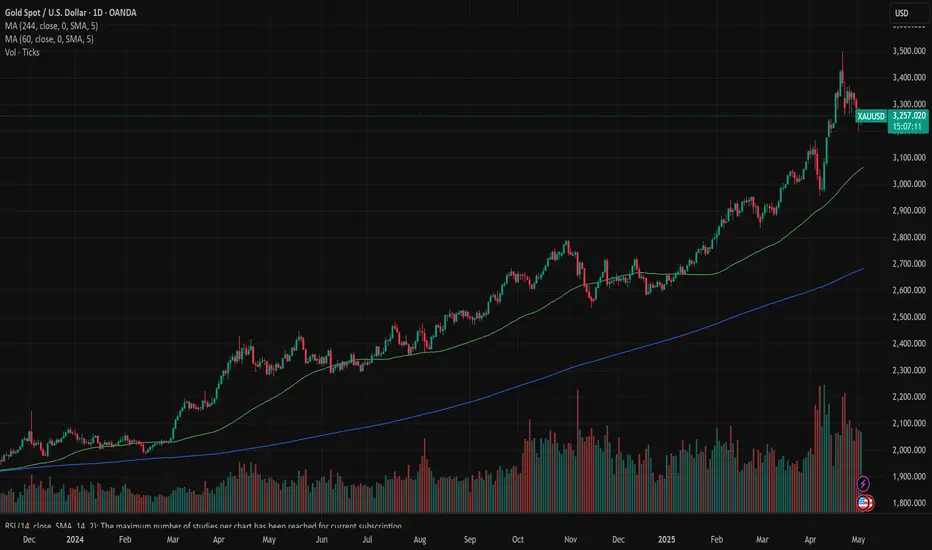
GOLD MARKET ANALYSIS AND COMMENTARY - [May 05 - May 09]This week, the international OANDA:XAUUSD has dropped sharply from 3,352 USD/oz to 3,201 USD/oz and closed the week at 3,240 USD/oz.
The reason for the sharp drop in gold prices is that US President Donald Trump said that the US is about to reach a trade agreement with India, Japan, South Korea, and is likely to reach a trade agreement with China, although the two sides have not had any official negotiations.
In addition, an equally important factor is that China is on holiday from May 1 to May 5, so the demand for transactions in the world's largest gold consuming country is almost non-existent. While they have been continuously buying before even though the gold price was high.
The FED meeting on May 6-7 may have a strong impact on gold prices next week. US GDP in the first quarter grew by -0.3%, while the labor market still has potential tariff risks; inflation remains stable at a high level. With these data, it is likely that the FED will maintain interest rates at current levels, but may signal that a rate cut is coming soon. According to many experts, if the FED signals that it will cut interest rates after the meeting next week, it will push gold prices to recover next week. On the contrary, if the FED maintains a wait-and-see attitude, declaring that it is not in a hurry to cut interest rates, then gold prices next week may continue to adjust.
🕹SOME DATA THAT MAY AFFECT GOLD PRICES THIS WEEK:
Next week, all eyes will be on the Federal Reserve’s monetary policy meeting on Wednesday, with an interest rate decision and a press conference from Chairman Jerome Powell following keynote remarks earlier in April.
Fed officials will then continue their participation in the Reykjavik Economic Conference in Iceland on Friday. Fed Governors Michael Barr, Lisa Cook, Philip Jefferson and Christopher Waller will be present at the conference as speakers in panels on topics including artificial intelligence, employment and monetary policy research.
In addition, investors will also watch the ISM services PMI on Monday morning and the weekly jobless claims number on Thursday.
📌Technically, if gold prices fall below $3,200/oz next week, there is a possibility of a further decline to $3,129/oz. A deeper correction could see gold prices fall to $2,980-$3,000/oz next week. If gold prices reverse and break the $3,270/oz barrier, they could continue to rise above $3,350/oz.
Notable technical levels are listed below.
Support: 3,228 – 3,163USD
Resistance: 3,245 – 3,267 – 3,292 – 3,300USD
SELL XAUUSD PRICE 3311 - 3309⚡️
↠↠ Stop Loss 3315
BUY XAUUSD PRICE 3119 - 3121⚡️
↠↠ Stop Loss 3115

GOLD (XAUUSD) : Is it the bearish time?!Hello guys!
Key Elements:
Internal Trendline (broken): A previously respected trendline is now broken, indicating a potential shift in trend.
S&D (Supply & Demand) Zone: Located around the $3,280–$3,300 region.
Bearish Rejection Zone: Price attempted to push higher into the $3,360–$3,380 resistance zone but was rejected.
Arrow Indicating Bearish Target: Projected move toward $3,245.94.
why:
1. Trendline Break
The internal bullish trendline has been decisively broken, a classic sign of a trend reversal or at least a significant pullback.
After the break, price retested the underside of the trendline, failed to reclaim it, and showed bearish pressure.
2. Supply Zone Rejection
A clear rejection occurred from a supply zone ($3,360–$3,380), evidenced by long wicks and bearish candles.
This confirms the presence of sellers and likely distribution at that level.
3. Volume Profile Insight
The point of control (POC) and high-volume node sit around the $3,245 region, which also aligns with the marked bearish target.
Price is likely to be drawn toward this level as it's a fair value area where previous consolidation occurred.
4. S&D Flip
A previously bullish demand zone (around $3,280) has now become a resistance level, confirming a shift in market sentiment.
🔻 Bearish Scenario:
Target: $3,245.94
Confirmation: Failure to close above $3,360 and continued lower highs suggest bearish continuation.
✅ Confluence Factors Supporting a Move Down:
Trendline break and successful retest.
Rejection from resistance (supply zone).
Lower high formation.
Volume profile attraction to a lower value area.
Bearish market structure forming.
____________________
📌 Conclusion:
This chart setup suggests a short-term bearish bias for Gold Spot (XAU/USD), with a potential drop toward the $3,245 zone. Traders may consider watching for confirmation via continued bearish price action and potential volume increase on the next leg down.

When will gold's plunge bottom out?For gold on Monday, it can rely on the 3264-3268 line of pressure to continue shorting, and the limit of the pullback cannot exceed the 618 position of 3275, which is the watershed. The support below is 3222-3224. If it breaks, it will hit the low point of 3201-3202, which may not be maintained.

PATIENCE WILL PAY OFF 〉LONG TERM BUY COMING SOON.As illustrated, I'm trying to visualize what the next couple of weeks could look like.
Taking into consideration the fact that May + June are corrective months for gold historically (don't believe me; check the seasonality tool...) , Is likely for price to range up and down within quite a wide range anywhere between 3300 and 3100 before it enters a bullish continuation impulse by the end of June and into first week of July.
( I have illustrated 2 potential buying areas; one closer to price and another extended one lower )
That being said, one must adapt to such market conditions that will only offer certain structure offering a few intraday trades, but mostly short term trades or quick scalping moves all within a same trading session, simply because as each session comes in, they will target previous sessions highs or lows (ranging back and forth in an uncomfortable manner and without a clear direction).
Asia would target Sydney's open, then London might target Asia's open, then NY might target any low or high in the opposite direction... and so on back and forth without truly holding a bullish or bearish structure longer than a few hours to a full calendar day before it turns around (sideways behavior).
As price reaches "stronger psychological" price levels like 3150, 3100, 3050 and potentially 3000; then you might start seeing evident rejections within higher timeframes (4H and 1D); ideally seeing rejection wick/s followed by a nice push up showing true power and volume to the upside, potentially signaling the bottom of this correction phase.
TIME should be aligned with this market behavior; that means that checking the seasonality tool. every year (on average 5, 10 and 15 years), gold makes a bottom during the first week of JULY ...
So... market structure, price, and time must be aligned correctly and it will all make sense whenever that moment comes; hence, the title of this idea.
I am personally not worried about any sort of economic event; news are only gas for the market to move and create liquidity and volatility.
AT THIS POINT, THE ONLY THING THAT COULD TRIGGER A SIGNIFICANT MOVE IN GOLD, IS A GEOPOLITICAL EVENT THAT WOULD TRULLY TRIGGER UNCERTAINTY IN THE MARKETS... .
--
GOOD LUCK!
Persaxu

GOLD drops sharply to $43, important support areaOANDA:XAUUSD encountered a sudden sell-off in early Asian trading on Thursday (May 1). The current price of gold is around $3,245/ounce, down sharply by $43 on the day and at a key technical position.
OANDA:XAUUSD fell for a third consecutive day as signs that trade talks between the United States and China may be progressing reduced demand for safe-haven assets, Bloomberg reported on Thursday. China Central Television said the United States has been in touch with China through various channels.
Bloomberg noted that concerns about the global trade outlook were also eased by news that the Trump administration was close to announcing the first of a series of deals that would reduce planned tariffs on several countries.
OANDA:XAUUSD have risen about 25% this year, largely as investors flocked to the safe-haven asset as U.S. President Donald Trump’s rapidly shifting trade policies have roiled markets and stoked fears of a global economic slowdown.
However, inflows into gold ETFs, central bank buying and strong speculative demand from China will also provide fundamental support for gold prices.
Looking ahead, Friday’s US non-farm payrolls report could reveal the initial impact of Trump’s trade policies on the economy.
Technical Outlook Analysis OANDA:XAUUSD
On the daily chart, gold is trading at a crucial support area for long-term bullish expectations with support from Ema21 converging with the 0.50% Fibonacci retracement. If gold is sold below $3,228, it could continue to decline further with a target of around $3,163 in the short term, the price point of the 0.618% Fibonacci retracement.
On the other hand, the Relative Strength Index (RSI) is also approaching the 50 level after a period of correction, which in this case acts as the nearest support.
It can be said that with the current position, gold has the most support with EMA21 converging with Fibonacci retracement 0.50% in terms of trend, and RSI approaching 50 is support in terms of momentum.
During the day, the current position still shows that gold has the potential to increase in price and the notable positions will also be listed as follows.
Support: 3,245 - 3,228 USD
Resistance: 3,267 - 3,292 USD
SELL XAUUSD PRICE 3295 - 3293⚡️
↠↠ Stop Loss 3299
→Take Profit 1 3287
↨
→Take Profit 2 3281
BUY XAUUSD PRICE 3195 - 3197⚡️
↠↠ Stop Loss 3191
→Take Profit 1 3203
↨
→Take Profit 2 3209
