Gold: Bearish Shooting Star Reversal?The trend in gold is higher and no doubt it can go higher still.. BUT
There is a possible short setup
because:
A) It's very overbought relative to its weekly average
B) A Weekly shooting star reveral pattern took place on the weekly chart
C) The daily chart shows a possible breakdown
Thoughts?
GOLD trade ideas

XAUUSD COT and Liquidity AnalysisHey what up traders welcome to the COT data and Liquidity report. It's always good to go with those who move the market here is what I see in their cards. I share my COT - order flow views every weekend.
🎯 Non Commercials reduced their longs exposure by more then 50K. Its seem to me like the momentum is slowing down and pullback will be healthy here
📍Please be aware that institutions report data to the SEC on Tuesdays and data are reported on Fridays - so again we as retail traders have disadvantage, but there is possibility to read between the lines. Remember in the report is what they want you to see, that's why mostly price reverse on Wednesday after the report so their cards are hidden as long as possible. However if the trend is running you can read it and use for your advantage.
💊 Tip
if the level has confluence with the high volume on COT it can be strong support / Resistance.
👍 Hit like if you find this analysis helpful, and don't hesitate to comment with your opinions, charts or any questions.
Analysis done on the Tradenation Charts
Disclosure: I am part of Trade Nation's Influencer program and receive a monthly fee for using their TradingView charts in my analysis.
"Adapt what is useful, reject what is useless, and add what is specifically your own."
— David Perk aka Dave FX Hunter ⚔️

What is gold waiting for? Stuck in the 3300 area⭐️GOLDEN INFORMATION:
Gold price (XAU/USD) fails to build on Monday’s rebound from the key $3,265–$3,260 support zone, encountering renewed selling pressure during the Asian session on Tuesday. Although signals from the US and China remain mixed, investor sentiment remains buoyed by hopes of a potential easing in trade tensions between the world’s two largest economies. Additionally, signs of advancement in tariff negotiations have further bolstered optimism, dampening the appeal of the safe-haven metal.
⭐️Personal comments NOVA:
Gold price needs to be boosted by economic news to break out of the sideways price range around 3300, continue to wait today around 3300
⭐️SET UP GOLD PRICE:
🔥SELL GOLD zone : 3366- 3368 SL 3373
TP1: $3350
TP2: $3340
TP3: $3330
🔥BUY GOLD zone: $3267 - $3265 SL $3260
TP1: $3280
TP2: $3300
TP3: $3318
🔥BUY GOLD zone: $3301 - $3299 SL $3296 scalping
TP1: $3305
TP2: $3310
TP3: $3320
⭐️Technical analysis:
Based on technical indicators EMA 34, EMA89 and support resistance areas to set up a reasonable SELL order.
⭐️NOTE:
Note: Nova wishes traders to manage their capital well
- take the number of lots that match your capital
- Takeprofit equal to 4-6% of capital account
- Stoplose equal to 2-3% of capital account

Gold another long 3285$ area is a nice long opportunity.
Let us wait for the price action to unfold.

XAU/USD For Bearishwait for pull-back near by entry point and then go short
general trend is up trend
current phase is pull-back
have fun :)

Again Sell at 3305As Market is moving still in Falling wedge from 3330-3270
Key area 3305-3307
What possible scenario we have?
Bearish scanario:
- market Is in falling wedge channel
-if market give closing below 3305 (body of candle)then ready for the next Drop towards 3280 then 3250
Bullish Scenario:
- 3305 multiple rejection support resistance cluster
-if candles remains above 3305-3308 then buy owards 3330 then 3380 target
Overall im on bearish on THIS chart

XAU / USD 2 Hour Chart ( Sell Scalp Trade )Hello traders. Per my last analysis. I took the Sell from the line marked on the chart. And I showed how and where I closed portions of the trade and where I exited the trade. This may be my one trade for the week. I can see some more downside after we possibly push back up during the Pre NY volume / NY open to take out anyone holding short positions. Great scalp trade today. Big G gets a shout out. I will post another chart in the next few hours. Be well and trade the trend.

Gold Ideas - April 29th, after NEWS - Jolts Job Openings🔥 GoldMindsFX – Intraday Trade Plan (April 29 PM NY)
US JOLTS missed (7.19M vs 7.48M).
Mixed narrative with CB Consumer Confidence = high probability of NY whipsaws, liquidity games, and no clean trend.
PA still trapped in a Monday Range prison between 3280–3350. Boss fight still pending.
🟥 SELL ZONES
Sell Zone 1: 3317–3330
🔸 Previous NY reaction high + last upside liquidity sweep
🔸 Confluences: EQ retest, M15 FVG, weak internal BOS
📍 Entry only on LTF bearish rejection
🔻 SL: Above 3332
🎯 TP1: 3306
🎯 TP2: 3288
🎯 TP3: 3265
⚠️ Risk: If 3330 breaks impulsively, step aside
Sell Zone 2: 3350–3360
🔸 Major HTF rejection zone
🔸 Psychological sell trigger
📍 Entry after M15/M5 confirmation (CHoCH + engulfing preferred)
🔻 SL: Above 3363
🎯 TP1: 3317
🎯 TP2: 3288
🎯 TP3: 3260
✅ Confidence: Very high — but price may not reach it today
🟩 BUY ZONES
Buy Zone 1: 3280–3288
🔸 Protected Asia/NY lows
🔸 Previous demand sweep zone + micro bullish CHoCH
🔸 Strong bounce history
📍 Look for M5/MS flip + OB/FVG combo
🛡️ SL: Below 3275
🎯 TP1: 3306
🎯 TP2: 3317
🎯 TP3: 3330
⚠️ Risk: Rejection from 3306 must be watched for trap spike
Buy Zone 2: 3260–3265
🔸 Deep liquidity grab zone
🔸 Untapped OB + M15 imbalance
🔸 Full sweep of Asia and NY structural lows
📍 Enter on M1–M5 confirmation (mini CHoCH + FVG)
🛡️ SL: Below 3254
🎯 TP1: 3288
🎯 TP2: 3306
🎯 TP3: 3317
❄️ Patience required — only active if NY dumps hard
📌 Important Notice!!!
The above analysis is for educational purposes only and does not constitute financial advice. Always compare with your plan and wait for confirmation before taking action.
🖊️ If these insights help you refine your trading plans, give us a boost and follow GoldMindsFX on TradingView. Let's grow together! 🛡️

GOLD scenario 30.04.2025English : According to our analysis, we anticipate a BULLISH scenario.
Morocan Darija : kanchofo d'apres l'analyse dyalna antsanaw TLOO3
ATENTION : I only share my ideas, not signals

Gold insights: 30-APRIL-2025Rise and shine, traders! Start your day with actionable Gold insights. Let's grow your skills together, one chart at a time.

GOLD gold will experience sharp drop after seeing some poor buy power and inability to break past 3350-3352. the 3200 level will be watched.
XAU/USD 30 April 2025 Intraday AnalysisH4 Analysis:
-> Swing: Bullish.
-> Internal: Bullish.
Analysis and bias remains the same as analysis dated 23 April 2025
Price has now printed a bearish CHoCH according to my analysis yesterday.
Price is now trading within an established internal range.
Intraday Expectation:
Price to trade down to either discount of internal 50% EQ, or H4 demand zone before targeting weak internal high priced at 3,500.200.
Note:
With the Federal Reserve's dovish stance and persisting geopolitical uncertainties, heightened volatility in Gold is expected to continue. Traders should proceed with caution and adjust risk management strategies in this high-volatility environment.
Price could also be driven by President Trump's policies, geopolitical moves and economic decisions which are sparking uncertainty.
H4 Chart:
M15 Analysis:
-> Swing: Bullish.
-> Internal: Bearish.
Analysis and Bias remains the same as analysis dated 24 April 2025.
Price printed as per my note yesterday whereby I mentioned that we should be surprised if price printed a bearish iBOS as all HTF's require a pullback.
Price subsequently printed a bearish iBOS which confirms internal structure.
Intraday Expectation:
Price has traded up to just short of premium of internal 50% EQ where we are seeing a reaction. Price could potentially trade further into premium of 50%, or H4/M15 nested supply zone before targeting weak internal low priced at 3,260.190.
Note:
With the Federal Reserve maintaining a dovish stance and ongoing geopolitical tensions, volatility in Gold prices is expected to remain elevated. Traders should exercise caution, adjust risk management strategies, and stay prepared for potential price whipsaws in this high-volatility environment.
Trump's tariff announcement will most likely cause considerably increased volatility and whipsaws.
M15 Chart:

Gold Short: H&S and Wave 3 downOver here, I've labelled all the waves breakdown as well as drawing a tilted head-and-shoulders. I believe that we are going into a wave 3 (minute degree) that is supported by the formation of the right shoulder.
I expect the neckline to be broken which will then goes down to the first resistance provided by the lower blue trendline.
The next resistance in green will be our first TP target. This is where we can choose to reduce the position, or to adjust the stop loss down in order to ride the position. As the lower target cannot be seen without squeezing the chart and causing the waves breakdowns to be unclear, I will update again when that happens.
The stop loss is above the right shoulder.
Good luck!

Gold: A Complex Outlook After Reacting Near 3,500Gold: A Complex Outlook After Reacting Near 3,500
In today's video, I discussed potential price movements for gold in the coming days. While the overall trend remains bullish, uncertainty is still present.
Be cautious—gold’s direction is not fully clear yet, despite the strong upward momentum. Key price levels and market reactions will help shape the next moves.
You may find more details in the chart!
Thank you and Good Luck!
❤️PS: Please support with a like or comment if you find this analysis useful for your trading day❤️

XAU/USD: Bull or Bear? (READ THE CAPTION)By analyzing the gold chart on the 30-minute timeframe, we can see that yesterday, right after posting the analysis, the price quickly hit the first target at $3307, then experienced a bounce and rallied to the $3369 supply zone. From there, gold faced more downward pressure and eventually reached the targets at $3303, $3297, and nearly $3285.
Currently, gold is trading around $3291, and if $3285 is broken, we could expect further downside toward levels below $3259.
Please support me with your likes and comments to motivate me to share more analysis with you and share your opinion about the possible trend of this chart with me !
Best Regards , Arman Shaban

XAUUSDIs XAUUSD building for massive breakout?
If XAUUSD sustains 3300 level then it can target 3400 in no time.

GOLD: Long Signal with Entry/SL/TP
GOLD
- Classic bullish formation
- Our team expects growth
SUGGESTED TRADE:
Swing Trade
Buy GOLD
Entry Level - 3313.0
Sl - 3305.4
Tp - 3327.9
Our Risk - 1%
Start protection of your profits from lower levels
Disclosure: I am part of Trade Nation's Influencer program and receive a monthly fee for using their TradingView charts in my analysis.
❤️ Please, support our work with like & comment! ❤️

Gold - $3,500 All-Time High! When Will The New Highs Form?It's been a good run throughout 2025 with little to no drawdown week in, week out. Only 3 bearish weekly closures in 2025 but i believe we wil be seeing a few more of them as the Dollar Index is starting to pivot.
On a lookout for low hanging fruit PD arrays; 1st point of interest is $3,260 with the overall draw to $3,193 - $3,167 being the stretch target

gold to 3270on chart buyside has been raided price proceeded south. currently price is failing to uphold on 15 min bullish fvg. i want to see price accelerate to smooth lows at 3270

#XAUUSD: We are up 1040+ pips from our previous setup! Gold has risen from 3268 to 3364, helping us make substantial positive gains. However, after reaching the $3364 region, the price dropped around 3310 and has since been fluctuating between 3310 and 3340, making it challenging to trade. There’s a possibility that the price might touch 3400 once again before it drops.
Good luck and trade safely.
Thanks for your support! 😊
If you want to help us out, here are a few things you can do:
- Like our ideas
- Comment on our ideas
- Share our ideas
Team Setupsfx_
❤️

Analysis on the 10 Elite PairsYou can follow us for more Analysis(Images and Videos) with Precise definition of the Financial Market.ENJOY!!!

Gold Trade plan 29/04/2025Dear Traders,
Gold is still ranging within a triangle pattern. I believe that, considering the dollar index is at a bottom and there’s a potential for a 300-pip rise, gold may come under selling pressure. That said, as long as the price remains inside the triangle, it’s better to stay on the sidelines and wait to see which side the triangle breaks. If there’s an upward breakout, I consider the 3380–3400 area a suitable zone for selling.
if you enjoyed this forecast, please show your support with a like and comment. Your feedback is what drives me to keep creating valuable content."
Regards,
Alireza

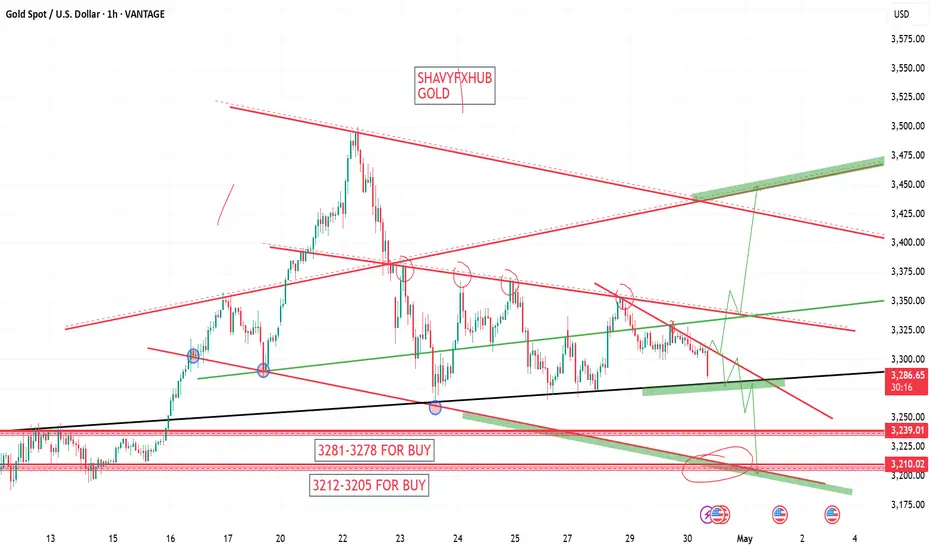
XAU/USD Elliott Wave Count: Preparing for Final ImpulseXAU/USD appears to be in a textbook 5-wave impulsive structure on the 4H chart, with the market now completing Wave 4 as a classic ABC corrective flat/pennant.
The impulsive move from the Wave 2 low has formed clear internal substructures, with Wave 3 exhibiting extended price action, consistent with Elliott Wave guidelines.
Currently, price is consolidating in a contracting pattern labeled Wave 4 (A-B-C), which looks to be near completion. Based on wave symmetry and Fibonacci projections, a strong upside move is anticipated once Wave 4 concludes, leading into the final Wave 5 rally.
Entry Zone: 3286.875
Target: 3367.440– 3410.210
Stop Loss: Below 3260.190.
