Gold is expected to pull back, short gold!Fundamentals:
Focus on the Fed's interest rate decision and Powell's speech;
I think the Fed will keep the interest rate decision unchanged this time, at least it will not announce a rate cut this time, which may suppress the gold market;
Technical aspects:
Before the Fed's interest rate decision, gold is currently in a volatile state. However, relatively speaking, it is currently in a volatile and bearish state, with short-term resistance in the 3395-3405 area; and gold has repeatedly tested the 3370-3360 below during the retracement process. After multiple tests, gold may be more likely to break through this support area; the key support below is in the 3360-3350 area, followed by the 3320-3310 area.
Trading strategy:
Consider shorting gold in the 3395-3405 area, TP: 3370-3360
GOLDCFD trade ideas

GOLD - Is this the end of the Bull Run?Gold has once again followed my previous analysis — turning bearish right at key levels! 🚩 After an incredible bull run where price kept making new highs, signs are now pointing to a possible top. We could be entering a short-term bearish phase here, with potential for a deeper correction if momentum builds.
Right now, I’m holding a bearish bias. I’ll be watching for solid sell setups, especially around those well-defined resistance zones. There’s also an unfilled gap below that could attract price action — keep an eye on that level (chart shows the zone clearly 🔎).
I’ll be looking for confirmation through structure breaks and clean retests before entering shorts.
What’s your take — are we seeing a reversal brewing, or is this just a dip before the next leg up? Drop your thoughts below!
If this analysis helps, a boost or follow would mean a lot — and keeps you in the loop for the next moves! 🚀

XAUUSD Price Action: Bullish Break + Liquidity Sweep Trade Idea🪙✨ Gold (XAUUSD) Technical Outlook ✨📈
I’m currently analyzing XAUUSD on both the daily and 4H timeframes, and here’s what I’m seeing:
🚀 Price has broken bullish structure and is now looking overextended, pushing into a buy-side liquidity zone—clearly visible to the left of current price action. 💰📊
It’s clearing buy stops, which could trigger a retracement soon. 🧲🔁
🎯 I’m watching closely for a pullback into the 50%–61.8% Fibonacci retracement zone on the current price swing—that’s my key point of interest for a potential long setup, provided we see a healthy pullback followed by another bullish break of structure. 🔍🔐
🧠 Not financial advice—just my personal analysis. Always manage risk. ⚠️📉

GOLD Will Grow! Buy!
Please, check our technical outlook for GOLD.
Time Frame: 4h
Current Trend: Bullish
Sentiment: Oversold (based on 7-period RSI)
Forecast: Bullish
The market is approaching a key horizontal level 3,257.82.
Considering the today's price action, probabilities will be high to see a movement to 3,352.14.
P.S
We determine oversold/overbought condition with RSI indicator.
When it drops below 30 - the market is considered to be oversold.
When it bounces above 70 - the market is considered to be overbought.
Disclosure: I am part of Trade Nation's Influencer program and receive a monthly fee for using their TradingView charts in my analysis.
Like and subscribe and comment my ideas if you enjoy them!

gold still is in bullish side!!!we should just buy gold in deeps guys...every steps down in gold is an goooooood chance to buy it and hold it for saving money an make profit...just buy buy buy gold in deeps and corrections

Gold 100% Profit SignalThe daily level shows that the price of gold fell after a strong rebound for two consecutive days, indicating that the selling pressure from above is significant and there is a need for technical correction in the short term. The current price has retreated to the vicinity of the key psychological level of $3,400, which is the support area of the previous breakthrough gap. If it fails, it may further drop to the level of $3,350. In terms of technical indicators, RSI has fallen from the overbought area, and the MACD red column has shrunk and there are signs of a dead cross, indicating that the bullish momentum has weakened. In addition, the 5-day moving average shows a downward trend. If the gold price fails to re-stand on the resistance level of $3,440, it will confirm the formation of a short-term top structure. Overall, gold is in a high-level shock consolidation stage. If there is a lack of new risk aversion drivers, the adjustment cycle may continue. Although geopolitical risks continue to exist, the current financial market is more focused on the evolution of global trade sentiment, resulting in a phased weakening of the attractiveness of traditional safe-haven assets. In the long run, gold still has fundamental support, but in the short term it may be affected by the strength of the US dollar and the recovery of risk appetite. In terms of operating strategy, it is recommended to focus on low-level buying on pullbacks and high-level selling on rebounds. Pay attention to the resistance in the 3405-3430 area on the top and the support in the 3360-3350 range on the bottom.
In the early Asian session, gold prices showed a rapid correction trend. The key support band below is concentrated in the 3356-3363 area, which is the long defensive fortress of the previous upward trend. The technical pattern shows that if the support is confirmed by the retracement, long orders can be arranged in this area, and the low-long idea remains unchanged. The key watershed of the short-term bullish trend is in the 3340-3345 range. The loss of this position will change the short-term strong pattern. The daily level maintains a bullish control structure, and the operation suggestion is to focus on low-long after the correction stabilizes.
Operation strategy:
1. Go long when gold falls back to 3355-3365, and add more when it falls back to 3346-50, stop loss at 3338, target 3386-3395.

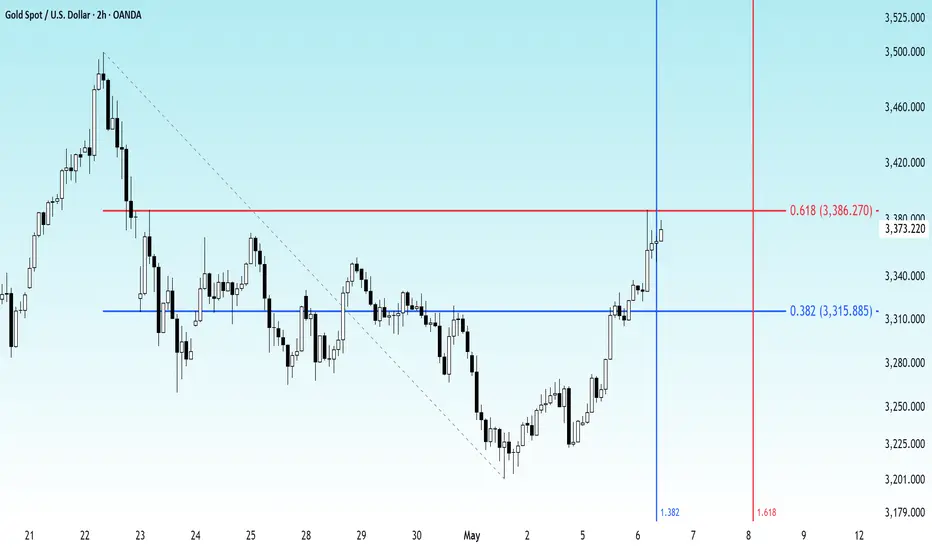
Valid or fake out? - [1H] formationHere is what I noticed—let me know if this aligns with your perspective or if you see something different.
📌 Wave Structure Alignment
Wave A → C → E show corrective declines within the contracting triangle.
Wave B → D retrace in a controlled manner, respecting contraction limits.
Price tightening near 3392 - 3360, signaling absorption before a breakout move.
📌 Fibonacci Relationship Check
Wave A retraced ~38.2% - 61.8% of the previous impulse move.
Wave B & C followed standard corrective depths (~50% - 78.6%), aligning with expected fib levels.
Wave E represents the final squeeze (~38.2% - 61.8% of Wave D), acting as a breakout trigger.
📌 Liquidity Positioning & Institutional Play
Bullish Breakout Potential: A strong push above 3417 could activate momentum toward 3440 - 3510, but only if absorption transitions into expansion.
Bearish Breakdown Risk: If price rejects 3392, expect a liquidity grab driving price into 3303 - 3370 range.
💡 Verdict: What to Watch Next
The triangle structure appears valid, following typical Fibonacci relationships and smart money positioning. However, the breakout direction remains uncertain—monitor liquidity behavior closely before confirming entry.
📌 Key Levels in Play
🔹 3378 Retest: A crucial resistance zone—failure to reclaim suggests strong sell pressure.
🔹 Break Above: If buyers absorb selling pressure, the move could extend past 3385 pivot, favoring bulls.
🔹 Failure to Hold: A rejection at 3378 could induce fast liquidation, sending price toward 3363 and below.
🔥 Smart Money Perspective
Institutions may test 3378 multiple times before deciding the next move.
If absorption strengthens , price may lean bullish.
If rejection dominates , expect a fast downward sweep into 3339 - 3326 range.
The liquidity game is in play—what’s your take on this setup? Anything you’d fine-tune based on current order flow? 🚀🔥 Would love to hear your perspective!

GOLD XAUUSDCurrently has shown high support around 3200. we believe it can retest 3200 once again. Best buying opportunity are around 3200 and 3175.
write me any questions in the comment below. I will answer

Global central banks are increasing their holdingsGold hit a low of 3323 in the morning and then began to rebound strongly, reaching a high of 3386, then fell to a low of 3352, and rebounded to 3372. Gold made a slight correction near 3365 for a while, then fell to 3350, and now rebounded to 3368. There is less than an hour left before the European session. It is currently in the middle of the strong stretch in the morning. Now, gold still has some room for stretching. The upper resistance is currently at 3374-3377, which is expected to be the highest level today, and the lower support is 3340-3330. It is recommended to rebound short.
Operation strategy 1: It is recommended to rebound short at 3374-3378, stop loss at 3384, and the target is 3355-3325.

Gold is in the Bearish DirectionHello Traders
In This Chart GOLD HOURLY Forex Forecast By FOREX PLANET
today Gold analysis 👆
🟢This Chart includes_ (GOLD market update)
🟢What is The Next Opportunity on GOLD Market
🟢how to Enter to the Valid Entry With Assurance Profit
This CHART is For Trader's that Want to Improve Their Technical Analysis Skills and Their Trading By Understanding How To Analyze The Market Using Multiple Timeframes and Understanding The Bigger Picture on the Charts

GOLD - A New High Is Coming?The price recently reached the 61.8% Fibonacci retracement level and at the same time, the has hit the 38.2% Fibonacci time level. This combination of price and time Fibonacci levels signals that the trend is strong and likely to continue. With this momentum, it is normal to expect a move towards a new high at 3580.
XAU / GOLD🌟 GOLD: THE BIGGEST TRADE OF SUMMER 2025
XAU/USD Forecast
📈 PHASE 1: SHORT-TERM RALLY (after small correction to 3172$)
We expect a bounce toward the $3,789–$3,800 resistance zone.
🔴 PHASE 2: THE SHAKEOUT
May 27 SELL ZONE.
After May 27, the cycle flips.
Expect a violent correction, retracing into key support around $2,880–$2,970 or even lower.
🟢 PHASE 3: THE BUY ZONE — July 13 +/- few days.
Mid-July marks the ideal long-term entry into TVC:GOLD before the explosive move.
🚀 PHASE 4: THE BREAKOUT
Target: ATH above $4,000 by late summer
Yes, EUROTLX:4K + gold is coming — but only after the market resets.

Gold short: A Video Walkthrough on AnalysisOver in this video, I went through live on how I analyze the Gold Chart (I did not prepare before hand). Here, I propose that Gold has further to to fall and set 3 different targets and how I derived the targets.

Gold/ Silver ratio - approaching a resistance pointRatio is overbought in favour of gold
Silver could start outperforming if the overhead resistance hold

5.6 Gold Market Analysis5.6 Gold Market Analysis
Gold prices rose slightly today and then entered a volatile trend. It is expected that the market will continue yesterday's trend and rise steadily.
After the gold price rises, we will wait for the high to pull back to around 3350 before going long. In the morning, the gold price encountered resistance at 3380, so technically this suppression can be used as a key reference for the future market. If it does not break 3380, there is still a risk of falling.
The rise in gold prices in the past two days, whether it is caused by news or the opening of the Asian session, we must maintain a steady rhythm.
Today's support level is 3330, and the resistance level is 3380. The strategy is to go long on the decline.
Thank you for your attention, and I hope my analysis can help you.

Gold Long Term RoadmapUsing multiple 'weight of evidence', Fibonacci, measured moves, support/resistance, distance from moving averages etc, this is what I consider to be the most likely outcome in the next few years.

GOLD: Move Up Expected! Long!
My dear friends,
Today we will analyse GOLD together☺️
The price is near a wide key level
and the pair is approaching a significant decision level of 3,260.03 Therefore, a strong bullish reaction here could determine the next move up.We will watch for a confirmation candle, and then target the next key level of 3,281.72.Recommend Stop-loss is beyond the current level.
❤️Sending you lots of Love and Hugs❤️
Gold Buy Call #XAUUSDGold has broken out of a key resistance level at, $3,265 with strong bullish momentum and above-average volume, confirming the breakout. This move is supported by rising RSI and MACD crossover, indicating strength in the trend. The breakout from the consolidation zone signals renewed investor interest, likely driven by macro uncertainty and safe-haven demand.
Traders can consider initiating long positions at current levels with a stop-loss and take profit levels defined in the charts.

Gold rises strongly and bulls restart!At present, the support of the 4-hour cycle is around 3330. If there is a chance of a decline, you can follow the bullish trend. In terms of short-term gold operation ideas, it is recommended to do more on pullbacks and short on rebounds. The upper short-term focus is on the 3415-3420 line of resistance, and the lower short-term focus is on the 3330-3350 line of support. Friends must keep up with the rhythm. It is necessary to control the position and stop loss, set stop loss strictly, and do not resist single operations.

Gold: Breakdown in Motion (15m Chart)Just price, structure, and volume — tracked in real time.
🧠 Chart Breakdown:
✅ Momentum Long — Price broke out from a base with clean volume. MA structure aligned, and bulls had control early.
⛔ Top Reversal — Price peaked and printed a clean rejection. Volume faded. Sellers rotated in.
⛔ Lower High Rejection — Attempt to reclaim highs failed fast. Fib and MA structure stacked against continuation.
⚠️ Temporary Recovery Attempt — Brief bounce off support, but no structure regained. No follow-through = no entry.
🚨 Breakdown Confirmed — Price lost all support levels with conviction. Volume backed the flush. Breakdown held and extended.
👀 Current Pressure Point — Price still pressing lows. Watching to see if momentum continues or if we get exhaustion behavior.
Always happy to be helpful.

XAUUSD , Long or Short The provided content appears to be a snapshot of a trading interface for **Gold Spot (XAU/USD)**. Here's a breakdown of key elements and their implications:
### 1. **Price Data**
- **Current Price**: 3,214.715 USD per ounce of gold.
- **Change**: -73.455 (-2.23%), indicating a significant drop in price over the observed period.
- **Bid/Ask Prices**:
- **SELL (Bid)**: 3,214.350 (price at which you can sell gold).
- **BUY (Ask)**: 3,215.050 (price at which you can buy gold).
### 2. **Price Levels**
- Listed prices (3,280.000 to 3,160.000) likely represent recent **support/resistance levels** or historical highs/lows. The cluster around 3,215–3,207 suggests a consolidation zone.
### 3. **Time Stamps**
- **13:32**, **06:00**, **12:00**, etc.: Likely mark key trading hours (e.g., London/New York sessions) or times of volatility.
### 4. **Key Terms**
- **XAUUSD 15m**: The Gold/USD pair analyzed on a **15-minute chart** (short-term trading view).
- **RTCUSD**: Possibly another asset (e.g., a commodity or currency pair) being tracked alongside gold.
- **DREW!**: Could be a custom alert (e.g., a trendline break or price target hit).
### 5. **Trading Context**
- The sharp decline (-2.23%) suggests bearish momentum. Traders might watch for:
- **Support at 3,200 or 3,160**: A break below could signal further downside.
- **Resistance near 3,215–3,231**: A rebound above could indicate a reversal.
### Actionable Insights:
- **Short-term traders**: Monitor the 15m chart for breakout/retest opportunities.
- **Risk Management**: Use stop-loss orders given the volatility.
- **"DREW!" Alert**: Investigate its trigger (e.g., technical pattern or news event).
Always cross-verify with broader market news (e.g., Fed policy, geopolitical events) to contextualize price movements.

Gold - Expecting Bullish Continuation In The Short TermH4 - We have a clean bullish trend with the price creating a series of higher highs, higher lows structure.
This strong bullish momentum is followed by a pullback.
Until the two Fibonacci support zones hold I expect the price to move higher further.
If you enjoy this idea, don’t forget to LIKE 👍, FOLLOW ✅, SHARE 🙌, and COMMENT ✍! Drop your thoughts and charts below to keep the discussion going. Your support helps keep this content free and reach more people! 🚀
--------------------------------------------------------------------------------------------------------------------
Disclosure: I am part of Trade Nation's Influencer program and receive a monthly fee for using their TradingView charts in my analysis.

GOLD ROUTE MAP UPDATEHey Everyone,
Great start to the week with our chart idea playing out perfectly inline with our plans to buy dips.
We got our bearish targets 3306 and then into the retracement range like we analysed and then the perfect bounce now heading towards our Bullish targets.
We will look for a test and break above 3344 for a continuation or failure to test and lock above this level will se price play back into the lower Goldturns for support.
We will keep the above in mind when taking buys from dips. Our updated levels and weighted levels will allow us to track the movement down and then catch bounces up.
We will continue to buy dips using our support levels taking 30 to 40 pips. As stated before each of our level structures give 20 to 40 pip bounces, which is enough for a nice entry and exit. If you back test the levels we shared every week for the past 24 months, you can see how effectively they were used to trade with or against short/mid term swings and trends.
The swing range give bigger bounces then our weighted levels that's the difference between weighted levels and swing ranges.
BULLISH TARGET
3344
EMA5 CROSS AND LOCK ABOVE 3344 WILL OPEN THE FOLLOWING BULLISH TARGETS
3367
POTENTIALLY 3390
EMA5 CROSS AND LOCK ABOVE 3390 WILL OPEN THE FOLLOWING BULLISH TARGET
3428
EMA5 CROSS AND LOCK ABOVE 3428 WILL OPEN THE FOLLOWING BULLISH TARGET
3458
EMA5 CROSS AND LOCK ABOVE 3458 WILL OPEN THE FOLLOWING BULLISH TARGETS
3478
POTENTIALLY
3503
BEARISH TARGETS
3306 - DONE
EMA5 CROSS AND LOCK BELOW 3306 WILL OPEN THE RETRACEMENT RANGE
3285 - DONE
3259
EMA5 CROSS AND LOCK BELOW 3259 WILL OPEN THE SWING RNGE
3233
3201
EMA5 CROSS AND LOCK BELOW 3201 WILL OPEN THE SECONDARY SWING RANGE
SECONDARY SWING RANGE
3159 - 3112
As always, we will keep you all updated with regular updates throughout the week and how we manage the active ideas and setups. Thank you all for your likes, comments and follows, we really appreciate it!
Mr Gold
GoldViewFX
