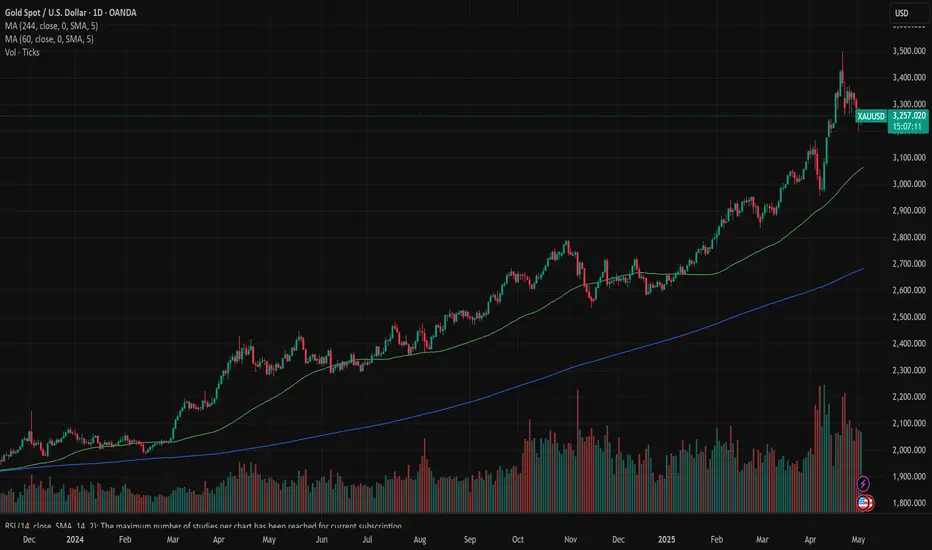
Gold's volatile decline is in line with expectationsFrom the perspective of the 4-hour cycle, a big negative line closed down, breaking the support of the 5-day and 10-day moving averages. This wave may continue to fall to the Bollinger middle rail near 3300, but if it is a high-level shock, the Bollinger middle rail is not broken, and it may rise again to the high point of 3430. In this cycle, gold has experienced a big rise and fall, and now it is possible to rise or fall. In the short-term cycle, we will first pay attention to the support effect of 3360-3350 under weakness. If it does not break, we can continue to go long and bullish, with the upper target at 3400. On the whole, the short-term operation strategy of gold is recommended to be mainly short-selling on rebounds, supplemented by long-selling on pullbacks. The upper short-term focus is on the 3400-3405 line of resistance, and the lower short-term focus is on the 3350-3300 line of support.
GOLDCFD trade ideas

YOUR SEEING THIS NOT BY ACCIDENT (GOLD SWING)
remember this idea before, way early to short right?
Now its the time to short it. initial and 2nd tp zone. probable the swing tp could be 2700-2600 or
lower.
See this a liquidity grab on internal/inside a monthly basis chart.
This is not a random as you see this, it means you trade this for Long shot or swing thot.
Guys this idea is on my self only.
This is not a financial advice.
See you again next week.
The previous news or the ADP NFP are non sense. we a make a new highs again once this idea works?
This is only my view.
sharing this could turn your idea to swing trades.
Follow for more.

Gold Trade Plan 02/05/2025-05/05/2025Dear Traders,
The descending channel is working precisely. After hitting the middle of the channel, the price started to drop. I expect another low below 3200, followed by a rise toward around $3400.
if you enjoyed this forecast, please show your support with a like and comment. Your feedback is what drives me to keep creating valuable content."
Regards,
Alireza!

XAUUSD: Channel Up aiming for 3,750Gold has turned bullish again on its 1D technical outlook (RSI = 65.582, MACD = 62.840, ADX = 38.882) as it crossed above the 4H MA50 again, following a bottom on the HL trendline of the 4H Channel Up. The 4H RSI made a DB and the new bullish wave is already underway. We expect a similar +18% rally to the top of the Channel Up (TP = 3,750).
## If you like our free content follow our profile to get more daily ideas. ##
## Comments and likes are greatly appreciated. ##

Gold: trade tariffs relaxationAs trade tariffs “war” entered into relaxation mode, so the price of gold was easing during the previous week. The major event concerning trade tariffs during the previous week was the announcement from China's government that they are considering negotiations with the US Administration regarding imposed tariffs. Additional influx came also from better than expected US jobs data, in which sense, gold was trading with a modest negative sentiment during the week. The week started by testing the $3.350 short term resistance line, however, it ended at the level of $3.240.
The RSI turned away from the overbought market side, and ended the week at the level of 53. This level still does not represent a clear sign that the market is ready to take the turn toward the oversold market side. Moving averages of 50 and 200 days, without change, continue to move as two parallel lines with an uptrend.
Fundamentals have driven the price of gold to the ATH in a previous period, so fundamentals will continue to impact the price of gold also in the future period. Trade tariffs were the main driver, so as the trade war is settling down, the price of gold might ease also in the coming period. Gold is currently testing the level from the mid-April this year. In case that it is breached, then the next potential level for gold might be around $3.150. Certainly, it should be considered that the FOMC meeting is scheduled for May 7th, which might bring some volatility back on the market, considering current market sensitivity regarding potential Fed's rate cut. At this moment on charts, the price of gold has equal probabilities for a move both toward the up, and down side.
Gold weekly chart with buy and sell levelsFrom the 4H chart you posted, here's a quick breakdown first:
Trend: We're seeing bearish pressure overall after a strong bullish leg. The price is under important retracement levels (0.382, 0.5, 0.618 Fib retracements).
Key Levels:
Strong resistance zone at 3340-3352 (aligned with Weekly Highs, Daily Highs, and a Supply Zone).
Immediate support around 3290 and 3228 (Weekly Open and previous price clusters).
Volume Delta: -3.72% macro (bearish), showing sellers have the upper hand currently.
Important Price Zones:
Sell zone: 3328-3340
Buy zone: 3228-3206
Scalping Strategy on 15-Minute (assuming London / NY crossover sessions):
Bias: Slightly bearish unless strong bullish reversal signals appear.
Ideal sessions: London Open (7-9 AM GMT) and NY Crossover (12-3 PM GMT).
Possible Scalping Setups
1. Sell Setup:
Trigger: If price retraces back up to 3328-3337 zone during London open or NY crossover and shows rejection (pin bars, engulfing patterns on 15M).
Entry: Short at around 3330-3335.
SL: Above 3345.
TP1: 3308 (Sell level on chart).
TP2: 3290.
Bonus TP: 3270 if momentum strong.
2. Buy Setup:
Trigger: If price dips into 3228-3206 (near Weekly Open) and shows bullish reaction (hammer, bullish engulfing).
Entry: Long between 3220-3230.
SL: Below 3200.
TP1: 3254.
TP2: 3270.
Bonus TP: 3290 if NY session volume kicks in.

bullish momentum, accumulating around 3400⭐️GOLDEN INFORMATION:
Gold price (XAU/USD) regained strong upward momentum during the Asian session on Thursday, rebounding sharply above the $3,400 level in the past hour and recovering much of its overnight pullback from a two-week high. The renewed demand for the safe-haven metal comes as US President Donald Trump downplayed expectations of an imminent resolution to the US-China trade dispute, stating he feels "no rush" to finalize an agreement. Heightened geopolitical tensions—including the ongoing Russia-Ukraine war, instability in the Middle East, and escalating military friction between India and Pakistan—further support gold's appeal as a defensive asset.
⭐️Personal comments NOVA:
Gold price continues to recover well around 3400, FED's speech is quite moderate, predicted early by investors, the market is positive in the recovery trend this week
⭐️SET UP GOLD PRICE:
🔥SELL GOLD zone : 3438- 3440 SL 3445
TP1: $3425
TP2: $3410
TP3: $3395
🔥BUY GOLD zone: $3352 - $3350 SL $3345
TP1: $3365
TP2: $3380
TP3: $3400
⭐️Technical analysis:
Based on technical indicators EMA 34, EMA89 and support resistance areas to set up a reasonable sell order.
⭐️NOTE:
Note: Nova wishes traders to manage their capital well
- take the number of lots that match your capital
- Takeprofit equal to 4-6% of capital account
- Stoplose equal to 2-3% of capital account

GOLD BUY?Market is reacting to daily area on Daily time frame. Based on 4HR TF, the market seems to be forming a possible reversal pattern which could lead to a possible reversal.
We could see BUYERS coming in strong should the current level hold.
Disclaimer:
Please be advised that the information presented on TradingView is solely intended for educational and informational purposes only.The analysis provided is based on my own view of the market. Please be reminded that you are solely responsible for the trading decisions on your account.
High-Risk Warning
Trading in foreign exchange on margin entails high risk and is not suitable for all investors. Past performance does not guarantee future results. In this case, the high degree of leverage can act both against you and in your favor

Gold Trade Plan 25/04/2025Dear Traders,
There is no strong bullish momentum observed in gold, and it seems to be moving within a descending channel. Meanwhile, the dollar index has entered a reversal phase. I expect the price to drop into the 3220–3230 zone to gather momentum, A new update will be shared soon.
If you enjoyed this forecast, please show your support with a like and comment. Your feedback is what drives me to keep creating valuable content."
Regards,
Alireza

Gold Trade Plan 30/04/2025Dear Traders,
Gold has once again entered the 3275 support zone. Given that this is the fifth time it has tested this support, I expect the price to break below it. Additionally, the dollar index has entered a reversal phase. Good buying zones are around 3200–3220.
if you enjoyed this forecast, please show your support with a like and comment. Your feedback is what drives me to keep creating valuable content."
Regards,
Alireza!

Will gold fall after encountering resistance at its high point?Gold surged after opening yesterday. Although it retreated slightly, it continued to maintain its strong pace. So far, it has reached 3386, with an increase of about 150 US dollars. 3386 is a short-term suppression level. If it breaks below 3350 in the Asian session, the steady idea is to wait for a rebound and then short it to see the downward trend. The focus below is on the support of 3272. Overall, the short-term operation strategy for gold is to short on rebounds and to buy on pullbacks. The short-term focus on the upper side is 3386-3390 resistance, and the short-term focus on the lower side is 3320-3300 support.
Strategy: Short gold in batches around 3380-3385 when it rebounds, stop loss at 3391, target around 3350-3330, break to target 3320

GOLD MARKET ANALYSIS AND COMMENTARY - [May 05 - May 09]This week, the international OANDA:XAUUSD has dropped sharply from 3,352 USD/oz to 3,201 USD/oz and closed the week at 3,240 USD/oz.
The reason for the sharp drop in gold prices is that US President Donald Trump said that the US is about to reach a trade agreement with India, Japan, South Korea, and is likely to reach a trade agreement with China, although the two sides have not had any official negotiations.
In addition, an equally important factor is that China is on holiday from May 1 to May 5, so the demand for transactions in the world's largest gold consuming country is almost non-existent. While they have been continuously buying before even though the gold price was high.
The FED meeting on May 6-7 may have a strong impact on gold prices next week. US GDP in the first quarter grew by -0.3%, while the labor market still has potential tariff risks; inflation remains stable at a high level. With these data, it is likely that the FED will maintain interest rates at current levels, but may signal that a rate cut is coming soon. According to many experts, if the FED signals that it will cut interest rates after the meeting next week, it will push gold prices to recover next week. On the contrary, if the FED maintains a wait-and-see attitude, declaring that it is not in a hurry to cut interest rates, then gold prices next week may continue to adjust.
🕹SOME DATA THAT MAY AFFECT GOLD PRICES THIS WEEK:
Next week, all eyes will be on the Federal Reserve’s monetary policy meeting on Wednesday, with an interest rate decision and a press conference from Chairman Jerome Powell following keynote remarks earlier in April.
Fed officials will then continue their participation in the Reykjavik Economic Conference in Iceland on Friday. Fed Governors Michael Barr, Lisa Cook, Philip Jefferson and Christopher Waller will be present at the conference as speakers in panels on topics including artificial intelligence, employment and monetary policy research.
In addition, investors will also watch the ISM services PMI on Monday morning and the weekly jobless claims number on Thursday.
📌Technically, if gold prices fall below $3,200/oz next week, there is a possibility of a further decline to $3,129/oz. A deeper correction could see gold prices fall to $2,980-$3,000/oz next week. If gold prices reverse and break the $3,270/oz barrier, they could continue to rise above $3,350/oz.
Notable technical levels are listed below.
Support: 3,228 – 3,163USD
Resistance: 3,245 – 3,267 – 3,292 – 3,300USD
SELL XAUUSD PRICE 3311 - 3309⚡️
↠↠ Stop Loss 3315
BUY XAUUSD PRICE 3119 - 3121⚡️
↠↠ Stop Loss 3115

XAUUSD MADE PARALLEL CHANNELHere I Created This XAUUSD Chart Analysis
Pair : XAUUSD (Gold)
Timeframe: 30-Minute
Pattern: Parallel Channel
Momentum: Bullish/ BUY
Entry Level : BUY 3380
Support zone : 3370
Target Will Be : 3415
Disclaimer : This signal is based on personal analysis for learning purposes. Trade at your own risk and always use proper risk management.

PATIENCE WILL PAY OFF 〉LONG TERM BUY COMING SOON.As illustrated, I'm trying to visualize what the next couple of weeks could look like.
Taking into consideration the fact that May + June are corrective months for gold historically (don't believe me; check the seasonality tool...) , Is likely for price to range up and down within quite a wide range anywhere between 3300 and 3100 before it enters a bullish continuation impulse by the end of June and into first week of July.
( I have illustrated 2 potential buying areas; one closer to price and another extended one lower )
That being said, one must adapt to such market conditions that will only offer certain structure offering a few intraday trades, but mostly short term trades or quick scalping moves all within a same trading session, simply because as each session comes in, they will target previous sessions highs or lows (ranging back and forth in an uncomfortable manner and without a clear direction).
Asia would target Sydney's open, then London might target Asia's open, then NY might target any low or high in the opposite direction... and so on back and forth without truly holding a bullish or bearish structure longer than a few hours to a full calendar day before it turns around (sideways behavior).
As price reaches "stronger psychological" price levels like 3150, 3100, 3050 and potentially 3000; then you might start seeing evident rejections within higher timeframes (4H and 1D); ideally seeing rejection wick/s followed by a nice push up showing true power and volume to the upside, potentially signaling the bottom of this correction phase.
TIME should be aligned with this market behavior; that means that checking the seasonality tool. every year (on average 5, 10 and 15 years), gold makes a bottom during the first week of JULY ...
So... market structure, price, and time must be aligned correctly and it will all make sense whenever that moment comes; hence, the title of this idea.
I am personally not worried about any sort of economic event; news are only gas for the market to move and create liquidity and volatility.
AT THIS POINT, THE ONLY THING THAT COULD TRIGGER A SIGNIFICANT MOVE IN GOLD, IS A GEOPOLITICAL EVENT THAT WOULD TRULLY TRIGGER UNCERTAINTY IN THE MARKETS... .
--
GOOD LUCK!
Persaxu

XAUUSD top-down analysisHello traders, this is a complete multiple timeframe analysis of this pair. We see could find significant trading opportunities as per analysis upon price action confirmation we may take this trade. Smash the like button if you find value in this analysis and drop a comment if you have any questions or let me know which pair to cover in my next analysis.

Gold Trade Plan 07/05/2025Dear Traders,
after False break of Side Range price break top of Range,
The price is hitting the support at 3360-3370(pullback) and the move is continuing.
Momentum of Bullish movement is very Good , i expect price will be continue Uptrend to 3480
If you enjoyed this forecast, please show your support with a like and comment. Your feedback is what drives me to keep creating valuable content."
Regards,
Alireza

Gold on expected upswingTechnical analysis: Nothing irregular at the moment on the Short-term as Gold (Xau-Usd Spot) continues to Trade on Buying extension taken from local Low's Bullish accumulation within #3,370’s zone with clear Resistance point, and Support levels / ready to deliver the breakout I was after. I highlighted many times recently that every / more serious decline may represent Buying accumulation towards new ATH's. The underlying Medium-term trend is still Bullish, so if the Intra-day Low breaks throughout today’s session, then I expect another run towards the #3,400.80 benchmark / Higher High's Upper zone and possible benchmark extension. One important difference though: the Hourly Moving Average broke and for the first time in #3 sessions Gold was testing it from below as a Resistance (this was needed to break again to comfort Buyers). However, if (November #4 - #9) / (January #1 - #6) (January #20 - #25) variance is yet to be repeated, Gold finished the same pattern (Trading on such configuration) and now should engage the aggressive decline once local High's are met.
My position: My practical suggestion is to Buy every dip on Gold.

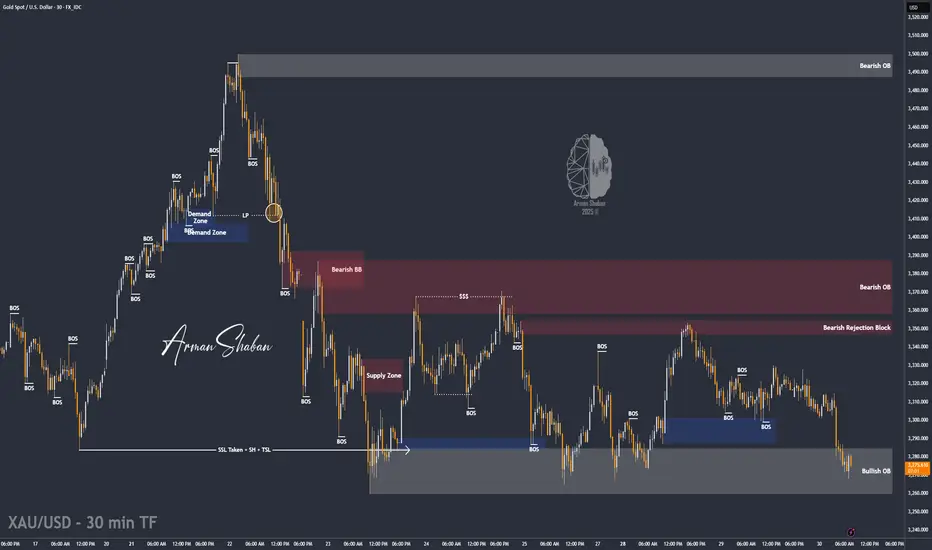
XAU/USD: High Volatility is Expected! (READ THE CAPTION)By analyzing the gold chart on the 30-minute timeframe, we can see that, as expected, the price began rising from the $3310 zone yesterday and reached $3330, delivering a 200-pip gain.
After that, selling pressure took over, and gold is now trading around $3277. Given the current market structure and today's important news events, I expect high volatility in both bullish and bearish directions.
One of the key liquidity pools likely to be targeted today lies below $3259, and before any potential drop, we may see the liquidity gap between $3288 and $3303 being filled.
Please support me with your likes and comments to motivate me to share more analysis with you and share your opinion about the possible trend of this chart with me !
Best Regards , Arman Shaban
When will gold's plunge bottom out?For gold on Monday, it can rely on the 3264-3268 line of pressure to continue shorting, and the limit of the pullback cannot exceed the 618 position of 3275, which is the watershed. The support below is 3222-3224. If it breaks, it will hit the low point of 3201-3202, which may not be maintained.

Gold will drop to $2,800 after the correction!Hello, traders
Gold starting the week with some bullish momentum. We've seen a 'BOS' to the downside, which is now being followed by a retest of a supply zone. This zone can either be around $3,317 (0.618% Fib) or higher around $3,400 zone (0.365% Fib).
Don't forget we're in a 'Wave 4 Correction' of the Elliott Wave Theory strategy. Wave 4 always has choppy price action to trap in late buyers & early sellers.

Has the trend of gold's high dive turned bearish?Technical analysis of gold: Breaking news, China and the United States are preparing for tariff talks, which is a major negative. Gold plunged more than $60 from the 3438 USD line in the early trading, and it should have reached the top within the day; if there is no major positive push, the early high of 3438 should not be broken again, otherwise once it breaks through 3500, it will definitely break, but it is unclear how far it will go above 3500. Gold started to retrace from the 3438 position in the early trading. It is currently expected to stop falling at the 3350 support area in the early trading. In the short term, it is necessary to pay attention to whether the gold weekly line will form an evening star pattern. Once the evening star structure is formed, gold will most likely confirm that it has peaked in stages, and will experience a large-scale retracement in conjunction with the weekly top divergence! However, the daily trend is relatively repeated, so we still need to focus on the impact of news on the trend!

Learn the Harsh Truth About Success & Failure in Trading
The picture above completely represents the real nature of trading:
We all came here because we all wanted easy money.
Being attracted by catchy ads, portraying the guys on lambos, wearing guccies and living fancy lives, we jump into the game with high hopes of doubling our tiny initial trading accounts.
However, the reality quickly kicks in and losing trades become the norm.
The first trading account will most likely be blown .
In just one single month, 40% of traders will be discouraged and abandon this game forever.
The rest will realize the fact that the things are not that simple as they seemed to be and decide to start learning.
The primary obstacle with trading education though is the fact that there are so much data out there, so many different materials, so many strategies and techniques to try, so the one feels completely lost .
And on that stage, one plays the roulette: in the pile of dirt, he must find the approach that works .
80% of the traders, who stay after the first month, will leave in the next 2 years. Unfortunately, the majority won't be able to find a valid strategy and will quit believing that the entire system is the scam.
After 5 years, the strongest will remain. The ones that are motivated and strong enough to face the failures.
With such an experience, the majority of the traders already realize how the things work. They usually stuck around breakeven and winning trades start covering the losing ones.
However, some minor, tiny component is still missing in their system. They should find something that prevents them from becoming consistently profitable.
Only 1% of those who came in this game will finally discover the way to make money. These individuals will build a solid strategy, an approach that will work and that will let them become independent .
That path is hard and long. And unfortunately, most of the people are not disciplined and motivated enough to keep going. Only the strongest ones will stay. I wish you to be the one with the iron discipline, titanic patience and nerves of steel.
❤️Please, support my work with like, thank you!❤️
I am part of Trade Nation's Influencer program and receive a monthly fee for using their TradingView charts in my analysis.

XAUSD FOMC - Gold Sniper Plan - May 7 - 2025💥 XAUUSD FOMC Sniper Plan – May 7, 2025
"We Don’t Chase Breakouts. We Build the Trap Before the Noise."
🌍 Macro & Geopolitical Context – What Really Matters Today
Markets are frozen in anticipation of tonight’s FOMC bombshell:
📌 20:00 UTC – FOMC Statement & Rate Decision
📌 20:30 UTC – Powell Speaks
Traders are split. Some expect a dovish tone to push gold through ATH. Others brace for a hawkish surprise.
But let’s get one thing straight:
Gold has already run thousands of pips. It doesn’t need help going higher — it needs a reason not to collapse.
That’s what Powell holds in his hands tonight.
Meanwhile, geopolitics stay hot in the background:
Middle East tensions simmer (again).
Trump pressure on Powell to step down adds political risk.
Global yields are compressing → gold remains macro-favored.
This is not a time for guessing. This is a time for traps.
🧠 Current Structure Snapshot (Price: 3431)
HTF is still bullish, but we're extended.
Last confirmed HH = 3488, with ATH = 3500
We're in a short-term retrace under a H4 CHoCH → excellent sniper conditions.
🧱 Key Structural Levels
Zone Type Price Range Context
🔼 R2 3488–3495 Last HH OB + extension sweep trap
🔼 R1 3448–3455 H4 OB + liquidity pocket under HH
🔽 S1 3378–3384 H4 OB + FVG + EMA 50 confluence
🔽 S2 3333–3340 D1 OB + CHoCH + imbalance zone
We don't use FIBO extensions for guessing entries. We use them to target the crowd who does:
Extension Price Range Use
1.272 3530–3535 TP3 only
1.618 3575–3580 Final exhaustion area
🎯 Sniper Setups – Real, Refined, Ruthless
🟢 Buy #1 – 3378–3384
Valid H4 OB
FVG tail fill + internal liquidity
RSI around 40 + EMA 50 bounce
SL: 3365
TP1: 3405 | TP2: 3430 | TP3: 3455
🧠 Our first reaction zone before news madness.
🟢 Buy #2 – 3333–3340
D1 OB + imbalance
Clean internal liquidity from 3300–3330
Confluence with CHoCH base
SL: 3315
TP1: 3370 | TP2: 3405 | TP3: 3448
💎 This zone is invisible to retail — perfect trap before spike.
🔴 Sell #1 – 3448–3455
H4 OB at premium
EMA rejection + FVG close
Pre-news stop hunt ideal here
SL: 3462
TP1: 3430 | TP2: 3405 | TP3: 3385
🎯 Don’t short gold randomly — short it here, where retail longs trap themselves.
🔴 Sell #2 – 3488–3495
Last HH OB before ATH
Strong fibo ext confluence
Sweeps = liquidity + exhaustion
SL: 3504
TP1: 3465 | TP2: 3430 | TP3: 3395
If they want to break ATH before Powell, we’ll be waiting above it.
⚙ EMAs in Sync
EMA Signal
21 Tested from below — sell confluence at 3448
50 Lining up near Buy #1
200 Far below — macro still bullish
🧠 Execution Plan
Stay flat before FOMC unless setups trigger with PA confluence
Anticipate whipsaws → SLs must be respected
If price consolidates above 3455 = bullish continuation likely
If it sweeps 3448–3455 and rejects = sell of the week
Drop a 🚀 and follow us: if you’re not trading emotion — you’re trading execution.
📌 Important Notice!!!
The above analysis is for educational purposes only and does not constitute financial advice. Always compare with your plan and wait for confirmation before taking action.
