Will gold fall after encountering resistance at its high point?Planning your trading is the prerequisite for making profits. The essence of the market is the cycle of highs and lows, alternating ups and downs, and the essence of trading is to grasp the relative highs and lows in the market and snipe valuable trading opportunities. This value has only two points: first, probability, and second, space.
After the gold price rose, we will analyze the trend of it correcting from the high to 3200. The key position of this rebound, that is, the 618 position, is near 3386. The gold price encountered resistance here in the morning. So technically this suppression can be used as a key reference for the future market. Today in the Asian session, we will first observe the support situation of 3350. If it breaks down, then before the interest rate decision in the early hours of Thursday, we will pay attention to whether the gold price can stand firmly above 3272. If this position is not stable, then the second half of the week will still be a downtrend. This wave of rise can only be regarded as a rebound repair, not a bull return (the premise is that 3386 above must not be broken).
Today's gold short-term operation ideas suggest that rebounding is the main focus, and callbacks are supplemented by longs. The upper short-term focus is on the 3386-3390 first-line resistance, and the lower short-term focus is on the 3320-3300 first-line support. All friends must keep up with the rhythm.
Short position strategy:
Strategy 1: Short 20% of the gold position in batches when it rebounds to around 3380-3385, stop loss 6 points, target around 3350-3330, and look at 3320 if it breaks;
Long position strategy:
Strategy 2: Long 20% of the gold position in batches when it pulls back to around 3315-3320, stop loss 6 points, target around 3340-3360, and look at 3380 if it breaks;
GOLDCFD trade ideas

Analysis of gold operation strategy next week
The latest April non-farm payrolls report released by the U.S. Bureau of Labor Statistics (BLS) has attracted much attention from the market. The report shows that the U.S. economy added 177,000 jobs that month, higher than the market expectation of 130,000, indicating that the U.S. labor market still shows strong resilience. At the same time, the unemployment rate remained at 4.2%, in line with market expectations, while the previously released March data was revised down from 228,000 to 185,000. This data adjustment is an official routine operation. In terms of wages, the average hourly wage increased slightly lower than the market expectation of 0.2% month-on-month, and fell short of the expected 0.3%; however, the year-on-year growth rate remained at 3.8%, higher than the current inflation level, suggesting that real income is still showing an upward trend.
After the release of the non-farm data, the market reacted quickly but the trend was divided. Spot gold fell about $9 to $3,250/ounce within a minute after the data was released, but then quickly rebounded to $3,255/ounce, with an intraday increase of 0.56%. In the short term, the two price levels of 3,260 and 3,265 have become the resistance levels of market attention. Overall, the unexpected performance of the non-farm payrolls in April has boosted the market's short-term confidence. However, the downward revision of historical data and external uncertainties still keep investors cautious. Risk assets may still have some room for growth in the short term, but in the medium and long term, downside risks are gradually accumulating.
After the release of the non-farm payrolls, the price of gold fell as expected, but then quickly bottomed out and rebounded, continuing to fluctuate. The impact of recent non-farm payrolls on the gold market seems to be gradually weakening, and its volatility is even less than usual. The gold 1-hour moving average crosses the downward short position arrangement, and eventually continues to diverge downward. Gold is now under pressure to fall back at the 3270 line, so next week, around 3270 will still be the key turning point for gold bulls and bears. Although gold has rebounded, the decline is not large. If gold is under pressure at 3270 next week and does not break, it will be a shock at most. Gold bulls will not reverse easily for the time being.
Operation strategy:
1. It is recommended to short gold near 3260 next week, with a stop loss at 3270 and a target of 3240
Hello traders, if you have better ideas and suggestions, welcome to leave a message below, I will be very happy

xauusd4k target as high as 4200 have to see. 5th wave again likely extending. Possible ending diag. 50% is been tapped but it can go lower, 2956 is ivalidation watch for red line at 3150 aea if this c goes further down.

Gold bulls are comingJudging from the golden hourly chart, the Asian market is in line with a continued surge of gains. It adjusted to the 10 moving average of 3350 in the afternoon and stabilized. The European market slowly moved higher and approached the high point of the Asian market. This pattern is still very strong, and there is a high probability of a second rise; The 10 EMA is above 3370 as the primary support and continues to be bullish. As each line closes, the EMA support will slowly move upward. As long as it does not effectively break, the short squeeze will be maintained. A breakthrough of 3400 will also occur at any time. If it breaks through, it is easy to continue to storm above 3420. If it rises and falls and falls below the 10 EMA, then If it adjusts to the mid-track for the first time, there will still be good support, just continue to be bullish; comprehensively, in the short-term operation of gold, it is recommended to focus on callbacks and longs, supplemented by rebounds and shorts. The upper short-term focus is on the 3420-3430 first-line resistance, and the lower short-term focus is on the 3365-3370 first-line support.

XAUUSD 1st week May 2025After this week continuing its correction to 3202, at the end of the week gold found its support. This has the opportunity as a reversal area to continue its bullish trend.
If Monday could break 3270, it has a strong posibility to reverse.
Goodluck !

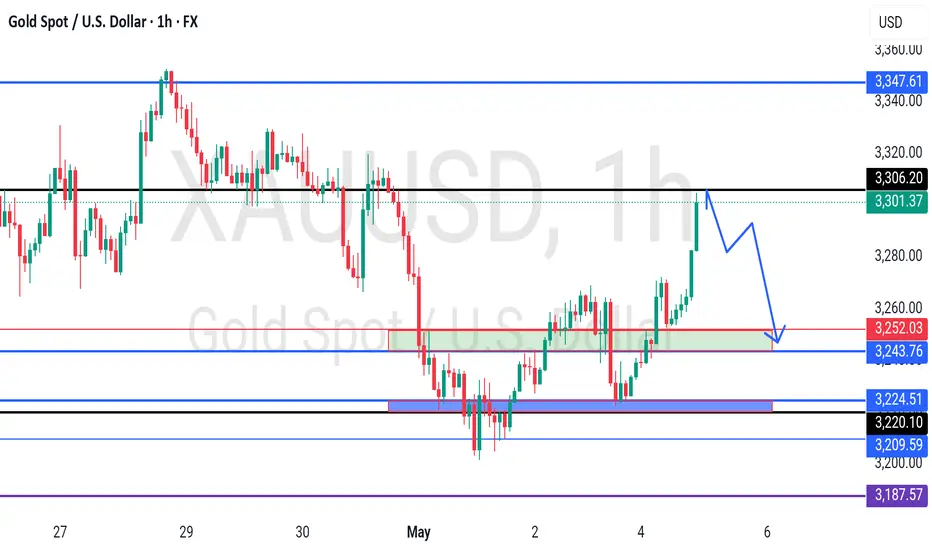
Gold Market Update - XAUUSD May 5th after PMI news🧠💣 “This Chart Might Offend Your Favorite Indicator – We Trade Pure Structure Only.” 💥⚡
⏳ Market Context:
Gold exploded from 3210 to 3328 after PMI release, trapping late sellers and punishing anyone short below 3260. After a sharp rejection at the 3327–3333 premium zone, price dropped fast to 3306 before recovering — confirming both a valid sell reaction and strong demand.
Now price is climbing again, sweeping equal highs and pressing into a weak high zone. But guess what? No valid H1–H4 supply break yet = no strong bearish confirmation. Smart Money is lurking — we’re watching the next trap unfold.
🧠 Structural Key Zones (What Price Is "Eyeing"):
Above:
• 🔥 3360 = weak high reaction level
• 🔥 3380–3395 = unmitigated FVG zone and final high supply pre-sell-off
Below:
• 🧊 3305–3310 = recent liquidity grab zone
• 🧊 3272–3284 = daily FVG + EMA confluence
• 🧊 3220–3235 = HTF unmitigated bullish OB + H4/D1 EMA200 = possible swing reentry
🔥 “Gold’s Not Done — The Liquidity War Isn’t Over Yet”
Smart traders aren’t guessing. They’re stalking zones. Let’s lock in the plan.
🧭 Bias & Flow
Macro: No more high-impact USD news today. Market digesting ISM PMI.
HTF (H4–D1): Bullish continuation unless 3272 breaks
LTF (M15–H1): Bullish pressure — currently front-running premium sell zones
👁🗨 Real-Time Price Context
📍 Price now at 3332
🔸 Approaching Sell Zone #1: 3360–3368
➡ Wait for reaction or internal CHoCH to validate
➡ No aggressive short here unless 3344 starts rejecting hard
📌 Key Level Zones
Type Price Zone Confluence
🔺 Resistance 3360–3368 Weak High + OB + FVG + Liquidity
🔺 Resistance 3380–3395 Final premium trap zone (HTF sell block)
🟩 Support 3272–3284 H1 Demand + FVG + EMA stack
🟩 Support 3220–3235 HTF OB + EMA200 D1 + Deep liquidity
🎯 Sniper Entry Plan
🔻 Sell Zone #1: 3360–3368
• SL: 3376
• TP1: 3344
• TP2: 3310
• TP3: 3285
Price is close — wait for confirmation wick / M15 structure shift
🔻 Sell Zone #2: 3380–3395
• SL: 3405
• TP1: 3360
• TP2: 3325
• TP3: 3275
High-risk sell if bulls overextend; final stop before reversal
🟢 Buy Zone #1:3300–3306 → Previous reaction zone
‣ SL: 3290
‣ TP1: 3320
‣ TP2: 3340
‣ TP3: 3360
Clean demand left unmitigated, supported by fair value gap on M15.
🟢 Buy Zone #2: 3272–3284
• SL: 3262
• TP1: 3305
• TP2: 3333
• TP3: 3360
Still valid if we see clean sweep and reentry from FVG
🟢 Buy Zone #2: 3220–3235
• SL: 3200
• TP1: 3260
• TP2: 3300
• TP3: 3340
Only if market nukes deep — last solid demand floor
🔍 Eyes On Zones
🔹 3344: micro resistance = potential front-run fade
🔸 3360: must-watch — premium trap candidate
⚠ Below 3272 = bearish sweep risk into 3220
💬 Final Word — GoldMindsFX Style
Don’t be fooled by the speed. Gold’s strength is real — but so is its manipulation. Snipers don’t chase, they prepare. Stay cold, stay calculated.
🔥 Drop a ⚔ if you’re stalking 3360 with surgical intent.
🙏 Like this breakdown? Boost and follow us for sniper setups all week.
📌 Important Notice!!!
The above analysis is for educational purposes only and does not constitute financial advice. Always compare with your plan and wait for confirmation before taking action.

Gold price continues to rise wildly after the holiday!Technical analysis of gold: Gold soared all the way after opening on Monday yesterday. Although it retreated slightly during the period, it continued to maintain its strong pace. So far, it has reached a high of around 3386, with an increase of about 150 US dollars. The daily line is also supported by the middle track, directly breaking through the suppression of the moving average system, and allowing the market to become strong again after two weeks of baptism. The strong and rapid rise in the morning of the day also formed two possibilities. Either the bulls will continue to exert their strength, but this requires support in the later period, especially in the European and American sessions of the day. The highest reached around 3386 in the morning and then retreated, and the lowest reached around 3350. If it continues to fluctuate in this range before the European session, it may still have room for upward movement in the later period. On the contrary, if the European session directly breaks through in the opposite direction, it is very likely to be converted into a decline in the shorts, not a retracement correction of the bulls;

xauusd:sell@3315-3320After the opening of the gold market today, it started to rise. After breaking through 3270, the market has been in an upward trend. Currently, it has reached the resistance area of 3310-3320. You can start short selling when it reaches this area.
All the signals I sent have been profitable, and I will continue to send accurate signals.
Today's trading strategy for gold:
xauusd sell@3315-3320
tp:3280-3270

GOLD - WAVE 4 CORRECTION TO $2,800 (UPDATE)Gold starting the week with some bullish momentum. We've seen a 'BOS' to the downside, which is now being followed by a retest of a supply zone. This zone can either be around $3,317 (0.618% Fib) or higher around $3,400 zone (0.365% Fib).
Don't forget we're in a 'Wave 4 Correction' of the Elliott Wave Theory strategy. Wave 4 always has choppy price action to trap in late buyers & early sellers.

GOLD - reached at resistance zone ? What's next??#GOLD.. market perfectly bounced back from our supporting area as we discussed in our last idea.
Now market just reached at his r distance region.
From 3262 to 3269-70
Keep close the area and if market holds that in that case we can expect a drop from here.
Good luck
Trade wisely

Gold: Early Entry, Target 3200Gold is being actively bought up.
Ideally, we’d first see a reaction from sellers, a pullback, and then enter the position.
But I’ll try entering from here with a tight stop. First target: 3200.

The latest ideas on gold.Gold prices are still in a long-term bullish trend, and recent operations still maintain the idea of buying on dips; in the medium term, it may fluctuate at a high level, and mid-term operations need to be treated with caution. With the short-term rise in the European session, gold is waiting for a decline to go long.

XAUUSD Analysis todayHello traders, this is a complete multiple timeframe analysis of this pair. We see could find significant trading opportunities as per analysis upon price action confirmation we may take this trade. Smash the like button if you find value in this analysis and drop a comment if you have any questions or let me know which pair to cover in my next analysis.

Gold Price Analysis May 2D1 frame confirms closing below the disputed zone showing the downtrend continues to extend in the following days
The recovery in the Asian and European sessions can be a stepping stone for a decrease in the US session. Sellers are waiting for high price zones and old breakout zones to sell their goods. The 3271-3273 zone plays an important role in the bearish structure as long as this zone is held by the sellers, the possibility of a price increase is relatively low.
The barrier in the Asian session around 3257 will be where we consider the trading strategy. If the European session breaks this zone, we can buy at the target of 3271-3273. If the US session does not break this zone, SELL breaks it, the downtrend structure is broken and holds the BUY order until 3299. The daily resistance zone will be 3312. When 3371 is not broken, SELL and this is a good Swing signal to 3200. The possibility of a strong sell-off after Nonfarm is also understandable.
Strategy: If it does not break 3257 but falls, wait for the reaction at the border of 3243. When this zone is broken, the trend is broken, then we only SELL. If it increases from 3243, then maintain the above strategy with a better entry.

XAU/USD For Bearish as pull-backwait for pull-back near by entry point and then go short
general trend is up trend
current phase is pull-back
Gold under pressure
have fun :)

GOLD - reached at today resistance? What's next??#GOLD - perfect bounce above our area as we discussed in our video analysis.
Now market just reached at his today resistance area that is around 3302-05
Keep close it and if market holda then drop expected
Good luck
Trade wisely
Up for gold!Hi traders,
Last week gold consolidated and dropped. It looks like the b-wave of the correction was a Triangle and now it's in the last Wave c (blue).
For next week we wait for the finish of the correction (Zigzag) into the Weekly FVG and after that we could trade longs again.
Let's see what price does and react.
Trade idea: Wait for the correction to finish and a change in orderflow to bullish to trade longs again.
If you want to learn more about trading FVG's & liquidity sweeps with wave analysis, please make sure to follow me.
This shared post is only my point of view on what could be the next move in this pair based on my technical analysis.
Don't be emotional, just trade your plan!
Eduwave

Gold TechnicalsThis chart outlines a potential bullish breakout scenario for XAUUSD on the 1-hour timeframe. Price has been respecting a descending trendline, but recent upward momentum has brought it back to a key decision point near the trendline resistance. The circled area labeled "BOS" (Break of Structure) suggests a possible shift in market structure from bearish to bullish if price breaks and sustains above that zone. The main expectation is for price to push higher toward the upper resistance around 3,320 if the breakout confirms, offering a swing or intraday long opportunity. However, the alternative scenario (marked with a red arrow) highlights that failure to break the trendline could result in a rejection and continuation of the downtrend toward the 3,180–3,160 support zone. RSI near mid-levels supports the idea that price still has room to move in either direction, emphasizing the importance of watching price behavior at the breakout point.

XAUUSD latest analysis strategyWave ABC which is currently in wave B in a corrective triangle of five waves abcde
and could continue to fall for wave C to $3166
Main and important resistance 3360
Short resistance 3321

Gold XAUUSD Possible Move 📊 SMC Analysis + Trade Signal
Market Structure Overview:
Accumulation: led to strong bullish rally from 3330 to 3435.
Distribution: Multiple liquidity sweeps between 3365-3394
Breakdown: Clean BoS confirms bearish shift from distribution.
Current Action: Liquidity grab at bottom 3320/30 likely a retracement.
🔔 Trade Signal: SHORT
Entry: 3,360 – 3,370 (pullback to supply zone)
Stop Loss: Above 3,380 (last swing high)
Take Profit:
TP1: 3,340
TP2: 3,320
Bias: Bearish
Reason: Distribution + BoS + Pullback to premium
Show your support by hitting follow, support, and boost.

XAU.usd watch $3407/18: Key Resistance and end of "Wave B" ?Part of my ongoing analysis of Gold (see below).
Per the last plot, we bounced exactly where hoped.
We may well be at "Wave B" end point near $3400.
This is bears best and last chance to get a lower low.
.
Last Plot that caught our bounces EXACTLY
Previous Plot called the last Dip Entry EXACTLY
.
I will post updates on this Idea as price action progresses.
.
Please follow and like, for more EXACT plots to use in your trading.
==============================================================
.

0429 4H TRADING OPPORTUNITY FOR GOLDHello traders,
The seven major U.S. stock markets are no longer in the limelight, and the market is facing a major test
Even after the past week's rally, the Big Seven have had their worst first quarter since 2022!
Over the past two years, seven major tech companies--Alphabet, Amazon, Apple, Meta Platforms, Microsoft, Nvidia and Tesla--have driven a strong rally that pulled stocks out of the 2022 bear market, setting dozens of all-time highs.
Today, even after the past week's rally, the seven major U.S. stocks have had their worst start to a year since 2022, according to Dow Jones Market Data. All seven stocks are down more than 6.5%, wiping out a total of $2.5 trillion in market value. [
1. Core earnings focus: Can tech giants continue their growth myth?
Earnings schedule and market expectations
Meta (after the close on April 30)
Microsoft (after the close of trading on May 1)
Apple (after the close on May 2)
Amazon (after the close of trading on May 3)
Risk warning signals
Nvidia showed weakness ahead of time: fell 2.1% on Monday.
Divergence in the Nasdaq: The Dow's fifth straight gain contrasts with a slight drop in the Nasdaq, which could trigger a broader sell-off if it falls below its 15,000 support level after earnings.
II. Interpretation of the latest market data
Changes in liquidity environment
US Treasury yields fell: The yield on the 10-year Treasury note fell to 4.213% (from 4.267%), a low interest rate environment is positive for tech valuations, but the US Treasury's new $514 billion borrowing program could drain liquidity from the market, so watch for changes in funding.
Dollar index weakens: The Wall Street Journal dollar index fell to 95.78 (from 96.34) and a weaker dollar is usually good for foreign earnings conversion for multinational companies, but if the debt ceiling crisis heats up, the dollar could rebound quickly.
Commodity market feedback
Gold rallied back: Spot gold closed at its third-highest level in history ($3,332.50 an ounce), as risk aversion rose. If earnings fall short of expectations, gold could test the $3,400 mark again.
Crude oil demand concerns: WTI crude fell to $62.05 / barrel, Brent to $65.86. Weak tech stocks could exacerbate the deterioration in economic expectations, further weighing on the outlook for crude oil demand.
3. Analysis of key linkage effects
Negative correlation between tech stocks and gold: If the earnings blow leads to a sharp drop in the Nasdaq, gold's safe-haven nature will be highlighted, and capital may accelerate into the precious metals market.
Crude oil as an economic barometer: Weak tech giant earnings-> Downgraded global economic outlook-> Dismal outlook for crude oil demand, WTI may test psychological support at $60.
Weekly circle prompt:
[At the beginning of this week, new warehouses entered to short gold, and need to wait for a new one-hour reversal signal in the European and American sessions before continuing to enter to short gold,
aim to do
TP1:3265
TP2: 3240
TP3:3225
TP4: 3205】
On Monday, during the European session of gold, there was a reversal signal at the support structure position on the 1-hour chart, and the long plan was put on hold.
Daily chart, gold has been trading above the EMA in a volatile market, and the bearish force is not strong enough to reverse the gold rally.
The data on Tuesday was light, so we changed our thinking and continued the upward direction on Monday to go long on gold. Using the FIBO calculation of last week's downtrend, the target for going long on gold is:
TP1: 3380
TP2: 3408
TP3: 3447
GOOD LUCK!
LESS IS MORE!

XAUUSD H4 | Bearish Reversal Based on the H4 chart, the price is approaching our sell entry level at 3275.86, a pullback resistance that aligns with the 50% Fibo retracement.
Our take profit is set at 3222.63, an overlap support.
The stop loss is set at 3314.24, a swing high resistance.
High Risk Investment Warning
Trading Forex/CFDs on margin carries a high level of risk and may not be suitable for all investors. Leverage can work against you.
Stratos Markets Limited (tradu.com):
CFDs are complex instruments and come with a high risk of losing money rapidly due to leverage. 63% of retail investor accounts lose money when trading CFDs with this provider. You should consider whether you understand how CFDs work and whether you can afford to take the high risk of losing your money.
Stratos Europe Ltd (tradu.com):
CFDs are complex instruments and come with a high risk of losing money rapidly due to leverage. 63% of retail investor accounts lose money when trading CFDs with this provider. You should consider whether you understand how CFDs work and whether you can afford to take the high risk of losing your money.
Stratos Global LLC (tradu.com):
Losses can exceed deposits.
Please be advised that the information presented on TradingView is provided to Tradu (‘Company’, ‘we’) by a third-party provider (‘TFA Global Pte Ltd’). Please be reminded that you are solely responsible for the trading decisions on your account. There is a very high degree of risk involved in trading. Any information and/or content is intended entirely for research, educational and informational purposes only and does not constitute investment or consultation advice or investment strategy. The information is not tailored to the investment needs of any specific person and therefore does not involve a consideration of any of the investment objectives, financial situation or needs of any viewer that may receive it. Kindly also note that past performance is not a reliable indicator of future results. Actual results may differ materially from those anticipated in forward-looking or past performance statements. We assume no liability as to the accuracy or completeness of any of the information and/or content provided herein and the Company cannot be held responsible for any omission, mistake nor for any loss or damage including without limitation to any loss of profit which may arise from reliance on any information supplied by TFA Global Pte Ltd.
The speaker(s) is neither an employee, agent nor representative of Tradu and is therefore acting independently. The opinions given are their own, constitute general market commentary, and do not constitute the opinion or advice of Tradu or any form of personal or investment advice. Tradu neither endorses nor guarantees offerings of third-party speakers, nor is Tradu responsible for the content, veracity or opinions of third-party speakers, presenters or participants.
