Analysis of Gold's Trend and Trading Suggestions for Next WeekAfter the release of the non-farm payrolls data, the market reacted quickly but showed a divergent trend, bringing a short-term boost to market confidence. However, the downward revision of historical data and external uncertainties still keep investors cautious. In the short term, risky assets may still have some room for growth, but in the medium to long term, downward risks are gradually accumulating.
From a technical perspective, in the 1-hour K-line chart of gold, the moving average system shows an obvious bearish arrangement with a death cross pointing downward, and each moving average continues to diverge downward, indicating that the short-term bearish force is dominant. Currently, the gold price is falling back under the pressure at the level of 3,270. Judging from the subsequent trend, around 3,270 will become a key turning point in the battle between bulls and bears for gold next week.
Although there has been a rebound in the price of gold, the rebound range is relatively limited compared to the previous decline, which further shows that the bullish force has not fully taken the upper hand. If the gold price continues to be under pressure at the level of 3,270 and fails to break through effectively next week, the market is likely to continue in a range-bound pattern. In the short term, it will be difficult for the bulls in the gold market to achieve a trend reversal. Investors need to pay close attention to the breakthrough situation of this key price level and the changes in trading volume to grasp the subsequent market trend.
XAUUSD
sell@3255-3265
tp:3240-3220
Investment itself is not risky; it is only when investment is out of control that risks occur. When trading, always remember not to act on impulse. I will share trading signals every day. All the signals have been accurate without any mistakes for a whole month. No matter what gains or losses you've had in the past, with my help, you have the hope of achieving a breakthrough in your investment.
GOLDCFD trade ideas

The latest gold strategy analysis and operation guidance📌Fundamentals:
This week, the US economic data was released intensively, and ADP employment, unemployment benefits, GDP and PCE price index were all bullish, but some data showed signs of weakness after Trump's tariff policy. The unemployment rate remained the same as the previous value of 4.2%, while the expected new employment of 130,000 was significantly lower than the previous value of 228,000. The market's concerns about the cooling of the economy provided support for the gold price.
📊Technical side:
Although the 1-hour moving average is still in a dead cross short arrangement, there are signs of turning around. At the same time, after the rebound, gold began to consolidate at a high level instead of continuing to fall, so the momentum of the bears was weakened. So today's closing is critical. Today, gold fell back to around 3230 under pressure from 3270. In the short term, this is a balance range. You can see the shock in this range at night. If gold finally closes above 3270, then gold will most likely continue to rise next week. If it closes below 3240, then gold bears still have a great chance. If you want to operate in the short term, then don't chase it for the time being. Since it is a shock, you can go short first at a high level. If it breaks through 3270, then wait until next week. On the whole, today's short-term operation of gold suggests that the rebound is mainly short, and the callback is supplemented by long. The top short-term focus is on the first-line resistance of 3265-3270, and the bottom short-term focus is on the first-line support of 3200-3197.
🎯Practical strategies:
Strategy 1: Go short when gold rebounds around 3263-3266, with a target around 3230-3210.
Strategy 2: Go long when gold pulls back around 3197-3200, with a target around 3220-3230.

Thinking and practical skills for winning in the 3360-3400 rangeAffected by the news, gold fell sharply at the opening. Successfully won. According to the trading strategy, we gave gold a wide range of fluctuations in the 3360-3400 range, which will not change much. It can be operated within the range during the day. The trading strategy analysis is accurate, and the key points are accurately grasped to enter the market, which brought us good returns during the day. The short-term rhythm is accurately grasped! Brothers who followed the trading plan should have also made very good profits. 🍻🍻🍻

Gold latest strategy analysis- Completed " 12345 " Impulsive Waves and " AB " Corrective Waves
- Break of Structure
- RSI - Divergence
- Consolidation Phase
- Bearish Channel as an corrective pattern in Short Time Frame

Gold Stuck in Limbo- Sell Rallies, Ride the DropAfter the explosive rally that pushed Gold up to the 3500 area, the market quickly reversed with a sharp sell-off on April 22–23, dropping almost 2500 pips.
Since then, price has entered a consolidation phase.
Initially, the range was between 3270 and 3370, but since yesterday, the range has started to tighten — a classic sign that a breakout is approaching.
Looking at the structure, we’re dealing with a blow-off top followed by a range with clear support and resistance levels. In this context, I lean toward a downside breakout.
The key support is now at 3300 — and a break below it would likely expose 3270 again.
However, I don’t expect the move to stop there. If 3300 is broken, a continuation toward the 3200 zone becomes very likely.
🔹 Trading Plan:
As long as price stays below the 3360–3370 resistance zone, the strategy is to sell rallies, especially when price approaches the upper boundary of the range. Entries can be taken on rejection candles or confirmation patterns near resistance, with stops just above 3370. If 3300 breaks, watch for continuation setups toward 3200.
Only a sustained breakout above 3370 with strong bullish momentum would invalidate the bearish scenario and call for a reassessment.
Disclosure: I am part of Trade Nation's Influencer program and receive a monthly fee for using their TradingView charts in my analyses and educational articles.

Gold continued to rise at the opening and broke upward!At present, the 4-hour chart of gold has formed an upward breakout trend. The decline may be over, and it will continue to strengthen! In the intraday, we focus on the 3200-line long-short watershed. Before gold falls further, gold will maintain a bullish trend. In the day, we focus on the recent starting point of 3222 support. If gold wants to go out of a steady upward trend, it will not fall below 3222 in the day. In the short term, we refer to the points above 3222 to arrange long positions! Therefore, in terms of operation, it is recommended to adjust the thinking, go long if it falls back to 3240-3245, or directly chase the rise after breaking through 3270. At present, it has been long at 3243 in the early trading. If there is no more decline, continue to go long! Identify the bulls during the day! On the whole, it is recommended to do more on the callback and short on the rebound in the short-term operation of gold. Focus on the resistance of 3300-3310 in the upper short term, and focus on the support of 3222-3245 in the lower short term.

Gold might be busy with wave b for abc correction. If we only pullback to fib level between 50 - 68%, and get bearish confirmation we might start with leg C. But is also possible that if we go past ATH we might be busy with Wave 5.

XAUUSD update Plan B after FOMCIf 3360 - 3350 level support broken, it could be make a retracement with 62% fibonaci.
Goodluck !

Gold intraday trading strategyGold operation strategy:
1. Go short at 3270-75 when gold rebounds, and cover short at 3388-93 when it rebounds, stop loss at 3397, target at 3230-3235, and continue to hold if it breaks;
2. Go long at 3220-3225 when gold falls back, stop loss at 3214, target at 3265-70, and continue to hold if it breaks;

Today's rebound continues to be short!The logic behind the current rise and fall of gold has changed. The main factors for the previous crazy rise in gold and the decline at 3,500 were the tariff war, which has gradually turned from tension to relaxation. The latest news shows that the two sides are trying to contact each other to prepare for the next round of negotiations.
Later, we should focus on the Federal Reserve. Trump previously asked the Federal Reserve to cut interest rates to reduce the impact of the tariff war on the economy. Powell's resistance once made Trump want to change the chairman of the Federal Reserve. The big non-agricultural data on Friday was better than expected, which means that the time for the Federal Reserve to cut interest rates will be delayed, which is bad for the gold market. Therefore, gold may fall further at the beginning of next week.
On the other hand, after the world's largest gold ETF reduced its positions significantly since the peak of 3,500 on April 22, it has continued to reduce its positions slightly during this period, and there has been no obvious increase in positions, which reflects that gold has further bottoming out.
The daily line on Friday closed with a cross K, following three consecutive negatives. From a technical point of view, it is either a signal of continued decline or a reversal. Combined with the news data and the overall trend, the probability of continued decline is very high.
On the one hand, the rebound strength on the hourly and 4-hour charts is not strong, and the upward continuity is poor. The 100-day moving average is always under pressure to fall, and the trend is still bearish.
On the other hand, the adjustment on the daily and weekly lines has not yet ended, and the indicators show that there is still further decline. Next week, we should focus on the 618 golden section position of 3160. As for whether it can be the bottom position, in addition to the price point, it is also necessary to consider the K-line pattern comprehensively. We will talk about it next week.
Therefore, for gold on Monday, we can rely on the 3264-3268 line of pressure to continue shorting, and the limit of the pullback cannot exceed the 618 position of 3275, which is the watershed. The support below is 3222-3224, and if it breaks, it will hit the low point of 3201-3202, which may not be maintained.

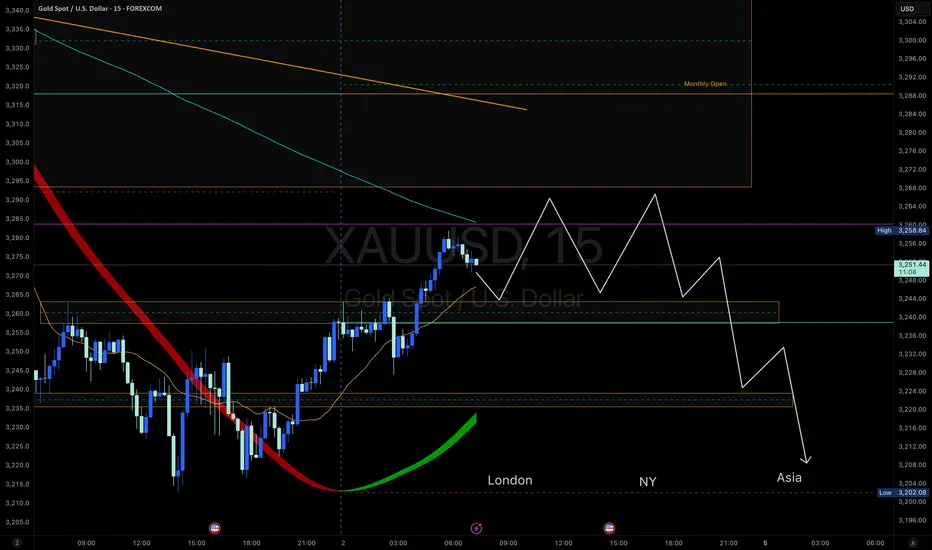
Next 3 sessions for XAUAfter we had a small run-up, we will start testing 3267 again, but this time as resistance.
We will probably se the start of next leg down during NY session, that will continue during next week, with start at Sunday night in next Asia session.
GOLD - reached at final support? What's next??#GOLD.. well guys market perfectly moved as per our analysis and now market job at reached at his final supporting area that is 3350-51 around
Keep close it n only short below that.
Good luck
Trade wisely

There are short-selling opportunities in gold in the short term!
After gold rebounded, there was strong pressure around 3315, so it was a short opportunity, sl: 3325, tp: 3290

Gold Will be Bullish from a Historic Support LevelHello Traders
In This Chart GOLD HOURLY Forex Forecast By FOREX PLANET
today Gold analysis 👆
🟢This Chart includes_ (GOLD market update)
🟢What is The Next Opportunity on GOLD Market
🟢how to Enter to the Valid Entry With Assurance Profit
This CHART is For Trader's that Want to Improve Their Technical Analysis Skills and Their Trading By Understanding How To Analyze The Market Using Multiple Timeframes and Understanding The Bigger Picture on the Charts
Bearish and bullish possibility The market created a 4h descending triangle and it broke out and retested but now it seems to be creating an ascending triangle pattern below, if the descending triangle plays out we could see the market reach within the weekly fvg at the 3185 area which will present buying opportunities and if the ascending triangle plays out we could reach the 3387 area, overall we just have to wait and react accordingly

Gold prices continue to riseDuring the North American session, spot gold prices rose close to the $3,400 mark, hitting a recent high, and market analysis showed that gold bulls seemed to have regained control of price movements. Global geopolitical tensions continue to drive demand for safe-haven assets, and the Fed's interest rate decision on Wednesday will be a key factor affecting gold prices. Data shows that market participants currently expect the Fed to keep interest rates unchanged with a probability of 98.1%. As a result, the market's focus has shifted to the Fed's statement and Powell's subsequent press conference. If the Fed takes a more "dovish" stance, suggesting that interest rates may be cut in the near term, it may put pressure on the US dollar and may support higher prices for precious metals. On the other hand, if the Fed expresses its willingness to continue to keep interest rates unchanged, it may have the opposite effect on gold prices, with the US dollar likely to strengthen and gold prices under pressure.

Will the price of gold continue to rise?The pressure position on the 44-hour chart is around 3270-3280, which becomes an important dividing point for intraday short-term trading. In the intraday trading, we focus on the 3200-line long-short watershed. Before gold falls further and breaks through, gold will maintain a bullish trend. In the intraday trading, we focus on the recent starting point of 3222 support. If gold wants to move steadily upward, it will not fall below 3222 in the day. In the short term, we refer to the points above 3222 to arrange long positions! Gold operation strategy: Gold falls back to 3230-3232, stop loss at 3220, target 3260-3270; it is recommended to go short when it touches 3270-3268, stop loss at 3280, target 3240-3230;

Gold update next weekI really wanted to sell at a higher price.
But the selling pressure was very strong, not overcoming the resistance, so I came up with a new strategy to sell gold at a lower price. Do you have any other ideas? Leave a comment.
Limit sell 3255 sl65
Limit sell 3272 sl 82 ( fake break)
Take profit 3178- 3070
---
Limit buy 3070
SL 3048.5 TP 3178
---
Limit buy 2994- 2982
SL 2972 TP 3090- 3170

Weekly Analysis on GOLDFor next week trading sessions i will be looking for both buy and sell trade opportunities since price shows a bearish retracement which likely to continue for a couple of days and look for buying trade based on the significant zones.

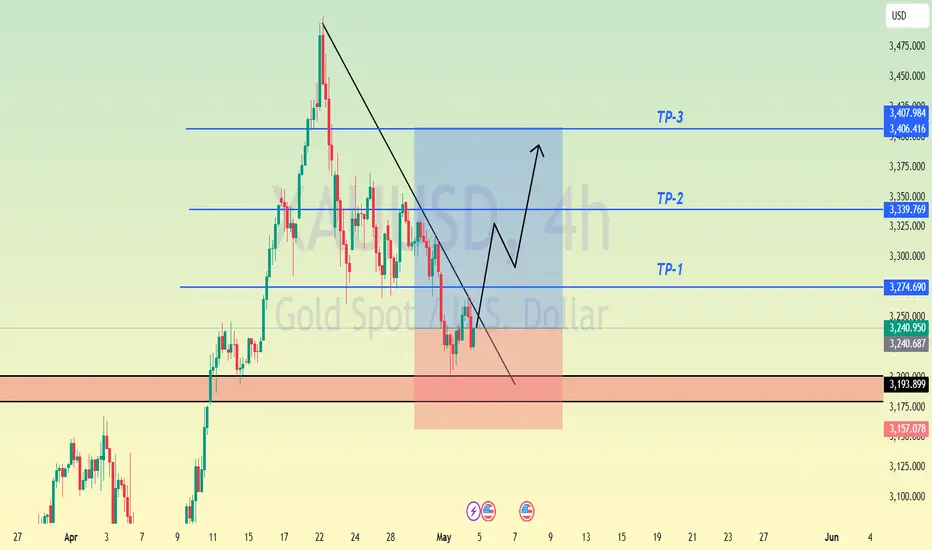
XAUUSD Update 08/May/2025Today's gold movement is stuck in a sideways movement due to waiting for the results of the Fed (FOMC) meeting.
The current price is at its support, the greatest possibility is to continue its bullish movement.
Target 3470 - 80 level price
Good Luck !

move below 3273-3270 zone and wait for reaction from US NF news🔔🔔🔔 Gold news:
➡️ Gold prices are holding modest gains heading into the European session, though bullish conviction remains lacking, and the metal continues to trade below the key $3,265–$3,2703 support-turned-resistance zone. Meanwhile, the US dollar has come under some selling pressure, snapping a three-day winning streak after hitting a three-week high.
➡️ A mix of factors is discouraging traders from making aggressive bullish bets, thereby capping further upside in the precious metal. Investors remain hopeful for easing trade tensions between the United States and China—the world’s two largest economies. This optimism supports a broader risk-on sentiment, which in turn undermines demand for safe-haven assets like gold.
Personal opinion:
➡️ The 3265–3273 zone is a strong resistance zone for gold. A break above this zone would mean the end of the short-term downtrend and vice versa. Therefore, buyers and sellers will be aggressive to secure this zone. Today's US NF news will be a strong driving force for gold prices before the tariff information appears and covers the market.
➡️ Analysis based on resistance - support levels and trend lines combined with EMA to come up with a suitable strategy
Personal Plan:
🔆Price Zone Setup:
👉Buy Gold 3202- 3205
❌SL: 3198 | ✅TP: 3210 - 3215 – 3220
👉Sell Gold 3270 - 3272
❌SL: 3276 | ✅TP: 3266 - 3261 – 3255
FM wishes you a successful trading day 💰💰💰

GOLD FOMC Interest Rate Decision (May 7, 2025)
The Federal Reserve held rates steady at 4.25%–4.50%, maintaining its stance since December 2024. The decision reflects heightened uncertainty from escalating U.S.-China trade tensions and mixed economic signals, including stagflation risks (rising unemployment and inflation). Chair Jerome Powell emphasized vigilance toward trade policy impacts but avoided signaling imminent rate cuts, despite market expectations for easing later in 2025.
Geopolitical Conflicts Affecting Gold Prices
U.S.-China Trade War Escalation
New tariffs and retaliatory measures have intensified safe-haven demand for gold. Prices hit record highs in April 2025 (NT$3,518/gram in Taiwan) as investors sought protection from market volatility.
Renewed trade talks (e.g., U.S.-China meetings in Switzerland) caused a brief 1.3% gold price dip on optimism, but analysts project prices to rebound to $3,500–$4,000/oz by late 2025 amid unresolved tensions.
Central Bank Gold Accumulation
Central banks, led by China and Russia, are aggressively stockpiling gold to diversify from USD assets and hedge against sanctions.
Prolonged military tensions continue to drive gold’s role as a crisis hedge. Escalation could push prices higher, while de-escalation might temporarily reduce demand.
Middle East Instability
Conflicts between Iran and Saudi Arabia disrupt global supply chains and energy markets, amplifying gold’s appeal as a safe haven during periods of heightened risk.
Dollar Weakness and Inflation Risks
A declining U.S. Dollar Index (-0.3% on May 7) and tariff-driven inflation fears have bolstered gold’s attractiveness. The Fed’s cautious stance on rate cuts reinforces gold’s appeal in a negative real yield environment.
Gold Price Outlook
Short-term: Prices may face volatility from trade talk progress or Fed policy shifts but remain supported by geopolitical risks and central bank buying.
Long-term: Analysts (e.g., UBS, Bank of America) forecast gold reaching $3,500–$4,000/oz in 2025 due to structural demand, tariff impacts, and unresolved global conflicts.
In summary, gold’s trajectory hinges on geopolitical stability, central bank actions, and Fed policy, with bullish momentum likely to persist amid fragmented global trade and economic uncertainty.

( Gold ) Bearish Reversal Setup via Head and Shoulders Pattern Gold is showing signs of a potential short-term bearish reversal as a clear Head and Shoulders pattern has formed on the 30-minute chart. The price is testing the neckline near 3394, where a breakdown could trigger a move toward the 3330–3320 support zone.
🔍 Technical Analysis:
Pattern: Classic Head and Shoulders, indicating a possible shift in market structure.
Neckline level: Around 3394 – a break below confirms the pattern.
Indicator. Price is testing the lower boundary of the cloud; a clean break through supports the bearish case.
Volume Observation: Decreasing volume on right shoulder, suggesting buying momentum is fading.
Bearish Targets: Projected move based on pattern structure points toward 3330–3320.
🧠 Fundamental Backdrop:
U.S. Dollar Strength: Recent hawkish Fed comments and stronger-than-expected U.S. economic data are boosting the USD, putting pressure on gold prices.
Interest Rate Outlook: Rising yields are reducing gold’s appeal as a non-yielding asset.
Geopolitical Calm: Lack of fresh geopolitical tensions reduces safe-haven demand temporarily.
Inflation Outlook: Stabilizing inflation may also reduce urgency for gold hedging.
💡 Trade Plan:
Short Entry: 3394 (after neckline break confirmation)
Target Zone: 3330–3320
Stop Loss: Above 3410
Risk-Reward Ratio: ~2:1 depending on final entry/exit points
Must Support Me Share My Idea With Your Firends Mention Your Feed back Comment Section
📌 Note: Wait for confirmation with a strong candle close below the neckline and increased volume before entering the trade. This is not financial advice. Please conduct your own research and manage risk accordingly.
